7smodel
•Descargar como DOCX, PDF•
2 recomendaciones•863 vistas

different models used in strategic management..............

Recomendados
Recomendados
Más contenido relacionado
La actualidad más candente
La actualidad más candente (20)
Destacado
Similar a 7smodel
Similar a 7smodel (20)
Último
Último (20)
7smodel
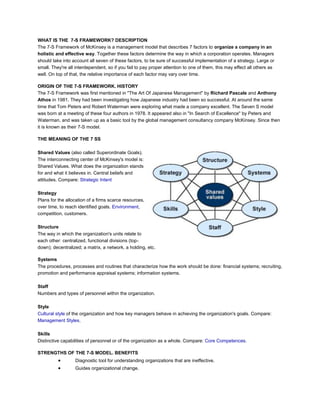
- 1. WHAT IS THE 7-S FRAMEWORK? DESCRIPTION The 7-S Framework of McKinsey is a management model that describes 7 factors to organize a company in an holistic and effective way. Together these factors determine the way in which a corporation operates. Managers should take into account all seven of these factors, to be sure of successful implementation of a strategy. Large or small. They're all interdependent, so if you fail to pay proper attention to one of them, this may effect all others as well. On top of that, the relative importance of each factor may vary over time. ORIGIN OF THE 7-S FRAMEWORK. HISTORY The 7-S Framework was first mentioned in "The Art Of Japanese Management" by Richard Pascale and Anthony Athos in 1981. They had been investigating how Japanese industry had been so successful. At around the same time that Tom Peters and Robert Waterman were exploring what made a company excellent. The Seven S model was born at a meeting of these four authors in 1978. It appeared also in "In Search of Excellence" by Peters and Waterman, and was taken up as a basic tool by the global management consultancy company McKinsey. Since then it is known as their 7-S model. THE MEANING OF THE 7 SS Shared Values (also called Superordinate Goals). The interconnecting center of McKinsey's model is: Shared Values. What does the organization stands for and what it believes in. Central beliefs and attitudes. Compare: Strategic Intent Strategy Plans for the allocation of a firms scarce resources, over time, to reach identified goals. Environment, competition, customers. Structure The way in which the organization's units relate to each other: centralized, functional divisions (top- down); decentralized; a matrix, a network, a holding, etc. Systems The procedures, processes and routines that characterize how the work should be done: financial systems; recruiting, promotion and performance appraisal systems; information systems. Staff Numbers and types of personnel within the organization. Style Cultural style of the organization and how key managers behave in achieving the organization's goals. Compare: Management Styles. Skills Distinctive capabilities of personnel or of the organization as a whole. Compare: Core Competences. STRENGTHS OF THE 7-S MODEL. BENEFITS Diagnostic tool for understanding organizations that are ineffective. Guides organizational change.
- 2. Combines rational and hard elements with emotional and soft elements. Managers must act on all Ss in parallel and all Ss are interrelated. Inside-out strategy. Explanation of Core Competence of Hamel and Prahalad. The Core Competence model of Hamel and Prahalad is a corporate strategy model that starts the strategy process by thinking about the core strengths of an organization. INSIDE-OUT CORPORATE STRATEGY The Outside-in approach (such as the Five Forces model from Porter) places the market, the competition, and the customer at the starting point of the strategy process. The Core Competence model does the opposite by stating that in the long run, competitiveness derives from an ability to build a Core Competence, at lower cost and more speedily than competitors. The Core Competence may result in unanticipated products. The real sources of advantage are to be found in management's ability to consolidate corporate-wide technologies and production skills into competencies, through which individual businesses can adapt quickly to changing circumstances. A Core Competence can be any combination of specific, inherent, integrated and applied knowledge, skills and attitudes. In their article "The Core Competence of the Corporation" (1990), Prahalad and Gary Hamel dismiss the portfolio perspective as a viable approach to corporate strategy. In their view, the primacy of the Strategic Business Unit is now clearly an anachronism. Hamel and Prahalad argue that a corporation should be built around a core of shared competences. Compare: Horizontal Integration. Business units must use and help to further develop the CC(s). The corporate center should not be just another layer of accounting, but must add value by articulating the strategic architecture that guides the process of competence building. THREE TESTS FOR IDENTIFYING A CORE COMPETENCE 1. Provides potential access to a wide variety of markets. 2. Makes a significant contribution to the benefits of the product as perceived by the customer. 3. A CC should be difficult for competitors to imitate. BUILDING A CORE COMPETENCE A Core Competence is built through a process of continuous improvement and enhancement (compare:
- 3. Kaizen). It should constitute the focus for corporate strategy. At this level, the goal is to build world leadership in the design and development of a particular class of product functionality. Top management can not be just another layer of accounting, but must add value by articulating the strategic architecture that guides the process of competence building. Once top management (with the help of Strategic Business Units managers) have identified an all- embracing Core Competence, it must ask businesses to identify the projects and the people that are closely connected with it. Corporate auditors should perform an audit of the location, number, and quality of the people related to the CC. CC carriers should be brought together frequently to share ideas. CORE RIGIDITIES? Care must be taken not to let core competencies develop into core rigidities. A Corporate Competence is difficult to learn, but is difficult to unlearn as well. Companies that have spared no effort to achieve a competence, sometimes neglect new market circumstances or demands. They risk to be locked in by choices that were made in the past. Portfolio Management based on Market Share and Market Growth. Explanation of BCG Matrix. ('70) The BCG Matrix method is the most well-known portfolio management tool. It is based on product life cycle theory. It was developed in the early 70s by the Boston Consulting Group. The BCG Matrix can be used to determine what priorities should be given in the product portfolio of a business unit. To ensure long-term value creation, a company should have a portfolio of products that contains both high-growth products in need of cash inputs and low-growth products that generate a lot of cash. The Boston Consulting Group Matrix has 2 dimensions: market share and market growth. The basic idea behind it is: if a product has a bigger market share, or if the product's market grows faster, it is better for the company.
- 4. THE FOUR SEGME NTS OF THE BCG MATRIX Placing products in the BCG matrix provides 4 categorie s in a portfolio of a company : S t a r s (high growth, high market share) o Stars are using large amounts of cash. Stars are leaders in the business. Therefore they should also generate large amounts of cash. o Stars are frequently roughly in balance on net cash flow. However if needed any attempt should be made to hold your market share in Stars, because the rewards will be Cash Cows if market share is kept. Cash Cows (low growth, high market share) o Profits and cash generation should be high. Because of the low growth, investments which are needed should be low. o Cash Cows are often the stars of yesterday and they are the foundation of a company. Dogs (low growth, low market share) o Avoid and minimize the number of Dogs in a company. o Watch out for expensive ‘rescue plans’. o Dogs must deliver cash, otherwise they must be liquidated. Question Marks (high growth, low market share) o Question Marks have the worst cash characteristics of all, because they have high cash demands and generate low returns, because of their low market share. o If the market share remains unchanged, Question Marks will simply absorb great amounts of cash. o Either invest heavily, or sell off, or invest nothing and generate any cash that you can. Increase market share or deliver cash. THE BCG MATRIX AND ONE SIZE FITS ALL STRATEGIES
- 5. The BCG Matrix method can help to understand a frequently made strategy mistake: having a one size fits all strategy approach, such as a generic growth target (9 percent per year) or a generic return on capital of say 9,5% for an entire corporation. In such a scenario: Cash Cows Business Units will reach their profit target easily. Their management have an easy job. The executives are often praised anyhow. Even worse, they are often allowed to reinvest substantial cash amounts in their mature businesses. Dogs Business Units are fighting an impossible battle and, even worse, now and then investments are made. These are hopeless attempts to "turn the business around". As a result all Question Marks and Stars receive only mediocre investment funds. In this way they can never become Cash Cows. These inadequate invested sums of money are a waste of money. Either these SBUs should receive enough investment funds to enable them to achieve a real market dominance and become Cash Cows (or Stars), or otherwise companies are advised to disinvest. They can then try to get any possible cash from the Question Marks that were not selected. OTHER USES AND BENEFITS OF THE BCG MATRIX If a company is able to use the experience curve to its advantage, it should be able to manufacture and sell new products at a price that is low enough to get early market share leadership. Once it becomes a star, it is destined to be profitable. BCG model is helpful for managers to evaluate balance in the firm’s current portfolio of Stars, Cash Cows, Question Marks and Dogs. BCG method is applicable to large companies that seek volume and experience effects. The model is simple and easy to understand. It provides a base for management to decide and prepare for future actions. LIMITATIONS OF THE BCG MATRIX Some limitations of the Boston Consulting Group Matrix include: It neglects the effects of synergy between business units. High market share is not the only success factor. Market growth is not the only indicator for attractiveness of a market. Sometimes Dogs can earn even more cash as Cash Cows. The problems of getting data on the market share and market growth. There is no clear definition of what constitutes a "market". A high market share does not necessarily lead to profitability all the time. The model uses only two dimensions – market share and growth rate. This may tempt management to emphasize a particular product, or to divest prematurely. A business with a low market share can be profitable too. The model neglects small competitors that have fast growing market shares. Measuring corporate reputation by capturing the perceptions of stakeholder groups. Explanation of Corporate Reputation Quotient of Harris-Fombrun. The Corporate Reputation Quotient of Harris-Fombrun is a comprehensive measuring method of corporate reputation that was created specifically to capture the perceptions of any corporate stakeholder group such as consumers, investors, employees, or key influencers. The instrument enables research on the drivers of a
- 6. company's reputation, and allows to compare reputations both within and across industries. SIX DRIVERS OF THE CORPORATE REPUTATION QUOTIENT This business reputation model has the following 6 drivers of corporate reputation with subsequent 20 attributes: Emotional Appeal Workplace Environment - good feeling about the company - is well managed - admire and respect the company - appears to be a good company to work for - trust the company - appears to have good employees Products and Services Financial Performance - company believes in its products and services - history of profitability - company offers high quality products and services - appears a low risk investment - develops innovative products and services - strong prospects for future growth - offers products and services that are good value - tends to outperform its competitors Vision and Leadership Social Responsibility - has excellent leadership - supports good causes - has a clear vision for the future - environmentally responsible - recognizes and takes advantage of market opportunities - treats people well Making random checks, these criteria taken together result in lists of most reputable and/or visible companies The basis of performing above-average within an industry. Explanation of Competitive Advantage of Michael Porter. According to the Competitive Advantage model of Porter, a competitive strategy takes offensive or defensive action to create a defendable position in an industry, in order to cope successfully with competitive forces and generate a superior Return on Investment. According to Michael Porter, the basis of above-average performance within an industry is sustainable competitive advantage. 2 BASIC TYPES OF COMPETITIVE ADVANTAGE 1. Cost Leadership (low cost)
- 7. 2. Differentiation Both can be more broadly approached or narrow, which results in the third viable competitive strategy: 3. Focus COMPETITIVE ADVANTAGE TYPE 1: COST LEADERSHIP Achieving Cost Leadership means that a firm sets out to become the low cost producer in its industry. A cost leader must achieve parity or at least proximity in the bases of differentiation, even though it relies on cost leadership for its competitive advantage. If more than one company try to achieve Cost Leadership, this is usually disastrous. Often achieved by economies of scale. COMPETITIVE ADVANTAGE TYPE 2: DIFFERENTIATION Achieving of Differentiation means that a firm seeks to be unique in its industry along some dimensions that are widely appreciated by buyers. A differentiator can not ignore its cost position. In all areas that do not affect its differentiation it should try to decrease cost; in the differentiation area the costs should at least be lower than the price premium it receives from the buyers. Areas of differentiation can be: product, distribution, sales, marketing, service, image, etc. COMPETITIVE ADVANTAGE TYPE 3: FOCUS Achieving Focus means that a firm sets out to be best in a segment or group of segments. 2 variants: Cost Focus and Differentiation Focus. STUCK IN THE MIDDLE This is usually a recipe for below-average profitability compared to the industry. Still, attractive profits are possible if and as long as the industry as a whole is very attractive. Manifestation of lack of choice. Especially dangerous for Focusers that have been successful, and then start neglecting their focus. They must seek other Focus niches. Rather then compromise their focus strategy. OVERVIEW OF THE BOOK "COMPETITIVE STRATEGY" In Part I, Porter discusses the structural analysis of industries (with the five forces), the three generic competitive strategies (overall Cost Leadership, Focus, and Differentiation), offering an excellent framework for competitor analysis, competitive moves, strategy toward buyers and suppliers, structural analysis within industries (strategic groups, strategic mapping, mobility barriers), and industry evolution (life cycle, evolutionary processes). In Part II, Porter discusses competitive strategy within various generic industry environments. Such as: fragmented industries (with no real market leader), emerging industries, mature industries, declining industries, and global industries. In Part III, Porter discusses strategic decisions which businesses/firms can take. Such as: vertical integration (forward, backward, partnerships), capacity expansion, and entry into new industries/businesses. Outside-in Business Strategy. Explanation of Five Competitive Forces of Michael Porter.
- 8. WHAT IS THE FIVE FORCES MODEL OF PORTER? DESCRIPTION The Five Forces model of Porter is an Outside-in business unit strategy tool that is used to make an analysis of the attractiveness (value) of an industry structure. The Competitive Forces analysis is made by the identification of 5 fundamental competitive forces: 1. Entry of competitors. How easy or difficult is it for new entrants to start competing, which barriers do exist. 2. Threat of substitutes. How easy can a product or service be substituted, especially made cheaper. 3. Bargaining power of buyers. How strong is the position of buyers. Can they work together in ordering large volumes. 4. Bargaining power of suppliers. How strong is the position of sellers. Do many potential suppliers exist or only few potential suppliers, monopoly? 5. Rivalry among the existing players. Does a strong competition between the existing players exist? Is one player very dominant or are all equal in strength and size. Sometimes a sixth competitive force is added: 6. Government. Porter's Competitive Forces model is probably one of the most often used business strategy tools. It has proven its usefulness on numerous occasions. Porter's model is particularly strong in thinking Outside-in. THREAT OF NEW ENTRANTS DEPENDS ON: Economies of scale. Capital / investment requirements. Customer switching costs. Access to industry distribution channels. Access to technology. Brand loyalty. Are customers loyal? The likelihood of retaliation from existing industry players. Government regulations. Can new entrants get subsidies? THREAT OF SUBSTITUTES DEPENDS ON: Quality. Is a substitute better? Buyers' willingness to substitute. The relative price and performance of substitutes. The costs of switching to substitutes. Is it easy to change to another product?
- 9. BARGAINING POWER OF SUPPLIERS DEPENDS ON: Concentration of suppliers. Are there many buyers and few dominant suppliers? Compare: Kraljic Model. Branding. Is the brand of the supplier strong? Profitability of suppliers. Are suppliers forced to raise prices? Suppliers threaten to integrate forward into the industry (for example: brand manufacturers threatening to set up their own retail outlets). Buyers do not threaten to integrate backwards into supply. Role of quality and service. The industry is not a key customer group to the suppliers. Switching costs. Is it easy for suppliers to find new customers? BARGAINING POWER OF BUYERS DEPENDS ON: Concentration of buyers. Are there a few dominant buyers and many sellers in the industry? Differentiation. Are products standardized? Profitability of buyers. Are buyers forced to be tough? Role of quality and service. Threat of backward and forward integration into the industry. Switching costs. Is it easy for buyers to switch their supplier? INTENSITY OF RIVALRY DEPENDS ON: The structure of competition. Rivalry will be more intense if there are lots of small or equally sized competitors; rivalry will be less if an industry has a clear market leader. The structure of industry costs. Industries with high fixed costs encourage competitors to manufacture at full capacity by cutting prices if needed. Degree of product differentiation. Industries where products are commodities (e.g. steel, coal) typically have greater rivalry. Switching costs. Rivalry is reduced when buyers have high switching costs. Strategic objectives. If competitors pursue aggressive growth strategies, rivalry will be more intense. If competitors are merely "milking" profits in a mature industry, the degree of rivalry is typically low. Exit barriers. When barriers to leaving an industry are high, competitors tend to exhibit greater rivalry. STRENGTHS OF THE FIVE COMPETITIVE FORCES MODEL. BENEFITS The model is a strong tool for competitive analysis at industry level. Compare: PEST Analysis It provides useful input for performing a SWOT Analysis. LIMITATION OF PORTER'S FIVE FORCES MODEL Care should be taken when using this model for the following: do not underestimate or underemphasize the importance of the (existing) strengths of the organization (Inside-out strategy). See: Core Competence The model was designed for analyzing individual business strategies. It does not cope with synergies and interdependencies within the portfolio of large corporations. See: Parenting Advantage From a more theoretical perspective, the model does not address the possibility that an industry could be attractive because certain companies are in it. Some people claim that environments which are characterized by rapid, systemic and
- 10. radical change require more flexible, dynamic or emergent approaches to strategy formulation. See: Disruptive Innovation Sometimes it may be possible to create completely new markets instead of selecting from existing ones. See: Blue Ocean Strategy OVERVIEW OF THE BOOK "COMPETITIVE STRATEGY" In Part I, Porter discusses the structural analysis of industries (with the five forces), the three generic competitive strategies (overall Cost Leadership, Focus, and Differentiation), offering an excellent framework for competitor analysis, competitive moves, strategy toward buyers and suppliers, structural analysis within industries (strategic groups, strategic mapping, mobility barriers), and industry evolution (life cycle, evolutionary processes). In Part II, Porter discusses competitive strategy within various generic industry environments. Such as: fragmented industries (with no real market leader), emerging industries, mature industries, declining industries, and global industries. In Part III, Porter discusses strategic decisions which businesses/firms can take. Such as: vertical integration (forward, backward, partnerships), capacity expansion, and entry into new industries/businesses.
- 11. Analyse activities through which firms can create value. Explanation of Value Chain Framework of Michael Porter. ('85) The Value Chain framework of Michael Porter is a model that helps to analyze specific activities through which firms can create value and competitive advantage. THE ACTIVITIES OF THE VALUE CHAIN P rimary activities (line functions) o I n b o u n d L o g i s t ics. Includes receiving, storing, inventory control, transportation planning. o Operations. Includes machining, packaging, assembly, equipment maintenance, testing and all other value-creating activities that transform the inputs into the final product. o Outbound Logistics. The activities required to get the finished product at the customers: warehousing, order fulfillment, transportation, distribution management. o Marketing and Sales. The activities associated with getting buyers to purchase the product, including: channel selection, advertising, promotion, selling, pricing, retail management, etc. o Service. The activities that maintain and enhance the product's value, including: customer support, repair services, installation, training, spare parts management, upgrading, etc. Support activities (Staff functions, overhead) o Procurement. Procurement of raw materials, servicing, spare parts, buildings, machines, etc. o Technology Development. Includes technology development to support the value chain activities. Such as: Research and Development, Process automation, design, redesign. o Human Resource Management. The activities associated with recruiting,
- 12. development (education), retention and compensation of employees and managers. o Firm Infrastructure. Includes general management, planning management, legal, finance, accounting, public affairs, quality management, etc. CREATING A COST ADVANTAGE BASED ON THE VALUE CHAIN A firm may create a cost advantage: by reducing the cost of individual value chain activities, or by reconfiguring the value chain. Note that a cost advantage can be created by reducing the costs of the primary activities, but also by reducing the costs of the support activities. Recently there have been many companies that achieved a cost advantage by the clever use of Information Technology. Once the value chain has been defined, a cost analysis can be performed by assigning costs to the value chain activities. Porter identified 10 cost drivers related to value chain activities: 1. Economies of scale. 2. Learning. 3. Capacity utilization. 4. Linkages among activities. 5. Interrelationships among business units. 6. Degree of vertical integration. 7. Timing of market entry. 8. Firm's policy of cost or differentiation. 9. Geographic location. 10. Institutional factors (regulation, union activity, taxes, etc.). A firm develops a cost advantage by controlling these drivers better than its competitors do. A cost advantage also can be pursued by "Reconfiguring" the value chain. "Reconfiguration" means structural changes such as: a new production process, new distribution channels, or a different sales approach. Normally, the Value Chain of a company is connected to other Value Chains and is part of a larger Value Chain. Developing a competitive advantage also depends on how efficiently you can analyze and manage the entire Value Chain. This idea is called: Supply Chain Management. Some people argue that network is actually a better word to describe the physical form of Value Chains: Value Networks. Alleviate world poverty. Do not treat the poor as victims or as a burden. Explanation of Bottom of the Pyramid of C.K. Prahalad. ('02, '05)
- 13. WHAT IS THE BOTTOM OF THE PYRAMID? DESCRIPTION The bottom of the (economic) pyramid consists of the 4 billion people living on less than $2 per day. For more than 50 years, the World Bank, donor nations, various aid agencies, national governments, and, lately, civil society organizations have all done their best, but they were unable to eradicate poverty. Aware of this frustrating fact, C.K. Prahalad begins his book: "The Fortune at the Bottom of the Pyramid" with a simple yet revolutionary proposition: If we stop thinking of the poor as victims or as a burden and start recognizing them as resilient and creative entrepreneurs and value-conscious consumers, a whole new world of opportunity will open up. Prahalad suggests that four billion poor can be the engine of the next round of global trade and prosperity, and can be a source of innovations. Serving the Bottom of the Pyramid customers requires that large firms work collaboratively with civil society organizations and local governments. Furthermore, market development at the Bottom of the Pyramid will also create millions of new entrepreneurs at the grass roots level. Prahalad presents his new view regarding solving the problem of poverty as a Co-Creation solution towards economic development and social transformation (figure), of which the parties involved are: Private enterprises Development and aid agencies Bottom of the Pyramid consumers Bottom of the Pyramid entrepreneurs Civil society organizations and local government 12 PRINCIPLES OF INNOVATION FOR BOTTOM OF THE PYRAMID MARKETS Prahalad provides the following building blocks for creating products and services for Bottom of the Pyramid markets: 1. Focus on (quantum jumps in) price performance. 2. Hybrid solutions, blending old and new technology. 3. Scaleable and transportable operations across countries, cultures and languages. 4. Reduced resource intensity: eco-friendly products. 5. Radical product redesign from the beginning: marginal changes to existing Western products will not work. 6. Build logistical and manufacturing infrastructure. 7. Deskill (services) work. 8. Educate (semiliterate) customers in product usage.
- 14. 9. Products must work in hostile environments: noise, dust, unsanitary conditions, abuse, electric blackouts, water pollution. 10. Adaptable user interface to heterogeneous consumer bases. 11. Distribution methods should be designed to reach both highly dispersed rural markets and highly dense urban markets. 12. Focus on broad architecture, enabling quick and easy incorporation of new features. ORIGIN OF THE BOTTOM OF THE PYRAMID. HISTORY Before his 2005 book, Prahalad published two articles regarding this framework about alleviating poverty: Jan 2002: The Fortune at the Bottom of the Pyramid (Strategy+Business), with Stu Hart Sep 2002: Serve the World's Poor, Profitable (Harvard Business Review), with Allen Hammond USAGE OF THE BOTTOM OF THE PYRAMID. APPLICATIONS This framework provides an impetus for a more active involvement of the private sector in building the marketing ecosystems for transforming the Bottom of the Pyramid. Helps to reconsider and change long held beliefs, assumptions and ideologies. Provides clues on developing products and services for Bottom of the Pyramid consumers. STRENGTHS OF BOTTOM OF THE PYRAMID THINKING. BENEFITS The biggest strengths of the Bottom of the Pyramid approach by Prahalad is, that it helps to reconsider and change long held beliefs, assumptions, and ideologies, which are all based on and are supporting victim- and burden thinking: There is money at the Bottom of the Pyramid: it is a viable market. Access to Bottom of the Pyramid markets is not necessarily difficult. Unconventional approaches such as the Avon ladies approach may work. The poor are very brand-conscious. The Bottom of the Pyramid market has been connected (mobile phones, TV, Internet). Bottom of the Pyramid consumers are very much open towards advanced technology. ASSUMPTIONS OF THE BOTTOM OF THE PYRAMID. CONDITIONS 1. The poor can not participate in the benefits of globalization without an active involvement of the private sector and without access to products and services that represent global quality standards. 2. The Bottom of the Pyramid market provides a new growth opportunity for the private sector and a forum for innovations. Old and tried solutions cannot create markets at the Bottom of the Pyramid. 3. Bottom of the Pyramid markets must become an integral part of the work and of the core business of the private sector. Bottom of the Pyramid markets can not merely be left to the realm of Corporate Social Responsibility (CSR) initiatives.