Housing risk briefing_012714
•Descargar como PPTX, PDF•
0 recomendaciones•1,666 vistas

Briefing on National Mortgage Risk Index and Other Risk Measures for January 2014 from AEI's International Center on Housing Risk

Recomendados
Más contenido relacionado
Destacado
Similar a Housing risk briefing_012714
Similar a Housing risk briefing_012714 (20)
Más de AEI
Más de AEI (20)
Último
Último (20)
Housing risk briefing_012714
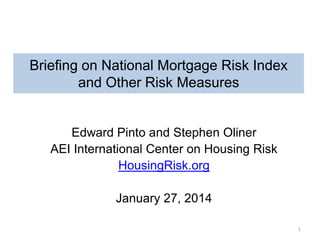
- 1. Briefing on National Mortgage Risk Index and Other Risk Measures Edward Pinto and Stephen Oliner AEI International Center on Housing Risk HousingRisk.org January 27, 2014 1
- 2. Background • Financial crisis largely stemmed from a failure to understand build-up of housing risk: – Mortgage risk – House-price (collateral) risk – Capital adequacy • AEI’s International Center on Housing Risk (HousingRisk.org) is addressing this problem: – Will provide objective and transparent risk measures – National Mortgage Risk Index (NMRI) is now available – Indices of collateral risk and capital adequacy to be released later this year 2
- 3. The NMRI • Principles behind the NMRI – Market stability depends on the preponderance of loans being low risk, defined as good performance under stress – NMRI provides a stress test, similar to crash tests for cars and structural stability ratings for buildings in hurricane zones • Basics of index construction and coverage – Places loans in risk buckets and assesses default risk based on performance of 2007 vintage loans with similar characteristics – Currently covers nearly all gov’t-guaranteed mortgages for home purchases (about 75% of all purchase loans) – Coverage will be expanded later this year 3
- 4. NMRI for Home Purchase Loans All indexes shown are high relative to prudent standards and have trended up. Stressed default rate 24% FHA/RHS accounts for 30% of all purchase loans and is the main factor behind high level of composite index. 24% FHA/RHS: +1.3 ppt, from 22.2% to 23.5%* 20% 20% 16% 16% Shifts in market share caused the composite index to decline from Nov. to Dec. even though the components were steady or edged up. 12% 12% Composite: +0.2 ppt, from 10.6% to 10.8%* 8% 8% Fannie/Freddie: +0.9 ppt, from 4.9% to 5.8%* 4% 4% Oct-12 Nov-12 Dec-12 Jan-13 Feb-13 Mar-13 Apr-13 May-13 Jun-13 Jul-13 Aug-13 Sep-13 Oct-13 Nov-13 Dec-13 * Index changes measured from first month shown. Source: AEI International Center on Housing Risk, www.HousingRisk.org. Separate index not available for VA guaranteed loans. RHS is Rural Housing Service. 4
- 5. Calibrating Mortgage Safety Latest date Dec. Latest Value 10.8% 1935-1955 vintages (est.) NA 1990 vintage (est.) 6% 2007 vintage (est.) 19% Fannie and Freddie Dec. 5.8% NA 4% 13% FHA Dec. 24.1% 3% 15% 30% NMRI - purchase loans Composite index A low-risk loan has an average default rate under stress of 3% and a maximum default rate of less than 6%. An index value of less than 6% is indicative of conditions conducive to a stable market. • Composite index substantially above 1990 level, but not approaching 2007 level when underwriting was exceptionally lax. • Fannie/Freddie index somewhat above 1990 level and rising. • FHA index extremely high and rising. Sharp contrast with safe underwriting during 1935-55. 5
- 6. Purchase Loan Origination Shares, by Risk Level Less than half of new purchase loans are low risk, and the share has edged lower on net since Aug. Likely would lead to market difficulties in event of recession. 50% 50% Low risk 45% 45% 40% 40% Low risk defined as stressed default rate of less then 6%, medium risk is 6% to 12%, and high risk is 12% or higher. 35% 35% High risk 30% 30% 25% 25% Medium risk 20% 20% Aug-13 Sep-13 Source: AEI International Center on Housing Risk, www.HousingRisk.org. Oct-13 Nov-13 Dec-13 6
- 7. GSE Low-Risk Origination Shares, Purchase Loans Downward trend, especially for Fannie Mae. 74% 74% 72% 72% Freddie Mac 70% 70% 68% 68% 66% 66% Combined 64% 64% Note: FHA/RHS low-risk share (not shown) is about 2%. 62% 62% Fannie Mae 60% 60% Oct-12 Nov-12 Dec-12 Jan-13 Feb-13 Mar-13 Apr-13 May-13 Jun-13 Source: AEI International Center on Housing Risk, www.HousingRisk.org. Jul-13 Aug-13 Sep-13 Oct-13 Nov-13 Dec-13 7
- 8. Fannie Mae Share of GSE Purchase Loan Volume Has increased since Q2, coinciding with greater riskiness of Fannie’s loan acquisitions. 69% 68% 67% 66% 65% 64% 63% 62% 61% 60% 59% 2012:Q4 2013:Q1 Source: AEI International Center on Housing Risk, www.HousingRisk.org. 2013:Q2 2013:Q3 2013:Q4 8
- 9. Purchase Loans with DTI Greater Than 43% Nearly one in four loans don’t meet DTI limit in QM – and likely won’t going forward because Federally guaranteed loans are exempt from limit. 50% 50% FHA/RHS 40% 40% 30% 30% Composite 20% 20% Fannie/Freddie 10% 10% Aug-13 Sep-13 Source: AEI International Center on Housing Risk, www.HousingRisk.org. Oct-13 Nov-13 Dec-13 9
- 10. Purchase Loans with Down Payment of 5% or Less Nearly half of all purchase loans and about a quarter of Fannie/Freddie purchase loans have a minimal down payment. 50% 50% Composite 45% 45% 40% 40% All FHA/RHS purchase loans are assumed to have down payment of less than 5%. 35% 35% 30% 30% 25% 25% Fannie/Freddie 20% 20% Oct-12 Nov-12 Dec-12 Jan-13 Feb-13 Mar-13 Apr-13 May-13 Jun-13 Source: AEI International Center on Housing Risk, www.HousingRisk.org. Jul-13 Aug-13 Sep-13 Oct-13 Nov-13 Dec-13 10
- 11. NMRI Releases in 2014 • Final Monday of each month (with exceptions in italics below) • Always at 10 AM (ET) Monday February 24 Monday March 31 Monday April 28 Tuesday May 27 Monday June 30 Monday July 28 Monday August 25 Monday September 29 Monday October 27 Monday November 24 Monday December 22 11