
Recomendados
Más contenido relacionado
Similar a Introduction to VEDAViz
Similar a Introduction to VEDAViz (20)
Último
Último (20)
Introduction to VEDAViz
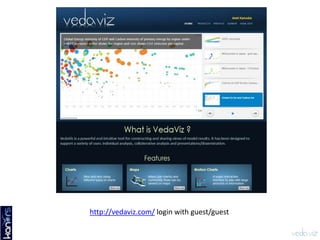
- 1. http://vedaviz.com/ login with guest/guest
- 2. What is VEDAViz? • A powerful and intuitive web tool for constructing and sharing views of model results. • Specifically designed for three distinct uses: – Individual analysis – Collaborative analysis – Dissemination
- 3. Import & Q-Checks Post-processing • Shares • Intensities • Growth rates • Scenario Differences Multi model/region/scenario results analysis with VEDAViz* ASP .NET/JSON/Web Svc * Versatile Data Analyst - Visualization OR IIASA snapshot Local www VedaViz is a powerful and intuitive web application for constructing and sharing views of model results. It has been designed to support a variety of uses: individual analysis, collaborative analysis and presentations/dissemination
- 4. Basic operations • Filter – allows filtering of multiple elements from each of the following dimensions: Scenario, Variable, Model, Region and Year. Can define sets of elements often selected together. • Configure – Any dimension can be: put on x-axis, summed over, used for small multiples or put on separate tabs • Render – Several predefined chart types, or even in tabular form (pivot table), which can be downloaded to Excel
- 5. Analysis with VEDAViz • Slice and dice using conventional charts (interactive) • Box plots • Scatter plots and animated charts • GIS capability – Trade flows – Regional variables on pie or column charts • Individual establishments (when GIS location available) – Heat maps (climate results) • Extract numerical data • Save chart images • Unit conversion
- 6. Collaboration and Dissemination • Visualizations can be saved as private or public (visible to other registered users) views • Each view supports a discussion page • Presenter – Observations can be attached to a saved view – A set of views, along with observations, can be available on a (password-protected) web link • Portal – A set of views can be displayed with scenario selections at the bottom, like the DECC calculator – Relevant mainly when there is a large number of scenarios – Useful even for non-modelers
- 7. Conclusion • It makes direct analysis of large volumes of data, like multi-model/scenario/region results, accessible to people who don’t write their own programs • For those who do, it can be very useful for picking deep- dive candidates • Notes – It is designed to be used interactively; not very good to produce images for documents. I normally use it directly for presentations and use other charting tools on data extracted from VEDAViz for text documents. – KanORS-EMR is willing to offer this application free of charge for multi-model comparison work in the IAMC community
- 8. VEDAViz uses powerful, flexible graphics to facilitate analysis and communication
- 10. Several advanced visualizations • Sankey diagrams, motion charts, box plots, scatter matrix etc. • Sankey example from Eurostat – Germany in year 2000 – Germany in year 2010 – What changed? • Sankey example from TIAM-World climate runs – What changed in 550ppm case over Ref?
- 11. Energy Security and Clean Air scenarios for Indian Power Sector: http://vedaviz.com/Portal/Playground.aspx?p=IMRT23Dec14&g=a24c44 Global electricity scenarios from TIAM-World(EMF27): http://vedaviz.com/Portal/Playground.aspx?p=FEMF27Sep27&g=ec12b8 Self-sufficiency/Climate/Costs tradeoffs for Japan: http://vedaviz.com/Portal/Playground.aspx?p=JMRT-PO01Oct13&g=77f822 Portals can be used to widen engagement
Notas del editor
- “interactive” means that mouse hovering does highlighting and information pop ups.