

Recomendados
Más contenido relacionado
Similar a Bagley: Infographic Guide - Your Personal Cheat Sheet
Similar a Bagley: Infographic Guide - Your Personal Cheat Sheet (20)
Más de ALATechSource
Más de ALATechSource (20)
Último
Último (20)
Bagley: Infographic Guide - Your Personal Cheat Sheet
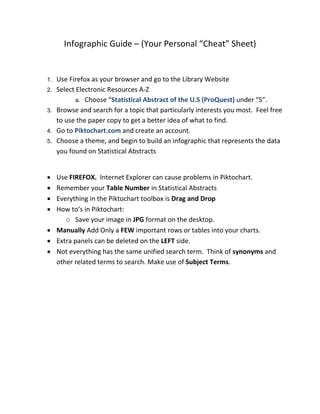
- 1. Infographic Guide – (Your Personal “Cheat” Sheet) 1. 2. 3. 4. 5. • • • • Use Firefox as your browser and go to the Library Website Select Electronic Resources A-Z a. Choose “Statistical Abstract of the U.S (ProQuest) under “S”. Browse and search for a topic that particularly interests you most. Feel free to use the paper copy to get a better idea of what to find. Go to Piktochart.com and create an account. Choose a theme, and begin to build an infographic that represents the data you found on Statistical Abstracts Use FIREFOX. Internet Explorer can cause problems in Piktochart. Remember your Table Number in Statistical Abstracts Everything in the Piktochart toolbox is Drag and Drop How to’s in Piktochart: o Save your image in JPG format on the desktop. • Manually Add Only a FEW important rows or tables into your charts. • Extra panels can be deleted on the LEFT side. • Not everything has the same unified search term. Think of synonyms and other related terms to search. Make use of Subject Terms.