SlideShare a Scribd company logo
1 of 11
Production processes


Section 4.1 presents the general situation of China as exporter of embodied
polluting emissions. Sections 4.2 and 4.3 analyze the emissions occurred in the
iron and aluminium production processes.

1.1 China introduction

1.1.1 Pollution

Forbes Magazine reports that all 10 of the 10 most polluted cities in the world
are in China (Forbes 2006). One third of Chinese territory is affected by acid
rain (Wassermann 2009). China's polluted environment is the result of its rapid
development and the large increase in primary energy consumption, which is
primarily provided by coal power plants (Yi et al. 2007). One of the serious
negative consequences of the coal-based-driven development has been
increased pollution, smog, and degradation of natural resources (ibid.). Much
solid waste is not properly disposed of; water pollution is a source of health
problems across the country; and air pollution causes up to 1,750,000
premature deaths each year (ibid.).

Coal largely dominates China’s primary energy consumption, accounting for as
high as 67% in 2003, compared to only 23.5% for the world average in 2000
(Chen 2007). This primary energy consumption increased by 278% from 1980
to 2003, with an annual growth rate of 4.55% (Figure 1) (ibid.).


Figure 1- China’s primary energy consumption during 1980–2003 (Chen 2007)
Chinese industry consumes mostly coal and electricity, which is also produced
mainly by coal-fired power plants in China (Yanjia and Chandler 2009). Oil and
natural gas make up only 5% of the total energy consumption (ibid.). Coal
covers about 65% of primary energy production (Table 1), over 60% of the total
internal energy demand, 80% of the fuel used by thermal power plants to
generate electricity, and 40% of the final fuel used by final consumption sectors
(Palazuelos and Garcia 2008). The high share of coal, as well as some
inefficiencies in processes, which are getting reduced through technological
improvements, are the reasons why China-made products have relatively high
carbon content (Sinton et al. 2005; Xu 2002; Palazuelos and Garcia 2008). The
shift to cleaner energy is a challenge that China must tackle in the coming years
(BECon 2004; Crompton and Wu 2005; Lin 2005; Levine 2006; Jiang 2007).

Table 1- Total production and offer of primary energy. Elaborated with data from IEA
(2006a). (1): Oil-equivalent tones.


China has recently overtaken the USA as the world largest emitter of CO2
(Wassermann 2009). Within 5 years, China’s CO2 emissions have nearly
doubled (Weber et al. 2008).

Templet (2001) reflects that subsidized energy prices in countries like China
leads to inefficient allocation, higher pollution and efficiency loss by the
economy.

1.1.2 Economic growth

For more than 25 years until 2007, China’s GDP growth has exceeded 10%
annually, more than double that of low and middle income economies and well
over three times the figure posted by high-income nations (Table 2) (Bustelo
2007).
Table 2- Comparison of average annual GDP growths (%) (Source: World Bank) (Bustelo
2007)


China’s share on world GDP rose from 3.4% in 1980 to 15.4% in 2005, while
the US's share remained steady at around 21% and the joint share of the
countries that make up the EU today fell from 29% to 21% (Figure 2) (ibid.).


Figure 2- Weight in world gross product 1980-2006 (Source: IMF) (Bustelo 2007)

China’s competitive advantages are notably cheap land and cheap labor (Helm
2008). Bustelo (2007) adds other significant strengths, such as a high savings
rate, a Confucian work ethic, a rising middle class that could reach 150 million
people by 2010, and a substantial degree of integration in the world economy.
He also refers some disadvantages, notably the inefficiency of the banking
sector, sharp inequality in regional and personal income distribution, corruption,
aging population, over-industrialization, excessive dependence on foreign
capital and growing energy dependence.

Banister (2005) estimated that China’s labor total compensation by 2002, when
data were first published, accounted for about 3% of the average hourly
compensation in the USA and other developed countries, 10% of the one in
their regional competitors and 25% of the one in other emerging economies like
Mexico and Brazil. Ceglowski and Golub’s (2007) estimations are compatible
with Banister’s: by 2004, the percentage against USA or Western European
countries was between 3% and 7%. Nevertheless, when the productivity level is
considered, they conclude that, by 2002, the relative unit labor cost in China
was around 25% the average in the EU and between 27 and 43% the one in the
USA (ibid.).

Chinese government plans a fourfold economy development with double energy
consumption during 2000–2020, which poses a high threat to sustainability
(Chen 2007).

1.1.3 Emissions embodied in exports


Figure 3- Partition of Chinese total domestic CO2 emissions (Weber et al. 2008)

In 2005, almost one third of Chinese emissions (1700Mt CO2) were due to
production of exports (Figure 3). This proportion has risen fast from 12%
(230Mt) in 1987 and 21% (760 Mt) in 2002 (Weber et al. 2008). It is therefore
likely that consumption in the developed world is driving the emissions
increasing trend (ibid.).

China’s economy is export-oriented, exports accounting for 45% of its GDP
(Helm 2008). Table 3 shows how, while imports from almost all regions
decreased in the period 1995-2000, imports from China increased heavily for all
importers (Ahmad 2003).

Table 3- Imports of manufactured goods by region, % of total (Ahmad 2003)


Figure 4- Major exporters of embodied emissions in exported goods, in Mt CO2 (Ward
2005)
Figure 4 reflects China’s position as the world’s largest exporter of emissions
embodied in goods.

Figure 5 shows that China was also the country that most increased their
exports of embodied emissions in the period 1990-2000.


Figure 5- Absolute increase of embodied emissions exports 1990-2000, by exporting and
importing countries, in MT CO2 (Ward 2005).

Industry sector is the highest energy consumer in China, accounting for 68% of
the total final energy consumption in 2000 (Chen 2007). Over 50% of the
energy consumption in the industry sector was from steel, cement, ammonia,
aluminium and paper industry (ibid.). Figure 6 shows how far the energy
intensity in the production of the most energy intensive in China goods
exceeded the world’s advanced international one.
Figure 6- Comparison of unit energy consumption for major energy intensive products
and equipments between China and world advanced level in 2000 (Jiankun et al. 2007)

Table 4 shows the emission factors of several industries and countries. China,
Russia, India and fast developing economies have the most carbon-intensive
production processes (Ahmad 2003), which supports the argument of ‘pollution
haven’ presented in the section ¡Error! No se encuentra el origen de la
referencia., discussing the market failure.

There is still a large technological potential to save energy in China, as it is at
the low end of the value chain in the international division of industrial structure
(Jiankun et al. 2007).
Table 4- Emission factors: embodied (direct + indirect) embodied CO2 emissions by US$ by industry- kg CO2 per US$ (Ahmad 2003)
1.1.4 Improvements

Nevertheless, China has achieved some significant improvements to its
environment during the recent years. According to the World Bank, China is one
of the few countries in the world that have been rapidly increasing their forest
cover. It is managing to reduce air and water pollution (Wassermann 2009). In
November 2008, Chinese Government introduced a US$498 billion economic
stimulus package (the largest in China's history) under which they plan to
improve the waste and rubbish treatment facilities, to prevent water pollution,
accelerate green zones and natural forest planting programs, and increase
energy conservation initiatives and pollution control projects (Chinaview 2008).
According to Jiankun et al (2007), energy conservation and energy structure
improvement are at the core of China’s development strategy; but population
expansion, economic growth, urbanization level improvement, and booming
transportation, will make China’s future energy consumption, as well as carbon
emissions, to increase unavoidably (Chen 2007).

Through energy efficiency improvement and substitution to low-carbon energy,
carbon intensity decreased dramatically from 2.75 kgC/US$ in 1980 to 0.92
kgC/US$ in 2003 with an annual decrease rate of 4.63% (Chen 2007) (Figure
7).


Figure 7- China’s carbon emission and carbon intensity during 1980–2003 (Chen 2007)
1.1.5 No ‘blame it on China’

This document does not intend to blame on China for an excess of emissions.
On the one side, as reflected in Table 5, historic contributions to climate change
from industrialised countries have been more than double the ones of
developing countries. And, even currently, they are higher.

Table 5- Contribution to global man-made CO2 emissions (%) (WDM 2007)


On the other, per capita carbon emissions are still low compared with the
world’s average, but they have increased by 3.14% per year in the period 1980-
2003, (Chen 2007). Since 1990 to 2008, CO2 emissions per person in China
increased from 2 to 5.5 tonnes, while they decreased in the EU-25 from 9 to 8.5
and from 19.5 to 18.5 in the USA (PBL 2009). These changes reflect the large
economic growth in China and structural changes in national and global
economies and the impacts of climate change policies (ibid.).

Further, highly polluting industries have been located in countries that are not
obliged by the Kyoto Protocol, therefore resulting in a reallocation of emissions
from developed countries to developing ones. According to the WDM (2007), in
the UK, for example, contribution of manufacturing to GDP declined from 22%
in 1995 to only 13% in 2006, while the total domestic material consumption
remained stable. If the net import of UK emissions was added to the emissions
produced in the UK in 2005, the emissions resulting from UK consumption
would rise by 37%, and there would not be a 15% emissions reduction over
1990, but a 2.7% excess. If also aviation and shipping were included, the
increase since 1990 would be 8%.

Therefore, a ‘blame it on China’ game should not be promoted through the
media when it has been rich nations who have historically caused the problem,
when unequal per capita emissions remain and when the riches’ way to reduce
emissions since Kyoto has been to move the production needed for their
consumption to China.

More Related Content

What's hot

Hydropower Dominated Energy Source---Socio-economic and Environmental Implica...
Hydropower Dominated Energy Source---Socio-economic and Environmental Implica...Hydropower Dominated Energy Source---Socio-economic and Environmental Implica...
Hydropower Dominated Energy Source---Socio-economic and Environmental Implica...Yohannes Mengesha, PhD Fellow
 
Development Economics: IMPACT OF GROWTH ON ENERGY REQUIREMENTS AND CARBON EMI...
Development Economics: IMPACT OF GROWTH ON ENERGY REQUIREMENTS AND CARBON EMI...Development Economics: IMPACT OF GROWTH ON ENERGY REQUIREMENTS AND CARBON EMI...
Development Economics: IMPACT OF GROWTH ON ENERGY REQUIREMENTS AND CARBON EMI...Deepmala Pokhriyal
 
Economy growth and oil import requirement in indonesia
Economy growth and oil import requirement in indonesiaEconomy growth and oil import requirement in indonesia
Economy growth and oil import requirement in indonesiaAlexander Decker
 
HZGD#18-A - Hangzhou's climate change politics, climate governance and green ...
HZGD#18-A - Hangzhou's climate change politics, climate governance and green ...HZGD#18-A - Hangzhou's climate change politics, climate governance and green ...
HZGD#18-A - Hangzhou's climate change politics, climate governance and green ...HangzhouGreenDrinks
 
Managing China's energy productivity potential - what lessons for policy makers
Managing China's energy productivity potential - what lessons for policy makersManaging China's energy productivity potential - what lessons for policy makers
Managing China's energy productivity potential - what lessons for policy makersNicholas Howarth
 
Traffic and Health
Traffic and HealthTraffic and Health
Traffic and HealthBill Pugsley
 
Global Warming and Political Economy
Global Warming and Political EconomyGlobal Warming and Political Economy
Global Warming and Political Economyiosrjce
 
An in depth analysis of the evolution of the policy mix for the sustainable e...
An in depth analysis of the evolution of the policy mix for the sustainable e...An in depth analysis of the evolution of the policy mix for the sustainable e...
An in depth analysis of the evolution of the policy mix for the sustainable e...Araz Taeihagh
 
Climate Change Past Future
Climate Change Past FutureClimate Change Past Future
Climate Change Past FutureJohnDone7
 
THE STRATEGIC PLANNING FOR RENEWABLE ENERGY SOURCES DEPLOYMENT IN THE CZECH R...
THE STRATEGIC PLANNING FOR RENEWABLE ENERGY SOURCES DEPLOYMENT IN THE CZECH R...THE STRATEGIC PLANNING FOR RENEWABLE ENERGY SOURCES DEPLOYMENT IN THE CZECH R...
THE STRATEGIC PLANNING FOR RENEWABLE ENERGY SOURCES DEPLOYMENT IN THE CZECH R...Riobras CZ s.r.o.
 
Green Government Initiatives: A Study of How Governments Define the Green Agenda
Green Government Initiatives: A Study of How Governments Define the Green AgendaGreen Government Initiatives: A Study of How Governments Define the Green Agenda
Green Government Initiatives: A Study of How Governments Define the Green AgendaIBM Government
 
Circular Economy Policy in Korea (Ick Jin)
Circular Economy Policy in Korea (Ick Jin)Circular Economy Policy in Korea (Ick Jin)
Circular Economy Policy in Korea (Ick Jin)Ick Jin
 
ENV GLOBAL FORUM OCT 2016 - Opening Session - Janez Potocnik
ENV GLOBAL FORUM OCT 2016 - Opening Session - Janez Potocnik ENV GLOBAL FORUM OCT 2016 - Opening Session - Janez Potocnik
ENV GLOBAL FORUM OCT 2016 - Opening Session - Janez Potocnik OECD Environment
 
Factors of permanent income and effects over consumption in pakistan (1973 2013)
Factors of permanent income and effects over consumption in pakistan (1973 2013)Factors of permanent income and effects over consumption in pakistan (1973 2013)
Factors of permanent income and effects over consumption in pakistan (1973 2013)Alexander Decker
 

What's hot (20)

Hydropower Dominated Energy Source---Socio-economic and Environmental Implica...
Hydropower Dominated Energy Source---Socio-economic and Environmental Implica...Hydropower Dominated Energy Source---Socio-economic and Environmental Implica...
Hydropower Dominated Energy Source---Socio-economic and Environmental Implica...
 
Development Economics: IMPACT OF GROWTH ON ENERGY REQUIREMENTS AND CARBON EMI...
Development Economics: IMPACT OF GROWTH ON ENERGY REQUIREMENTS AND CARBON EMI...Development Economics: IMPACT OF GROWTH ON ENERGY REQUIREMENTS AND CARBON EMI...
Development Economics: IMPACT OF GROWTH ON ENERGY REQUIREMENTS AND CARBON EMI...
 
Economy growth and oil import requirement in indonesia
Economy growth and oil import requirement in indonesiaEconomy growth and oil import requirement in indonesia
Economy growth and oil import requirement in indonesia
 
HZGD#18-A - Hangzhou's climate change politics, climate governance and green ...
HZGD#18-A - Hangzhou's climate change politics, climate governance and green ...HZGD#18-A - Hangzhou's climate change politics, climate governance and green ...
HZGD#18-A - Hangzhou's climate change politics, climate governance and green ...
 
USAEE PRESENTATION
USAEE PRESENTATIONUSAEE PRESENTATION
USAEE PRESENTATION
 
Managing China's energy productivity potential - what lessons for policy makers
Managing China's energy productivity potential - what lessons for policy makersManaging China's energy productivity potential - what lessons for policy makers
Managing China's energy productivity potential - what lessons for policy makers
 
Traffic and Health
Traffic and HealthTraffic and Health
Traffic and Health
 
Global Warming and Political Economy
Global Warming and Political EconomyGlobal Warming and Political Economy
Global Warming and Political Economy
 
Paper Economic and Environmental Basis - Carbon Neutral Growth - Jose Fernandes
Paper Economic and Environmental Basis - Carbon Neutral Growth - Jose FernandesPaper Economic and Environmental Basis - Carbon Neutral Growth - Jose Fernandes
Paper Economic and Environmental Basis - Carbon Neutral Growth - Jose Fernandes
 
HC_China_India
HC_China_IndiaHC_China_India
HC_China_India
 
An in depth analysis of the evolution of the policy mix for the sustainable e...
An in depth analysis of the evolution of the policy mix for the sustainable e...An in depth analysis of the evolution of the policy mix for the sustainable e...
An in depth analysis of the evolution of the policy mix for the sustainable e...
 
Climate Change Past Future
Climate Change Past FutureClimate Change Past Future
Climate Change Past Future
 
THE STRATEGIC PLANNING FOR RENEWABLE ENERGY SOURCES DEPLOYMENT IN THE CZECH R...
THE STRATEGIC PLANNING FOR RENEWABLE ENERGY SOURCES DEPLOYMENT IN THE CZECH R...THE STRATEGIC PLANNING FOR RENEWABLE ENERGY SOURCES DEPLOYMENT IN THE CZECH R...
THE STRATEGIC PLANNING FOR RENEWABLE ENERGY SOURCES DEPLOYMENT IN THE CZECH R...
 
Ymt china-ppt
Ymt china-pptYmt china-ppt
Ymt china-ppt
 
Green Government Initiatives: A Study of How Governments Define the Green Agenda
Green Government Initiatives: A Study of How Governments Define the Green AgendaGreen Government Initiatives: A Study of How Governments Define the Green Agenda
Green Government Initiatives: A Study of How Governments Define the Green Agenda
 
Circular Economy Policy in Korea (Ick Jin)
Circular Economy Policy in Korea (Ick Jin)Circular Economy Policy in Korea (Ick Jin)
Circular Economy Policy in Korea (Ick Jin)
 
AustraliaINDC
AustraliaINDCAustraliaINDC
AustraliaINDC
 
ENV GLOBAL FORUM OCT 2016 - Opening Session - Janez Potocnik
ENV GLOBAL FORUM OCT 2016 - Opening Session - Janez Potocnik ENV GLOBAL FORUM OCT 2016 - Opening Session - Janez Potocnik
ENV GLOBAL FORUM OCT 2016 - Opening Session - Janez Potocnik
 
Factors of permanent income and effects over consumption in pakistan (1973 2013)
Factors of permanent income and effects over consumption in pakistan (1973 2013)Factors of permanent income and effects over consumption in pakistan (1973 2013)
Factors of permanent income and effects over consumption in pakistan (1973 2013)
 
CAR Email 6.5.02 (b)
CAR Email 6.5.02 (b)CAR Email 6.5.02 (b)
CAR Email 6.5.02 (b)
 

Viewers also liked

Annex to doc 'Sales of Spanish green certificates in the EU'
Annex to doc 'Sales of Spanish green certificates in the EU'Annex to doc 'Sales of Spanish green certificates in the EU'
Annex to doc 'Sales of Spanish green certificates in the EU'Alejo Etchart Ortiz
 
Sales of Spanish green certificates in the EU
Sales of Spanish green certificates in the EUSales of Spanish green certificates in the EU
Sales of Spanish green certificates in the EUAlejo Etchart Ortiz
 
Critical Appraisal To Spanish SD Strategy
Critical Appraisal To Spanish SD StrategyCritical Appraisal To Spanish SD Strategy
Critical Appraisal To Spanish SD StrategyAlejo Etchart Ortiz
 
Open group spc rosenthal v3
Open group   spc rosenthal v3Open group   spc rosenthal v3
Open group spc rosenthal v3City of Toronto
 
Cooperatives, communities and social businesses towards a systemic proposal.
Cooperatives, communities and social businesses  towards a systemic proposal.Cooperatives, communities and social businesses  towards a systemic proposal.
Cooperatives, communities and social businesses towards a systemic proposal.Alejo Etchart Ortiz
 
Catalogue de nos formation auprès des elus janvier 2013
Catalogue de nos formation auprès des elus  janvier 2013Catalogue de nos formation auprès des elus  janvier 2013
Catalogue de nos formation auprès des elus janvier 2013Julien Voyez
 

Viewers also liked (8)

Power Point Diseño
Power Point DiseñoPower Point Diseño
Power Point Diseño
 
Annex to doc 'Sales of Spanish green certificates in the EU'
Annex to doc 'Sales of Spanish green certificates in the EU'Annex to doc 'Sales of Spanish green certificates in the EU'
Annex to doc 'Sales of Spanish green certificates in the EU'
 
Sales of Spanish green certificates in the EU
Sales of Spanish green certificates in the EUSales of Spanish green certificates in the EU
Sales of Spanish green certificates in the EU
 
Critical Appraisal To Spanish SD Strategy
Critical Appraisal To Spanish SD StrategyCritical Appraisal To Spanish SD Strategy
Critical Appraisal To Spanish SD Strategy
 
Open group spc rosenthal v3
Open group   spc rosenthal v3Open group   spc rosenthal v3
Open group spc rosenthal v3
 
Cooperatives, communities and social businesses towards a systemic proposal.
Cooperatives, communities and social businesses  towards a systemic proposal.Cooperatives, communities and social businesses  towards a systemic proposal.
Cooperatives, communities and social businesses towards a systemic proposal.
 
EKC Analysis For Resource Use
EKC Analysis For Resource UseEKC Analysis For Resource Use
EKC Analysis For Resource Use
 
Catalogue de nos formation auprès des elus janvier 2013
Catalogue de nos formation auprès des elus  janvier 2013Catalogue de nos formation auprès des elus  janvier 2013
Catalogue de nos formation auprès des elus janvier 2013
 

Similar to China's role as GHG emitter

Wdr2010 Graphics Ch0 Overview[1]
Wdr2010 Graphics Ch0 Overview[1]Wdr2010 Graphics Ch0 Overview[1]
Wdr2010 Graphics Ch0 Overview[1]wringobanker
 
Running Head ANNOTATED OUTLINE .docx
Running Head ANNOTATED OUTLINE                                   .docxRunning Head ANNOTATED OUTLINE                                   .docx
Running Head ANNOTATED OUTLINE .docxhealdkathaleen
 
Low Carbon China - Innovation Beyond Efficiency
Low Carbon China - Innovation Beyond EfficiencyLow Carbon China - Innovation Beyond Efficiency
Low Carbon China - Innovation Beyond Efficiencypolicysolutions
 
Economy, intl trade & environment
Economy, intl trade & environmentEconomy, intl trade & environment
Economy, intl trade & environmentAlejo Etchart Ortiz
 
2019- World Scientists’ Warning of a Climate Emergency
2019- World Scientists’ Warning of a Climate Emergency2019- World Scientists’ Warning of a Climate Emergency
2019- World Scientists’ Warning of a Climate EmergencyEnergy for One World
 
Review on Sustainable Energy Potential
Review on Sustainable Energy PotentialReview on Sustainable Energy Potential
Review on Sustainable Energy Potentialiosrjce
 
Shobhakar Dhakal's April 30 Presenation
Shobhakar Dhakal's April 30 PresenationShobhakar Dhakal's April 30 Presenation
Shobhakar Dhakal's April 30 PresenationChinaenviro
 
Clean Energy and the Economy
Clean Energy and the EconomyClean Energy and the Economy
Clean Energy and the EconomyDevon Wright
 
Business Article Rough Draft
Business Article Rough DraftBusiness Article Rough Draft
Business Article Rough DraftDevon Wright
 
Government policy, corporate social responsibility and corporate innovation e...
Government policy, corporate social responsibility and corporate innovation e...Government policy, corporate social responsibility and corporate innovation e...
Government policy, corporate social responsibility and corporate innovation e...Alexander Decker
 
China’s Development Model Consequences for the Environme
China’s Development Model Consequences for the EnvironmeChina’s Development Model Consequences for the Environme
China’s Development Model Consequences for the EnvironmeJinElias52
 
Energy power shift 09_2016
Energy power shift 09_2016 Energy power shift 09_2016
Energy power shift 09_2016 Vasilis Rallis
 
Timea Grego_Env Econ Term Paper 1st Draft
Timea Grego_Env Econ Term Paper 1st DraftTimea Grego_Env Econ Term Paper 1st Draft
Timea Grego_Env Econ Term Paper 1st DraftTimea Grego
 
Final Energy Essay
Final Energy EssayFinal Energy Essay
Final Energy EssayAmie Nevin
 
Industrial and terrestrial carbon leakage under climate policy fragmentation
Industrial and terrestrial carbon leakage under climate policy fragmentationIndustrial and terrestrial carbon leakage under climate policy fragmentation
Industrial and terrestrial carbon leakage under climate policy fragmentationBC3 - Basque Center for Climate Change
 

Similar to China's role as GHG emitter (20)

Wdr2010 Graphics Ch0 Overview[1]
Wdr2010 Graphics Ch0 Overview[1]Wdr2010 Graphics Ch0 Overview[1]
Wdr2010 Graphics Ch0 Overview[1]
 
Chertow Lecture #2
Chertow Lecture #2Chertow Lecture #2
Chertow Lecture #2
 
Running Head ANNOTATED OUTLINE .docx
Running Head ANNOTATED OUTLINE                                   .docxRunning Head ANNOTATED OUTLINE                                   .docx
Running Head ANNOTATED OUTLINE .docx
 
Low Carbon China - Innovation Beyond Efficiency
Low Carbon China - Innovation Beyond EfficiencyLow Carbon China - Innovation Beyond Efficiency
Low Carbon China - Innovation Beyond Efficiency
 
Economy, intl trade & environment
Economy, intl trade & environmentEconomy, intl trade & environment
Economy, intl trade & environment
 
2019- World Scientists’ Warning of a Climate Emergency
2019- World Scientists’ Warning of a Climate Emergency2019- World Scientists’ Warning of a Climate Emergency
2019- World Scientists’ Warning of a Climate Emergency
 
Stern Review Executive Summary
Stern Review   Executive SummaryStern Review   Executive Summary
Stern Review Executive Summary
 
Review on Sustainable Energy Potential
Review on Sustainable Energy PotentialReview on Sustainable Energy Potential
Review on Sustainable Energy Potential
 
A012220109
A012220109A012220109
A012220109
 
Shobhakar Dhakal's April 30 Presenation
Shobhakar Dhakal's April 30 PresenationShobhakar Dhakal's April 30 Presenation
Shobhakar Dhakal's April 30 Presenation
 
Bcfr April 20 2010
Bcfr April 20 2010Bcfr April 20 2010
Bcfr April 20 2010
 
Clean Energy and the Economy
Clean Energy and the EconomyClean Energy and the Economy
Clean Energy and the Economy
 
Business Article Rough Draft
Business Article Rough DraftBusiness Article Rough Draft
Business Article Rough Draft
 
Renewable Energy Essay
Renewable Energy EssayRenewable Energy Essay
Renewable Energy Essay
 
Government policy, corporate social responsibility and corporate innovation e...
Government policy, corporate social responsibility and corporate innovation e...Government policy, corporate social responsibility and corporate innovation e...
Government policy, corporate social responsibility and corporate innovation e...
 
China’s Development Model Consequences for the Environme
China’s Development Model Consequences for the EnvironmeChina’s Development Model Consequences for the Environme
China’s Development Model Consequences for the Environme
 
Energy power shift 09_2016
Energy power shift 09_2016 Energy power shift 09_2016
Energy power shift 09_2016
 
Timea Grego_Env Econ Term Paper 1st Draft
Timea Grego_Env Econ Term Paper 1st DraftTimea Grego_Env Econ Term Paper 1st Draft
Timea Grego_Env Econ Term Paper 1st Draft
 
Final Energy Essay
Final Energy EssayFinal Energy Essay
Final Energy Essay
 
Industrial and terrestrial carbon leakage under climate policy fragmentation
Industrial and terrestrial carbon leakage under climate policy fragmentationIndustrial and terrestrial carbon leakage under climate policy fragmentation
Industrial and terrestrial carbon leakage under climate policy fragmentation
 

More from Alejo Etchart Ortiz

Presentación Movimiento de Transición en Mungia 121120
Presentación Movimiento de Transición en Mungia 121120Presentación Movimiento de Transición en Mungia 121120
Presentación Movimiento de Transición en Mungia 121120Alejo Etchart Ortiz
 
Eficiencia energética y certificados blancos
Eficiencia energética y certificados blancosEficiencia energética y certificados blancos
Eficiencia energética y certificados blancosAlejo Etchart Ortiz
 
Conferencia bionatur abril2010 gobernabilidad
Conferencia bionatur abril2010  gobernabilidadConferencia bionatur abril2010  gobernabilidad
Conferencia bionatur abril2010 gobernabilidadAlejo Etchart Ortiz
 
EL AGUA EN EL DEBATE SOBRE EL CAMBIO CLIMÁTICO: LA IMPORTANCIA DEL AGUA EN LA...
EL AGUA EN EL DEBATE SOBRE EL CAMBIO CLIMÁTICO: LA IMPORTANCIA DEL AGUA EN LA...EL AGUA EN EL DEBATE SOBRE EL CAMBIO CLIMÁTICO: LA IMPORTANCIA DEL AGUA EN LA...
EL AGUA EN EL DEBATE SOBRE EL CAMBIO CLIMÁTICO: LA IMPORTANCIA DEL AGUA EN LA...Alejo Etchart Ortiz
 
Improving Packaging Waste Treatment In UK
Improving Packaging Waste Treatment In UKImproving Packaging Waste Treatment In UK
Improving Packaging Waste Treatment In UKAlejo Etchart Ortiz
 
Renewable Energies In Practice- Ashton Green And London
Renewable Energies In Practice- Ashton Green And LondonRenewable Energies In Practice- Ashton Green And London
Renewable Energies In Practice- Ashton Green And LondonAlejo Etchart Ortiz
 
Renewable energies- history and drivers.
Renewable energies- history and drivers.Renewable energies- history and drivers.
Renewable energies- history and drivers.Alejo Etchart Ortiz
 
Communities And Renewable Energy in UK
Communities And Renewable Energy in UKCommunities And Renewable Energy in UK
Communities And Renewable Energy in UKAlejo Etchart Ortiz
 
Influences On Environmental Significant Behaviours
Influences On Environmental Significant BehavioursInfluences On Environmental Significant Behaviours
Influences On Environmental Significant BehavioursAlejo Etchart Ortiz
 
MItigation Strategy Sample- Spanish Basque Country
MItigation Strategy Sample- Spanish Basque CountryMItigation Strategy Sample- Spanish Basque Country
MItigation Strategy Sample- Spanish Basque CountryAlejo Etchart Ortiz
 

More from Alejo Etchart Ortiz (13)

Presentación Movimiento de Transición en Mungia 121120
Presentación Movimiento de Transición en Mungia 121120Presentación Movimiento de Transición en Mungia 121120
Presentación Movimiento de Transición en Mungia 121120
 
Eficiencia energética y certificados blancos
Eficiencia energética y certificados blancosEficiencia energética y certificados blancos
Eficiencia energética y certificados blancos
 
Estudio Vehículos Eléctricos
Estudio Vehículos Eléctricos Estudio Vehículos Eléctricos
Estudio Vehículos Eléctricos
 
Conferencia bionatur abril2010 gobernabilidad
Conferencia bionatur abril2010  gobernabilidadConferencia bionatur abril2010  gobernabilidad
Conferencia bionatur abril2010 gobernabilidad
 
EL AGUA EN EL DEBATE SOBRE EL CAMBIO CLIMÁTICO: LA IMPORTANCIA DEL AGUA EN LA...
EL AGUA EN EL DEBATE SOBRE EL CAMBIO CLIMÁTICO: LA IMPORTANCIA DEL AGUA EN LA...EL AGUA EN EL DEBATE SOBRE EL CAMBIO CLIMÁTICO: LA IMPORTANCIA DEL AGUA EN LA...
EL AGUA EN EL DEBATE SOBRE EL CAMBIO CLIMÁTICO: LA IMPORTANCIA DEL AGUA EN LA...
 
Sustainable Development concept
Sustainable Development conceptSustainable Development concept
Sustainable Development concept
 
Improving Packaging Waste Treatment In UK
Improving Packaging Waste Treatment In UKImproving Packaging Waste Treatment In UK
Improving Packaging Waste Treatment In UK
 
Renewable Energies In Practice- Ashton Green And London
Renewable Energies In Practice- Ashton Green And LondonRenewable Energies In Practice- Ashton Green And London
Renewable Energies In Practice- Ashton Green And London
 
Renewable energies- history and drivers.
Renewable energies- history and drivers.Renewable energies- history and drivers.
Renewable energies- history and drivers.
 
Communities And Renewable Energy in UK
Communities And Renewable Energy in UKCommunities And Renewable Energy in UK
Communities And Renewable Energy in UK
 
Influences On Environmental Significant Behaviours
Influences On Environmental Significant BehavioursInfluences On Environmental Significant Behaviours
Influences On Environmental Significant Behaviours
 
CHP plant for a leisure centre
CHP plant for a leisure centreCHP plant for a leisure centre
CHP plant for a leisure centre
 
MItigation Strategy Sample- Spanish Basque Country
MItigation Strategy Sample- Spanish Basque CountryMItigation Strategy Sample- Spanish Basque Country
MItigation Strategy Sample- Spanish Basque Country
 

Recently uploaded

Rohan Jaitley: Central Gov't Standing Counsel for Justice
Rohan Jaitley: Central Gov't Standing Counsel for JusticeRohan Jaitley: Central Gov't Standing Counsel for Justice
Rohan Jaitley: Central Gov't Standing Counsel for JusticeAbdulGhani778830
 
IndiaWest: Your Trusted Source for Today's Global News
IndiaWest: Your Trusted Source for Today's Global NewsIndiaWest: Your Trusted Source for Today's Global News
IndiaWest: Your Trusted Source for Today's Global NewsIndiaWest2
 
16042024_First India Newspaper Jaipur.pdf
16042024_First India Newspaper Jaipur.pdf16042024_First India Newspaper Jaipur.pdf
16042024_First India Newspaper Jaipur.pdfFIRST INDIA
 
Global Terrorism and its types and prevention ppt.
Global Terrorism and its types and prevention ppt.Global Terrorism and its types and prevention ppt.
Global Terrorism and its types and prevention ppt.NaveedKhaskheli1
 
Geostrategic significance of South Asian countries.ppt
Geostrategic significance of South Asian countries.pptGeostrategic significance of South Asian countries.ppt
Geostrategic significance of South Asian countries.pptUsmanKaran
 
15042024_First India Newspaper Jaipur.pdf
15042024_First India Newspaper Jaipur.pdf15042024_First India Newspaper Jaipur.pdf
15042024_First India Newspaper Jaipur.pdfFIRST INDIA
 
57 Bidens Annihilation Nation Policy.pdf
57 Bidens Annihilation Nation Policy.pdf57 Bidens Annihilation Nation Policy.pdf
57 Bidens Annihilation Nation Policy.pdfGerald Furnkranz
 
Political-Ideologies-and-The-Movements.pptx
Political-Ideologies-and-The-Movements.pptxPolitical-Ideologies-and-The-Movements.pptx
Political-Ideologies-and-The-Movements.pptxSasikiranMarri
 
Foreign Relation of Pakistan with Neighboring Countries.pptx
Foreign Relation of Pakistan with Neighboring Countries.pptxForeign Relation of Pakistan with Neighboring Countries.pptx
Foreign Relation of Pakistan with Neighboring Countries.pptxunark75
 

Recently uploaded (9)

Rohan Jaitley: Central Gov't Standing Counsel for Justice
Rohan Jaitley: Central Gov't Standing Counsel for JusticeRohan Jaitley: Central Gov't Standing Counsel for Justice
Rohan Jaitley: Central Gov't Standing Counsel for Justice
 
IndiaWest: Your Trusted Source for Today's Global News
IndiaWest: Your Trusted Source for Today's Global NewsIndiaWest: Your Trusted Source for Today's Global News
IndiaWest: Your Trusted Source for Today's Global News
 
16042024_First India Newspaper Jaipur.pdf
16042024_First India Newspaper Jaipur.pdf16042024_First India Newspaper Jaipur.pdf
16042024_First India Newspaper Jaipur.pdf
 
Global Terrorism and its types and prevention ppt.
Global Terrorism and its types and prevention ppt.Global Terrorism and its types and prevention ppt.
Global Terrorism and its types and prevention ppt.
 
Geostrategic significance of South Asian countries.ppt
Geostrategic significance of South Asian countries.pptGeostrategic significance of South Asian countries.ppt
Geostrategic significance of South Asian countries.ppt
 
15042024_First India Newspaper Jaipur.pdf
15042024_First India Newspaper Jaipur.pdf15042024_First India Newspaper Jaipur.pdf
15042024_First India Newspaper Jaipur.pdf
 
57 Bidens Annihilation Nation Policy.pdf
57 Bidens Annihilation Nation Policy.pdf57 Bidens Annihilation Nation Policy.pdf
57 Bidens Annihilation Nation Policy.pdf
 
Political-Ideologies-and-The-Movements.pptx
Political-Ideologies-and-The-Movements.pptxPolitical-Ideologies-and-The-Movements.pptx
Political-Ideologies-and-The-Movements.pptx
 
Foreign Relation of Pakistan with Neighboring Countries.pptx
Foreign Relation of Pakistan with Neighboring Countries.pptxForeign Relation of Pakistan with Neighboring Countries.pptx
Foreign Relation of Pakistan with Neighboring Countries.pptx
 

China's role as GHG emitter

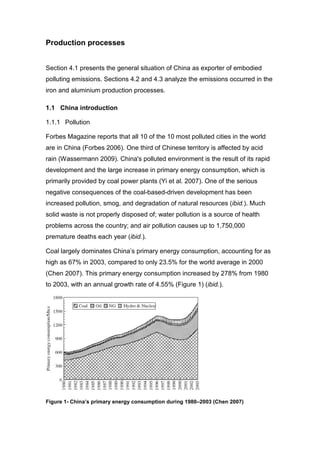
  • 1. Production processes Section 4.1 presents the general situation of China as exporter of embodied polluting emissions. Sections 4.2 and 4.3 analyze the emissions occurred in the iron and aluminium production processes. 1.1 China introduction 1.1.1 Pollution Forbes Magazine reports that all 10 of the 10 most polluted cities in the world are in China (Forbes 2006). One third of Chinese territory is affected by acid rain (Wassermann 2009). China's polluted environment is the result of its rapid development and the large increase in primary energy consumption, which is primarily provided by coal power plants (Yi et al. 2007). One of the serious negative consequences of the coal-based-driven development has been increased pollution, smog, and degradation of natural resources (ibid.). Much solid waste is not properly disposed of; water pollution is a source of health problems across the country; and air pollution causes up to 1,750,000 premature deaths each year (ibid.). Coal largely dominates China’s primary energy consumption, accounting for as high as 67% in 2003, compared to only 23.5% for the world average in 2000 (Chen 2007). This primary energy consumption increased by 278% from 1980 to 2003, with an annual growth rate of 4.55% (Figure 1) (ibid.). Figure 1- China’s primary energy consumption during 1980–2003 (Chen 2007)
  • 2. Chinese industry consumes mostly coal and electricity, which is also produced mainly by coal-fired power plants in China (Yanjia and Chandler 2009). Oil and natural gas make up only 5% of the total energy consumption (ibid.). Coal covers about 65% of primary energy production (Table 1), over 60% of the total internal energy demand, 80% of the fuel used by thermal power plants to generate electricity, and 40% of the final fuel used by final consumption sectors (Palazuelos and Garcia 2008). The high share of coal, as well as some inefficiencies in processes, which are getting reduced through technological improvements, are the reasons why China-made products have relatively high carbon content (Sinton et al. 2005; Xu 2002; Palazuelos and Garcia 2008). The shift to cleaner energy is a challenge that China must tackle in the coming years (BECon 2004; Crompton and Wu 2005; Lin 2005; Levine 2006; Jiang 2007). Table 1- Total production and offer of primary energy. Elaborated with data from IEA (2006a). (1): Oil-equivalent tones. China has recently overtaken the USA as the world largest emitter of CO2 (Wassermann 2009). Within 5 years, China’s CO2 emissions have nearly doubled (Weber et al. 2008). Templet (2001) reflects that subsidized energy prices in countries like China leads to inefficient allocation, higher pollution and efficiency loss by the economy. 1.1.2 Economic growth For more than 25 years until 2007, China’s GDP growth has exceeded 10% annually, more than double that of low and middle income economies and well over three times the figure posted by high-income nations (Table 2) (Bustelo 2007).
  • 3. Table 2- Comparison of average annual GDP growths (%) (Source: World Bank) (Bustelo 2007) China’s share on world GDP rose from 3.4% in 1980 to 15.4% in 2005, while the US's share remained steady at around 21% and the joint share of the countries that make up the EU today fell from 29% to 21% (Figure 2) (ibid.). Figure 2- Weight in world gross product 1980-2006 (Source: IMF) (Bustelo 2007) China’s competitive advantages are notably cheap land and cheap labor (Helm 2008). Bustelo (2007) adds other significant strengths, such as a high savings rate, a Confucian work ethic, a rising middle class that could reach 150 million people by 2010, and a substantial degree of integration in the world economy.
  • 4. He also refers some disadvantages, notably the inefficiency of the banking sector, sharp inequality in regional and personal income distribution, corruption, aging population, over-industrialization, excessive dependence on foreign capital and growing energy dependence. Banister (2005) estimated that China’s labor total compensation by 2002, when data were first published, accounted for about 3% of the average hourly compensation in the USA and other developed countries, 10% of the one in their regional competitors and 25% of the one in other emerging economies like Mexico and Brazil. Ceglowski and Golub’s (2007) estimations are compatible with Banister’s: by 2004, the percentage against USA or Western European countries was between 3% and 7%. Nevertheless, when the productivity level is considered, they conclude that, by 2002, the relative unit labor cost in China was around 25% the average in the EU and between 27 and 43% the one in the USA (ibid.). Chinese government plans a fourfold economy development with double energy consumption during 2000–2020, which poses a high threat to sustainability (Chen 2007). 1.1.3 Emissions embodied in exports Figure 3- Partition of Chinese total domestic CO2 emissions (Weber et al. 2008) In 2005, almost one third of Chinese emissions (1700Mt CO2) were due to production of exports (Figure 3). This proportion has risen fast from 12% (230Mt) in 1987 and 21% (760 Mt) in 2002 (Weber et al. 2008). It is therefore
  • 5. likely that consumption in the developed world is driving the emissions increasing trend (ibid.). China’s economy is export-oriented, exports accounting for 45% of its GDP (Helm 2008). Table 3 shows how, while imports from almost all regions decreased in the period 1995-2000, imports from China increased heavily for all importers (Ahmad 2003). Table 3- Imports of manufactured goods by region, % of total (Ahmad 2003) Figure 4- Major exporters of embodied emissions in exported goods, in Mt CO2 (Ward 2005)
  • 6. Figure 4 reflects China’s position as the world’s largest exporter of emissions embodied in goods. Figure 5 shows that China was also the country that most increased their exports of embodied emissions in the period 1990-2000. Figure 5- Absolute increase of embodied emissions exports 1990-2000, by exporting and importing countries, in MT CO2 (Ward 2005). Industry sector is the highest energy consumer in China, accounting for 68% of the total final energy consumption in 2000 (Chen 2007). Over 50% of the energy consumption in the industry sector was from steel, cement, ammonia, aluminium and paper industry (ibid.). Figure 6 shows how far the energy intensity in the production of the most energy intensive in China goods exceeded the world’s advanced international one.
  • 7. Figure 6- Comparison of unit energy consumption for major energy intensive products and equipments between China and world advanced level in 2000 (Jiankun et al. 2007) Table 4 shows the emission factors of several industries and countries. China, Russia, India and fast developing economies have the most carbon-intensive production processes (Ahmad 2003), which supports the argument of ‘pollution haven’ presented in the section ¡Error! No se encuentra el origen de la referencia., discussing the market failure. There is still a large technological potential to save energy in China, as it is at the low end of the value chain in the international division of industrial structure (Jiankun et al. 2007).
  • 8. Table 4- Emission factors: embodied (direct + indirect) embodied CO2 emissions by US$ by industry- kg CO2 per US$ (Ahmad 2003)
  • 9. 1.1.4 Improvements Nevertheless, China has achieved some significant improvements to its environment during the recent years. According to the World Bank, China is one of the few countries in the world that have been rapidly increasing their forest cover. It is managing to reduce air and water pollution (Wassermann 2009). In November 2008, Chinese Government introduced a US$498 billion economic stimulus package (the largest in China's history) under which they plan to improve the waste and rubbish treatment facilities, to prevent water pollution, accelerate green zones and natural forest planting programs, and increase energy conservation initiatives and pollution control projects (Chinaview 2008). According to Jiankun et al (2007), energy conservation and energy structure improvement are at the core of China’s development strategy; but population expansion, economic growth, urbanization level improvement, and booming transportation, will make China’s future energy consumption, as well as carbon emissions, to increase unavoidably (Chen 2007). Through energy efficiency improvement and substitution to low-carbon energy, carbon intensity decreased dramatically from 2.75 kgC/US$ in 1980 to 0.92 kgC/US$ in 2003 with an annual decrease rate of 4.63% (Chen 2007) (Figure 7). Figure 7- China’s carbon emission and carbon intensity during 1980–2003 (Chen 2007)
  • 10. 1.1.5 No ‘blame it on China’ This document does not intend to blame on China for an excess of emissions. On the one side, as reflected in Table 5, historic contributions to climate change from industrialised countries have been more than double the ones of developing countries. And, even currently, they are higher. Table 5- Contribution to global man-made CO2 emissions (%) (WDM 2007) On the other, per capita carbon emissions are still low compared with the world’s average, but they have increased by 3.14% per year in the period 1980- 2003, (Chen 2007). Since 1990 to 2008, CO2 emissions per person in China increased from 2 to 5.5 tonnes, while they decreased in the EU-25 from 9 to 8.5 and from 19.5 to 18.5 in the USA (PBL 2009). These changes reflect the large economic growth in China and structural changes in national and global economies and the impacts of climate change policies (ibid.). Further, highly polluting industries have been located in countries that are not obliged by the Kyoto Protocol, therefore resulting in a reallocation of emissions from developed countries to developing ones. According to the WDM (2007), in the UK, for example, contribution of manufacturing to GDP declined from 22% in 1995 to only 13% in 2006, while the total domestic material consumption remained stable. If the net import of UK emissions was added to the emissions produced in the UK in 2005, the emissions resulting from UK consumption
  • 11. would rise by 37%, and there would not be a 15% emissions reduction over 1990, but a 2.7% excess. If also aviation and shipping were included, the increase since 1990 would be 8%. Therefore, a ‘blame it on China’ game should not be promoted through the media when it has been rich nations who have historically caused the problem, when unequal per capita emissions remain and when the riches’ way to reduce emissions since Kyoto has been to move the production needed for their consumption to China.