5 joseph injodey final paper
•
1 recomendación•308 vistas

The International Institute for Science, Technology and Education (IISTE) , International Journals Call for papaers: http://www.iiste.org/Journals

Recomendados
Recomendados
Más contenido relacionado
Similar a 5 joseph injodey final paper
Similar a 5 joseph injodey final paper (20)
Más de Alexander Decker
Más de Alexander Decker (20)
Último
Último (20)
5 joseph injodey final paper
- 1. Research Journal of Finance and Accounting www.iiste.org ISSN 2222-1697 (Paper) ISSN 2222-2847 (Online) Vol 2, No 2, 2011 Risk Tolerance of Investors: Developing a Psychometric Tool Joseph. I. Injodey (Corresponding author) Department of Social Work, Rajagiri College of Social Sciences Rajagiri P.O., Kochi - 683 104. India. Tel: +919349 262687 E-mail:jinjodey@gmail.com Dhanya Alex Rajagiri Business School, Rajagiri Centre for Business Studies Rajagiri Valley P.O., Kochi – 682 039. India Tel: + 9197451 87766 E-mail:dhanyaalex007@gmail.com Abstract Assessing client risk tolerance is one of the most important activities for financial planners. Although risk tolerance evaluation is a key input in the formulation of individualized portfolios, academics and practitioners have not yet paid much attention to this variable. In the absence of a standard method, various techniques have been used by investment advisors to measure the risk tolerance. Developing a reliable psychometric tool would immensely help academics and financial planners in further studying the complex investor behavior. This study is an attempt to develop a reliable instrument for assessing the financial risk tolerance of investors. This research is motivated by the documented evidence from the literature that assessment of financial risk tolerance is critical to optimal allocation of scarce capital resources. The study is interdisciplinary in nature involving the basic constructs of psychology. Keywords: Risk Tolerance, Investors, Market, Portfolio. 1.Introduction Assessing client risk tolerance is one of the most important activities for financial planners. Identification and understanding of the degree of investment volatility an investor prefers is necessary when recommending investment allocation strategies. In fact, determining investment suitability depends heavily on the ability to assess risk tolerance. Although risk tolerance evaluation is a key input in the formulation of individualized portfolios, academics and practitioners have not yet paid much attention to this variable. According to Grable (1999); Cordell (2001); and Yang (2004) there are few, if any, generally recognized measures or instruments designed to ascertain someone’s financial risk tolerance or preference. Few papers have appeared in either practitioner oriented publications or academic journals. As Yook and Everett (2000) note, lack of understanding about the determinants of risk aversion may be the primary reason for this deficiency. In the absence of a standard method, various techniques have been used by investment advisors to measure the risk tolerance. As cited by Yook and Everett (2000), investment counselors identify clients’ risk perceptions through counseling and classify them as one of several types of investors based on their personality traits. Counselors identify a suitable investment policy and account handling based on the classification. However, these judgments often fail to adequately explain or predict actual investor behavior (Cordell, 2001). Unfortunately, most of these measurement devices are poorly and unscientifically designed. Recently academics have attempted to develop tools for measuring investor risk taking behavior. Most researchers used self – report questionnaires to measure consumers’ risk preferences, and the others used asset allocation as the indicator of consumers’ risk preferences. However, few researchers investigated the reliability and validity of these instruments. (Yang 2004). Developing a reliable psychometric tool would be immensely help academics and financial planners in further studying the complex investor behavior. This research is an attempt to develop a reliable and valid instrument for assessing the financial risk tolerance of investors.
- 2. Research Journal of Finance and Accounting www.iiste.org ISSN 2222-1697 (Paper) ISSN 2222-2847 (Online) Vol 2, No 2, 2011 This research is motivated by the documented evidence from the literature that assessment of financial risk tolerance is critical to optimal allocation of scarce capital resources. Also we could find hardly few scientifically developed instruments for assessing the risk tolerance, though the financial institutions are using such instruments to classify the investors. The study is essentially interdisciplinary in nature involving the basic constructs of psychology and scientific psychological approach in developing robust instruments. At the same, the study combines with it the concepts of financial markets, investments and risk – return optimization. It tries to transplant the scientific developments in psychology into the field of financial markets. So this study essentially calls for collaborative academic work between the economics / finance faculty and behavioral sciences faculty. 2. Review of research and development in the subject The past attempts for studying the investor behavior have been anchored around five methodologies; choice dilemmas, utility theory, objective measures, heuristic judgments, and subjective assessment (Grable and Lytton, 1999). Choice dilemmas were a popular method of risk assessment until the mid 1970s. Basically, choice dilemmas are scenarios where respondents are asked to make a choice for themselves or someone else regarding an everyday life event. After years of use, these tests were found to generate little evidence of general risk taking propensity across situations because the items were one dimensional (Grable and Lytton, 1999) Utility theory continues to be popular method of assessing financial risk tolerance; however, recent research challenges the standard utility function assumption by showing that most people do not have a constant risk aversion throughout the entire domain of wealth (Grable and Lytton, 1999). Objective risk tolerance measures require researchers to deduce someone’s risk tolerance via their asset holdings may also pose serious validity problems. Objective measures assume that investors act in a rational way and that a person’s asset allocation is a result of personal choice rather than the advice of a third party. As a result, objective measures, (1) tend to be descriptive rather than predictive (2) do not account for the multidimensional nature of risk, and (3) often fail to explain actual investor behavior (Grable and Lytton, 1999). Lacking a standard method, various techniques have been used to measure risk tolerance in practice. For example, one technique is the use of several psychographic classification schemes. As cited by Yook and Everett (2000), investment counselors identify clients’ risk perceptions through counseling and classify them as one of the several types of investors based on their personality traits. Counselors identify a suitable investment policy and account handling based on the classification. Recently, Cordell (2001, 2002) proposed a framework named RiskPACK, which separates risk tolerance into four components: propensity, attitude, capacity and knowledge. It has been argued that the best way to concisely and accurately identify a person’s financial risk tolerance is to use an assessment instrument designed specifically to measure subjective risk tolerance using multidimensional financial scenarios and situations (Grable and Lytton, 1999). Unfortunately, there are few widely accepted and commonly used measures or instruments designed to ascertain someone’s financial risk tolerance. Literature recommends the use of a questionnaire type instrument over other types of measures or experiments as a questionnaire does not subject the risk tolerance of a respondent to the influences of the decision analyst during the assessment process. Questionnaires also were recommended because they allow large numbers of subjects to participate in assessments, thus eliminating response biases that can arise when multiple analysts are used to assess tolerances on an interactive basis (Grable and Lytton, 1999). It is suggested that instead of relying on a single item surveys and experiments, include situation items where respondents are asked to make financial decisions concerning lotteries, stocks, bonds, mutual funds, real estate, options, commodities, and other types of investments. Also in the line of the findings of Cordell (2001, 2002), the researcher believes that the risk tolerance also depends on risk attitude, risk capacity and risk knowledge. The researcher has assumed that risk propensity, which is a manifestation of the risk attitude of the individual is already captured in the risk attitude. In summary, the researcher concluded that questionnaire method is a suitable way of assessing the risk tolerance of investors. The risk taking capacity of an individual has three dimensions, risk attitude, risk awareness, and risk capacity. Investors who comprehend risk are more likely to make informed financial planning decisions consistent with accomplishment of their goals. For example, clients who understand the nature of stock market risk are more likely to seek or accept asset allocations consistent with their risk capacity and risk attitude. There is no documented body of literature available about research in the area of investor behavior in India. However, the researcher has understood that a number of foreign broking firms which are operating in India are using investor profile questionnaires to figure out the investor characteristics. 3. Significance of the study
- 3. Research Journal of Finance and Accounting www.iiste.org ISSN 2222-1697 (Paper) ISSN 2222-2847 (Online) Vol 2, No 2, 2011 The optimal allocation of scarce capital resources in an economy is crucial to its growth. The financial markets serve as an efficient mechanism in such allocation and any anomalies and inefficiencies in the markets are reflected particularly in the growth of capital intensive industries. The primary source of such capital, the saving community depends on the financial intermediaries for investment in suitable securities by seeking their advice, whether it is a bank, mutual fund or an insurance firm. Understanding the investor profile by financial intermediaries, in terms of risk return characteristics is extremely important for efficient allocation of the capital resources by matching the risk return characteristics of investors and portfolios. To our knowledge the study shall be the first attempt in India to develop a psychometric tool to measure the financial risk tolerance. Developing a country based risk measurement tool is critical as the risk taking behavior is expected to be heavily influenced by the socio – cultural and economic factors in the local context. 4. Research Methodology 4.1 Objectives This research attempts to develop a valid and reliable psychometric tool for assessing the financial risk taking capacity of investors and prospective investors. It intends to achieve the following through this research (a) Device a commercially applicable psychometric tool for assessing investor tolerance (b) Establish reliability and internal validity for a psychometric tool to assess the investor risk tolerance. The elaboration of the methodology is organized in the following order in this article. a. Operational Definitions b. Development of the initial tool c. Phases I, II, III of the research 4.2 Operational definitions Risk: Risk is defined as the probability of an unwanted event occurring and the severity of potential loss resulting from the event. Risk taking behavior: Risk taking behavior is the voluntary participation in behaviors that contain, or are at least seen to contain, a significant degree of risk. Certain behaviors are assessed to involve a high degree of risk in comparison with other equivalent behaviors, as reflected by a high probability of death, injury, financial loss and so on. People adopt different approaches to risk. Risk Tolerance: Risk tolerance level is defined as recommendable the level of investment risk that can accommodated by the following parameters: Risk Attitude: Risk attitude simply refers to the client’s actual past decisions, which is the purview of risk propensity, risk attitude measures the willingness of an investor in incurring risk in future investment decisions. Risk Capacity: Risk capacity refers to the client’s financial ability to incur risk. The risk capacity of the individual would dependent upon the following: Assets: diversification, asset allocation, risk exposure in various assets (inflation, interest rate fluctuation, market, default, liquidity, marketability, tax event, additional commitment, political and exchange rate risk) Liabilities: amount, time frame and structure of debt Financial Obligations: family, contractual, retirement Insurance coverage: medical, disability, life long term care, property and casualty, liability, business / professional Risk Knowledge: Risk knowledge refers to the relative understanding of risk and the risk – return trade off 4.3 Phases in the questionnaire development 4.3.1 Phase I: The researchers developed an initial set of items to adequately represent the different dimensions of risk, as identified in the literature and chosen based on the experience f the researchers. A total of 60 items were chosen as the initial list. Later the face validity of the items was established through an expert review of the items. . For getting experts’ opinion from practitioners’ point of view, researchers approached Geojith Securities, Cochin, Kaveesons, Cochin and Karvy Stock Broking, Cochin. Both academics and investment professionals have examined the face
- 4. Research Journal of Finance and Accounting www.iiste.org ISSN 2222-1697 (Paper) ISSN 2222-2847 (Online) Vol 2, No 2, 2011 validity. On review 14 items were dropped from the list. Overall the instrument was found to have face validity and all the items except one were found to measure different aspects of financial risk. Subsequently the set was modified by dropping items which were identified as irrelevant to financial risk by the experts. The new set of items was given to a set of 15 investors to identify any non response pattern in the set. It was assumed that these items were having face validity as they were adjudged as valid on their face by respondents with understanding of the subject area. Based on the analysis of the data obtained through responses 6 items had to be dropped further. The remaining items represented different dimensions of financial risk taking capacity, such as risk taking attitude, awareness about financial risk and capacity for risk taking as reflected through an investor’s asset, liability and income position. The new set of 29 items (Annexure 1) was administered among a set of 100 investors from Kaveesons, Kochi and prospective investors. The age profile and educational background of the respondents varied quite largely. The researchers could obtain responses only from 72 respondents. 67% of the respondents were male and the mean age of the group was 33 years. The mean work experience of the group was 6.2 years. 21% were working in urban areas, and were engaged in legal aid, local governance, natural resource management etc. The data were used to conduct bivariate and multivariate analyses. The results were as follows: a. 11 more items had to be removed for negative inter- item correlation and due to insignificant item – to – total correlation. 11 more items had to be removed for negative inter – item correlation and due to insignificant item-to-total correlation. The purpose of the inter-item correlations is to get some idea about how well the items relate to one another. First and foremost, it is essential to examine the inter-item correlations to insure that all or nearly all of them are positive. Negative correlations, if any, should be very low and widely scattered in the matrix. If any item has a consistent negative correlation with all or most of the other items, then clearly that item, as scored, is not measuring the same thing as the other items. Indeed, it may be measuring exactly the opposite of what the others are measuring. This situation can arise if the researcher has, for the sake of variety in the questionnaire, reversed the wording of some items so that a "strongly agree" response on one item corresponds in meaning to a "strongly disagree" response on another item. In that case, the scoring of the reverse-worded items should be recoded so that the highest numerical score is assigned to "strongly agree" on some items but to "strongly disagree" on others, as appropriate. After this recoding, all or nearly all of the inter-item correlations should be positive; if not, there is a bad item in the mix. As indicated at the outset, reliability implies internal consistency, which in turn requires that the items should be very closely related to one another. This would be seen through their "fairly" high, positive correlations with one another. If one or more of the items were correlated to a much lower degree than the remaining body of items (or negatively), this would suggest the elimination of such items from the scale. b. The alpha reliability of the instrument is found to be 0.73. The purpose of the Cronbach's alpha is to provide a lower bound estimate for how much variance in the empirical scale would be explained by (or shared with) an imaginary perfect measure of the same theoretical construct. The overall Cronbach's alpha was .73, a very high level of reliability. In other words, at least 73 percent of the variance in our empirical scale would be held in common with a perfect measure of the same construct. Many researchers regard an alpha of .60 or better as sufficient to justify using a scale. c. The internal validity of the instrument is found to be 0.503 (validated with an instrument developed by Grable and Lytton, 1999). The internal validity of the instrument is found to be 0.503 (validated with an instrument developed by Grable and Lytton, 1999). Internal Validity is the approximate truth about inferences regarding cause-effect or causal relationships. Thus, internal validity is only relevant in studies that try to establish a causal relationship. It's not relevant in most observational or descriptive studies, for instance. But for studies that assess the effects of social programs or interventions, internal validity is perhaps the primary consideration. d. The dimensionality assessment using 3- factors explains about 37.4% of the variance in the data. 4.3.2 Phase II: The questionnaire was modified further and 33 questions were included in the new questionnaire. This was distributed to 500 respondents. The profile of the group was as follows: 65% were males, and the mean age of the group was 35 years, the mean work experience of the group was 5 years and 40% were working in urban areas. The
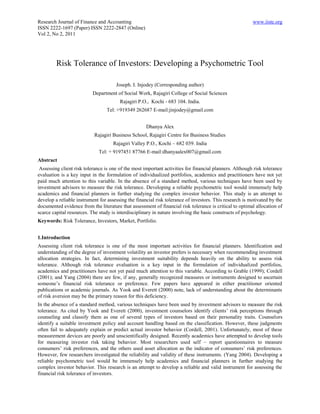
- 5. Research Journal of Finance and Accounting www.iiste.org ISSN 2222-1697 (Paper) ISSN 2222-2847 (Online) Vol 2, No 2, 2011 Cronbach’s alpha value for the tool was .72. In other words, at least 72 percent of the variance in our empirical scale would be held in common with a perfect measure of the same construct. Due to a lot of missing data in the tool with regard to the awareness part, the researchers redesigned the questionnaire, including simpler but data capturing questions to measure the awareness of investors. The new questionnaire with 33 items (Annexure 2) was administered after 3 months. The study was conducted in and around Cochin. 60 questionnaires were distributed among respondents who agreed to participate. After three reminders, 37 filled in questionnaires were obtained from respondents. Detailed examination of the data based on grossly missing or inappropriate values resulted in the deletion of 4 records. The alpha reliability of the tool was found to be 0.884. Kaiser–Meyer–Oaklin measure of sampling adequacy (KMO value) and Bartlett Test of Sphericity were found to be satisfactory. (Table 1)An exercise of factor analysis was performed on the instrument containing 33 items. This structure explained 41% of the variance. (Table 2) & (Figure 1) The first item in the list shows considerable variation from all others and hence cannot be said to be correlated. Principal component analysis (PCA) involves a mathematical procedure that transforms a number of possibly correlated variables into a smaller number of uncorrelated variables called principal components. The first principal component accounts for as much of the variability in the data as possible, and each succeeding component accounts for as much of the remaining variability as possible. The results of a PCA are usually discussed in terms of component scores and loadings. (Table 3) The table below shows the rotated component matrix based on which further explanations are made. The three factors covered are given in annexure 3 and the variables are equally divided over the three attributes. 4.3.3 Phase 3: (Proposed Phase) Although a few instruments appear in the literature attempting to measure the financial risk tolerance which claim concurrent validity, but none claim external validity of the instrument. The researchers plan to address this gap by attempting to externally validate our instrument. The following procedure shall be adopted for externally validating the instrument. The final instrument emerged out of Phase 2 shall be administered among a sample of 1000 investors and based on the norms they shall be categorized as highly risk tolerant, moderately risk tolerant and low risk tolerant. We plan to empanel a total of 600 respondents, from the earlier sample for an ongoing survey for a period of 12 months. This set of 300 shall comprise 100 respondents from the high, moderate and low risk tolerant categories. On a bi- weekly basis we shall be collecting details regarding their transactions in the financial markets through an online survey. The online survey shall attempt to verify whether:- (a) The proportion of investment in income and growth firms (b) The proportion of bonds and stocks maintained in the portfolio (c) The proportion of investment in the mid cap firms (d) The proportion of investment maintained in mutual funds by type, growth, balance, income and bond fund. (e) The proportion of new investments in the bearish market (f) The proportion of sales in a bearish market (g) The proportion of sales in a bullish market (h) The proportion of buys in a bearish market (i) Engages in speculative trading in the derivatives, without genuine hedging purpose. The following operational definitions shall be used for measuring the activities along above dimensions. Income fund: declared as income fund by the Mutual fund Balance fund: declared as balance fund by the Mutual fund Growth fund: declared as growth fund by the Mutual fund Mid – cap firms: Classified as mid – cap by the National Stock Exchange (NSE), India
- 6. Research Journal of Finance and Accounting www.iiste.org ISSN 2222-1697 (Paper) ISSN 2222-2847 (Online) Vol 2, No 2, 2011 Bearish market: The market declining consistently over a period or two weeks or the market loosing 10% of its value Bullish market: Market on the uptrend for a period of 15 days or market gaining by 10% Income firms: Firms with more than 75% of the returns during the past five years provided by way of dividends Growth firms: Firms with more than 75% of the returns available by way of capital appreciation 5. Method of Validation The mean proportions of items (a) – (h) shall be ascertained over a period of 12 months and verify means are significantly different for high, moderate and low risk tolerant categories. The intensity of speculative transactions using derivatives shall be used as qualitative observation. Although, this may not be very highly rigorous way of establishing the external validity, we consider this as significant advancement in the attempts to develop psychometric tools to measure financial risk tolerance. A computerized testing instrument shall be developed after this phase using the validated instrument. Reference Anastasi. & Urbina. (1997). Psychological Testing. Delhi. Pearson Education Inc Cordell. (2002). Risk Tolerance in Two Dimensions. Journal of Financial Planning. May. 30 – 35. Cordell. (2001). RiskPACK: How to evaluate risk tolerance.Journal of Financial Planning. June. 36 – 40. Grable. & Lytton. (1999). Financial Risk Tolerance Revisited: the Development of a Risk Assessment Instrument. Financial Services Review. 8(3). 163 – 181 Yook.&Everett. (2000). Assessing Risk Tolerance: Questioning the Questionnaire Method. Journal of Financial Planning. Table 1: KMO and Bartlett's Test Kaiser-Meyer-Olkin Measure of Sampling Adequacy. .502 Bartlett's Test of Sphericity Approx. Chi-Square 821.829 Df 528 Sig. .000
- 7. Research Journal of Finance and Accounting www.iiste.org ISSN 2222-1697 (Paper) ISSN 2222-2847 (Online) Vol 2, No 2, 2011 Table 2: Total Variance Explained Initial Eigen values Rotation Sums of Squared Loadings Comp onent Total % of Variance Cumulative % Total % of Variance Cumulative % 1 8.374 25.377 25.377 4.948 14.994 14.994 2 2.724 8.255 33.632 4.877 14.779 29.773 3 2.432 7.371 41.003 3.706 11.230 41.003 4 2.105 6.378 47.381 5 1.997 6.052 53.432 6 1.606 4.867 58.299 7 1.565 4.741 63.040 8 1.333 4.039 67.079 9 1.263 3.828 70.907 10 1.119 3.391 74.298 11 .975 2.954 77.251 12 .888 2.690 79.941 13 .767 2.326 82.267 14 .723 2.191 84.459 15 .687 2.083 86.541 16 .624 1.892 88.433 17 .480 1.456 89.889
- 8. Research Journal of Finance and Accounting www.iiste.org ISSN 2222-1697 (Paper) ISSN 2222-2847 (Online) Vol 2, No 2, 2011 18 .461 1.396 91.285 19 .427 1.295 92.580 20 .373 1.130 93.710 21 .328 .994 94.704 22 .304 .922 95.626 23 .248 .753 96.379 24 .243 .735 97.114 25 .195 .590 97.705 26 .154 .466 98.170 27 .148 .447 98.618 28 .117 .354 98.972 29 .105 .317 99.289 30 .092 .280 99.569 31 .073 .220 99.789 32 .050 .150 99.940 33 .020 .060 100.000 Extraction Method: Principal Component Analysis.
- 9. Research Journal of Finance and Accounting www.iiste.org ISSN 2222-1697 (Paper) ISSN 2222-2847 (Online) Vol 2, No 2, 2011 Figure 1. Scree Plot Table 3: Rotated Component Matrix Component 1 2 3 Portfolio of investments Risk taker .665 -.345 Experience in financial .352 investments
- 10. Research Journal of Finance and Accounting www.iiste.org ISSN 2222-1697 (Paper) ISSN 2222-2847 (Online) Vol 2, No 2, 2011 Choice in business .689 partnership Major investment objective .716 Most risky portfolio .528 Role of derivatives in .647 managing risks Preferences about investing .622 Preference in a portfolio .555 OTC derivatives are risky .339 -.308 Midcap outperforming blue .531 chips in long run Approach in reducing risk .513 Maximum loss in a year .547 .341 Increase return by increasing .717 risk If stock market falls by 15% .588 Reaction to fall in stocks .512 MF brings down investment .627 risk Describe your family .748 situation Troublesome risk .439 Impact of increase in interest .630 rate
- 11. Research Journal of Finance and Accounting www.iiste.org ISSN 2222-1697 (Paper) ISSN 2222-2847 (Online) Vol 2, No 2, 2011 Correct strategy in hedging .624 the risk using derivatives Least risky alternative in .746 derivative positions Primary financial goal in .423 investment Savings position .476 Assets .328 Domestic debt compared to .623 income Sources of income .443 Position with insurance .365 Income position .462 Major financial goals .411 Influence of listing on equity .521 share Least risky scrips .606 Reaction to past losses .584 Annexure – 1 1. What is your major investment objective? a. Maintain the security of my investments with regular income b. Have equal balance between growth of investments and current income c. More growth with some income d. Maximize growth of investments 2. Which of the following statements best describes your feeling about investing? a. I prefer an investment that will minimize the chance of losing any principal, although it may limit my long term growth
- 12. Research Journal of Finance and Accounting www.iiste.org ISSN 2222-1697 (Paper) ISSN 2222-2847 (Online) Vol 2, No 2, 2011 b. I am comfortable with moderate risk and am willing to tolerate periodic market downturns for achieving future growth c. I seek maximum future growth while being unconcerned about short term fluctuations d. I am willing to bear significant short term losses for maximizing long term gains 3. Which of the following statements best describes your preference in a portfolio? a. Higher proportion of stocks than bonds b. Equal proportions of stocks and bonds c. Higher proportion of bonds than stocks d. A bond dominated portfolio 4. Many high growth mid cap companies (value) have outperformed blue chip companies in the longer term. If such a portfolio outperforms blue chips how much of your shares portfolio would you put in to value stocks? a. I want all the money invested in value firms b. Half of my portfolio in to value and half in blue chips c. Less than half in to value and rest in blue chips d. All of blue chips 5. What would be the biggest loss you would be willing to endure in a year? a. 0% b. 10 – 15% in a year c. 20 – 30% d. 50% or more 6. If you could greatly increase your return by increasing your level of risk, would you: a. Not increase risk at all b. Take little more risk with some of my money c. Take little more risk with all of my money d. Take lot more risk with all of my money 7. What will be your reaction if the stock market fell by 15% today? a. Sell all the stocks in my portfolio b. Liquidate the stocks that lost heavily c. Be concerned and will monitor the market but do not sell any stocks d. Will buy more stocks to cash on the low prices 8. The index fund which follows the broader performance of an index is often beaten by active funds. How much active funds do you want in a portfolio? a. 100% active funds b. 50% in active funds 50% index funds c. 100% index funds d. 75% in index funds, rest in bonds 9. Portfolios which provide returns in excess of inflation carry a lot of short term risk. From this angle which of the following portfolios is most preferable to you? a. One which will significantly exceed long term inflation b. One which will moderately exceed long term inflation c. One which will is likely to marginally exceed long term inflation d. One which will match long term inflation 10. Suppose you owned a well – diversified portfolio that fell by 20% over a short period. Assuming you still have 10 years until you need to withdraw, how would you react? a. Will not change the portfolio b. Will wait at least a year before changing the portfolio c. Will wait for at least three months before changing d. Will immediately change to more conservative stocks 11. How much investment experience and knowledge you have? (Other than investing in bank accounts) a. Not at all b. I own units in a mutual fund / UTI / investment in government guaranteed bonds c. I have invested in the equity market directly but not very comfortable dealing it all myself.
- 13. Research Journal of Finance and Accounting www.iiste.org ISSN 2222-1697 (Paper) ISSN 2222-2847 (Online) Vol 2, No 2, 2011 d. I am a highly experienced investor and know exactly what I am doing 12. Which of the following portfolios are inherently most risky? a. Government Securities b. Shares of blue chip companies c. Shares of newly listed companies d. Corporate bonds 13. Mutual funds are expected to bring down the investment risk associated with securities. However, still it will not eliminate the risk altogether. Which among the following mutual fund portfolios is most risky? a. Income Fund b. Balance Fund c. Bond Fund d. Growth Fund 14. Which of the following portfolios and associated dominant risk is correctly matched? a. A portfolio dominated by highly rated corporate bonds – no risk at all b. A diversified portfolio of equity shares – Poor performance of firms c. A diversified portfolio of equity sharer – Market fluctuations d. A portfolio dominated by highly rated corporate bonds – loss of capital due to interest rate changes 15. Which of the following strategies can help you most in reducing the risk associated with equity investments? a. Investing for long term b. Investing in many firms c. Buying indexed bonds along with equity d. Investing only in shares which are part of an index 16. Which of the following sources of risk is the most troublesome for any investor? a. Prices going down when the markets decline b. Inflation reduces the returns from investment c. Poor performance of the firm brings down the value of the investment in that share d. Some of eth shares may get delisted from the market 17. What would be the impact of general interest rate increases on the value of your portfolio of shares and bonds in a manufacturing firm? a. Value of equity investment goes up; but bonds will go down b. Equity tends to loose its value; bonds also will go down c. It will not affect the equity portfolio at all; bonds may go down d. Will not affect both the shares and bonds 18. Which of the following according to you best describes the role of derivatives in managing the risk in investment? a. Derivatives can eliminate all the risk associated with investments b. Even with derivatives the risk cannot be eliminated all together c. It can eliminate risk; but comes at a price, which may even out gains d. Derivatives are too complicated and have little practical value for me 19. Which of the following is a technically correct strategy in hedging the risk using derivatives? a. When market is expected to decline, sell futures b. Market is expected to go up, sell futures c. Markets are very uncertain, do nothing d. Markets are uncertain, simultaneously engage in option buying and selling 20. Which of the following derivative positions is the least risky alternative? a. Buying call options b. Selling call options c. Buying futures d. Selling futures 21. What is your primary financial goal in investment? a. Current income b. Education Funding for Children
- 14. Research Journal of Finance and Accounting www.iiste.org ISSN 2222-1697 (Paper) ISSN 2222-2847 (Online) Vol 2, No 2, 2011 c. Retirement planning d. Build long term wealth 22. Which of the following best describes your income position? a. I have a secure income source; but income is just enough to meet my expenses b. My level of income leaves surplus for savings as well c. I have income far in excess of my needs d. I have enough cushion so that I can afford to take risks for enhancing returns 23. Please mark the choice most appropriate regarding your assets you own a. Car, Own house b. Own house, farm land, Car c. Own house, car, farm, holiday house d. None of these 24. How many times is your domestic debt compared to your income? a. No debt at all b. More than 5 times the annual income c. Less than 3 times the annual income d. Less than the annual income 25. Please identify the sources of your income (include only those sources which provide at least up to 10% of your total income) a. Job/ self employment / business alone b. Salary and business income c. Salary, business income and real estate income d. Salary, business income, real estate income and investment income 26. How does the domestic debt which you have incurred for various purposes compare with your assets? a. No debt at all b. More than 3 times the immovable and movable assets c. Less than 2 times the immovable and movable assets d. Less than the immovable and movable assets 27. Which of the following best describes your position with insurance? a. I have covered all the substantial risks and it is sufficient to give current level of income b. May not meet the latter part of (a) but all the significant risks are covered c. I have sufficient life insurance, other risks are not insured d. I am very much under insured 28. Which of the following best describes you income position? a. My regular income is more than 5 times my annual expenditure b. The income is more than 3 times my annual expenditure c. The income is more than 2 times my annual expenditure d. My income is more than my annual expenditure 29. Choose a statement which best describes your family situation a. I have more than one dependent without income b. I have dependents but they have sufficient individual income c. I have no dependents d. I am a dependent without income. Scoring of the Scale Answer choices for each item are given a weight according to the riskiness of the response. Higher weightings indicate a riskier choice, where as lower weightings indicate a less risky choice. Since the choices for items 1 – 10 and 21 – 24 are given in the ascending order of risk attitude and risk awareness, they are scored by assigning the following scores against each of the responses a = 1, b = 2, c = 3, d = 4 Items 11 – 20 are intended to capture the awareness of the investors about the risk involved financial markets and in specific financial instruments. Since all these items have a correct response they are coded dichotomously with score 1 for correct responses and score 0 for wrong responses.
- 15. Research Journal of Finance and Accounting www.iiste.org ISSN 2222-1697 (Paper) ISSN 2222-2847 (Online) Vol 2, No 2, 2011 Annexure 2 1. Which of the following best describes your existing portfolio of investments in the market? a. Shares of very few firms b. Shares of a number of firms c. Shares and bonds with nearly equal proportions d. Mostly bonds 2. How would others describe you as a risk taker? a. Risk averse b. Cautious c. Risk seeker d. Unconcerned about risk 3. How much experience you have in financial investments? (Other than bank deposits) Please select as many responses as applicable to you. a. I invest in bonds b. I invest in mutual funds c. I invest in equity market directly d. I invest in derivatives 4. You are given the following choices associated with a new business partnership, where you invest up to 50% and look after its management along with a friend of you. Which one would you choose? a. Assured return on your capital plus a fixed management fee b. Actual returns on your capital plus a fixed management fee c. Actual returns on your capital plus a variable management fee d. Actual returns and additional partnership rights instead of management fee. 5. Which of the following best describes your major investment objective? a. Earn regular income b. Balance between growth of investments and regular income c. More of growth with some regular income d. Maximise growth of investments 6. Which of the following portfolios is most risky according to you? a. Government Securities b. Shares of blue chip companies c. Shares of newly listed companies d. Corporate bonds 7. Which of the following, according to you, best describes the role of derivatives in managing the risk in investment? a. Derivatives can eliminate all the risk associated with investments b. Even with derivatives the risk cannot be eliminated altogether c. It can eliminate risk; but comes at a price, which may even out the gains d. Derivatives are too complicated and have little practical value for me. 8. Which of the following statements best describes your preferences about investing? a. I prefer an investment that will minimise the chance of losing any principal, although it may limit my long term growth b. I am comfortable with moderate risk and am willing to tolerate periodic market downturns for achieving future growth c. I seek maximum future growth while being unconcerned about short term fluctuations d. I am willing to bear significant short term losses for maximising long term gains 9. Which of the following statements best describes your preference in a portfolio?
- 16. Research Journal of Finance and Accounting www.iiste.org ISSN 2222-1697 (Paper) ISSN 2222-2847 (Online) Vol 2, No 2, 2011 a. More of stocks than bonds b. Equal proportion of stocks and bonds c. More of bonds than stocks d. All of bonds 10. OTC derivatives are considered risky because a. There is no formal margining system b. They do not follow any formal rules or mechanisms c. They are not settled on a clearing house d. All of the above 11. If high growth mid cap companies out perform blue chips in the long run, but have higher risk, how much of your equity portfolio would you put in to such mid caps? a. All the money in to mid caps b. Half the portfolio into mid caps and remaining in blue chips c. Less than half into mid caps and rest in blue chips d. All of blue chips 12. Which of the following approaches can help you in reducing the risk associated with equity investments? a. Investing for long term b. Investing in many firms c. Investing in the index d. Investing only in shares not included in an index 13. Which range would be the maximum loss you would be willing to endure in a year while investing in equity? a. 0% - 5% b. 6 – 15% in a year c. 16 – 30% in a year d. More than 50% in a year 14. If you could greatly increase your return by increasing your level of risk; would you a. Not increase risk at all b. Take little more risk with some of my money c. Take little more risk with all of my money d. Take lot more risk with all of my money 15. What will be your reaction if the stock market falls by 15% today? a. Sell all the stocks in my portfolio b. Liquidate the stocks that lost heavily c. Be concerned, but do not sell any stocks d. Buy more stocks to cash on the low prices 16. Suppose you owned a well diversified portfolio that fell by 20% over a week. Assuming you still have 10 years until you need to with draw, how would you react? a. Will not change the portfolio b. Will wait at least a year before changing the portfolio c. Will wait for at least three months before changing d. Will immediately change to more conservative stocks 17. Mutual funds are expected to bring down the investment risk associated with securities. However, it will not eliminate the risk all together. Which among the following mutual fund portfolios is most risky? a. Income fund b. Balance Fund c. Bond Fund d. Growth Fund 18. Choose a statement which best describes your family situation a. I have more than one dependent with out income b. I have dependents but they have sufficient individual income c. I have no dependents d. I am a dependent without income
- 17. Research Journal of Finance and Accounting www.iiste.org ISSN 2222-1697 (Paper) ISSN 2222-2847 (Online) Vol 2, No 2, 2011 19. Which of the following sources of risk is the most troublesome for any investor? a. Prices fall when the markets decline b. Inflation reduces the returns from investment c. Poor performance of the firm brings down the value of the investment in that share d. Some of the shares may get de listed from the market 20. What would be the impact of general interest rate increase on the value of your portfolio of shares and bonds in a manufacturing firm? a. Value of equity investment goes up; but bonds will go down b. Equity tends to loose its value; bonds will also go down c. It will not affect the equity portfolio at all; bonds may go down d. Will not affect both shares and bonds 21. Which of the following is a technically correct strategy in hedging the risk using derivatives? a. When market is expected to decline, sell futures b. Market is expected to go up, sell futures c. Markets are very uncertain, do nothing d. Markets are uncertain; simultaneously engage in option buying and selling 22. Which of the following derivative positions is the least risky alternative? a. Buying call options b. Selling call options c. Buying futures d. Selling futures 23. What is your primary financial goal in investment? a. Regular income b. Education funding for children c. Retirement planning d. Build long term wealth 24. Which of the following best describes your savings position? a. I have a secure income source; but it is just enough to meet my expenses b. My level of income leaves about 25 – 50% surplus for savings c. I can save more than 50% of my income. 25. Please mark the choice most appropriate regarding your assets you own a. Car, own house b. Own house, farm land, car c. Own house, car, farm land, holiday house d. None of these 26. How many t times is your domestic debt compared to your income? a. No debt at all b. More than 5 times the annual income c. Less than 3 times the annual income d. Less than the annual income 27. What are your sources of income (include only those sources which provide at least up to 10% of your total income). Please select as many responses as applicable to you a. Salary b. House property c. Capital Gains d. Business or profession 28. Which of the following best describes your position with insurance? a. I have covered all the substantial risks and it is sufficiently to give current level of income to my dependents in an eventuality b. May not meet the latter part of (a) but all the significant risks are covered c. I have sufficient life insurance, other risks are not insured. d. I am very much under insured 29. Which of the following best describes your income position?
- 18. Research Journal of Finance and Accounting www.iiste.org ISSN 2222-1697 (Paper) ISSN 2222-2847 (Online) Vol 2, No 2, 2011 a. My regular income is more than 5 times my annual expenditure b. The income is more than 3 times my annual expenditure c. The income is more than 2 times my annual expenditure d. My income is more than my annual expenditure 30. How far away are your major financial goals? a. Less than 2 years b. 2 to 5 years c. 5 to 10 years d. More than 10 years 31. How does listing influence an equity share? a. Increases the risk and reduces the liquidity b. Reduces the risk and reduces the liquidity c. Reduces the risk and increases liquidity d. Listing does not have any significant impact on risk or liquidity 32. Which of the following scrips is the least risky? a. Pays higher than average dividend b. Follows the business cycle of advances and declines in the economy c. Remains stable during declines in the economy d. Issued by a corporation that has the potential of earning profits above the average profits of all firms in the economy 33. How did you react to financial losses in the past? a. Feels guilty and decides to avoid such situations all together in future b. Feels the need to be more cautious in future c. Feels without risks, there are no gains. d. There are no losses for me so far, I had been careful in all investments Annexure - 3 Factor 1 covered 7. Role of derivatives in managing risks 10. Whether OTC derivatives are risky or not? 11 Mid caps out performing blue 16. Reaction to fall in stocks 18. Family situation 19. Troublesome risk for investor 20. Impact of general interest rate increase on the value of portfolio shares and bonds 23. Primary financial goal in investment 24. Savings position 26. Domestic debt compared to income 27. Sources of income 28. Position with insurance 31. Influence on equity share 32 .Least risky scrip Factor 2 covered 2. How others describe you as a risk taker 3. Experience in financial investments 4. Choice in business partnership 5. Major investment objective
- 19. Research Journal of Finance and Accounting www.iiste.org ISSN 2222-1697 (Paper) ISSN 2222-2847 (Online) Vol 2, No 2, 2011 8. Preference about investing 9. Preference in a portfolio 13. Maximum possible loss in year you are willing to under go 14. Willingness to increase return by increasing risk 25. Assets owned 33. Reaction to past losses Factor 3 covered 6. Most risky portfolio in your opinion 12. Approach in reducing risk 15. Stock market falls by 15% 17. Most risky among mutual fund portfolios 21. Correct strategy in hedging risk using derivatives 22. Least risky alternative among derivative positions 29. Income position 30. Major financial goals Variables are equally divided over the three attributes.