Rate of sediment yield in the conveyance canals of kano river irrigation project (phase i) north western nigeria
•
1 recomendación•704 vistas


Recomendados
Recomendados
Más contenido relacionado
La actualidad más candente
La actualidad más candente (19)
Similar a Rate of sediment yield in the conveyance canals of kano river irrigation project (phase i) north western nigeria
Similar a Rate of sediment yield in the conveyance canals of kano river irrigation project (phase i) north western nigeria (20)
Más de Alexander Decker
Más de Alexander Decker (20)
Último
Último (20)
Rate of sediment yield in the conveyance canals of kano river irrigation project (phase i) north western nigeria
- 1. Journal of Environment and Earth Science ISSN 2224-3216 (Paper) ISSN 2225-0948 (Online) Vol. 3, No.12, 2013 www.iiste.org Rate of Sediment Yield in the Conveyance Canals of Kano River Irrigation Project (Phase I) North-Western Nigeria Tukur, A. I.1* Olofin, E. A2, & Mashi, S. A3 aitukur@hotmail.com, eaolofin@hotmail.com, sanimashi@gmail.com 1* Department of Geography, Kano University of Science and Technology, Wudil 2. Department of Geography, Bayero University, Kano 3. Department of Geography, Umaru Musa Yar’aduwa University, Katsina Abstract This study examined the rate of sedimentation in the conveyance canals of Kano River Irrigation Project (Phase I). Five canals were sampled from the total number of canals using systematic sampling technique. The base lines of the canals were taken to be the transect line, and all the samples were taken with reference to the transect line using simple random sampling. The method adopted was a combination of volumetric analysis and filtration method for field and laboratory work respectively. Variables investigated include canal discharge at pre and post siltation period, sediment texture, and sedimentation of the canals. Descriptive statistics with the use of tables (as means total and percentages) was used for the analysis and presentation of data collected on canals discharge, sediment texture and suspended and dissolved sediments. The deposit consists of a fine sand fraction (76.3%) with a small amount of clay and silt of about 12.04% and 11.66% respectively. The average canal concentration for the suspended sediment concentration was found to be 8474.4 ton per annum. Although result of student ttest revealed no difference between the present and potential discharge the canals discharge has reduced by 47%. And this in turn affected the farms by reducing the total designed irrigable hectares of land. Many factors are believed to have contributed to the increase of sediments in the canals which include movement of farm tractors across the canals, poor irrigation practice by the farmers, and lack of adequate maintenance. It is recommended among other things that: there should be effective maintenance and monitoring of the canals through regular disilting and cleaning the canals by the participant farmers and the government. Keywords: Canals, siltation, discharge, texture, accumulation. 1.1 Introduction Sedimentation and its complex process along the waterways of arid and semi-arid regions where various topographic and climatic factors are reportedly the contributory factors emerging as the major hydraulic considerations in project feasibility study (Hedayat, 2005). The study of sediment loads are crucial because they have major consequences on the hydraulic behavior of the waterways in terms of their morphology and transported loads that may have scouring effect in certain parts and establishment of sediment islands on the other (Shirin et al 2010, Ashkarian et al 2010). This, as various studies have indicated, can have grave consequences for the operational sustainability and performance efficiency of the water abstraction, conveyance and distribution system of the vital hydraulic structures that are fed by the flow originating from these natural sources (Sajedi et al 2010). Sediments yield has been identified as the major cause of reservoir and canal sedimentation. Rate of sediment yield have been observed in temperate environments especially in Europe and North America, and general relationships established between the long term sediment yield of rivers and physical factors such as geology, relief, vegetation and land use, and with hydro meteorological factors (Andeson, 1969; Imeson, 1971; Gregory and Walling, 1973, Walling 1974). The data derived have been of tremendous value in water use planning. Observations on the rate and dynamics of sediment yield have been attempted from different surfaces under varying land uses with the aid of erosion plots (Kowal, 1970; Lal, 1988, Jeje, 1977; Oyegun, 1980; and Leow and Ologe, 1981). Glymph (1977); reported that some small reservoirs in the United States incure up to 25% storage loss annually as a result of sediment deposited in them. Dasma et al (1973); identified a similar phenomenon for reservoirs downstream of mining areas in the United State, while Platt (1971) reported similar occurrence in reservoirs downstream of logged areas in the United State. In Nigeria, Imevore et al (1988) for example reported that some dams in Nigeria which include the one near IleIfe at Oko Odo had become totally silted up and turned into weed-infested marshes due to rapid urban development and farming activities at the headwaters of the lake. Another example is that of Efforn Alaye reservoir in former Ondo now Ekiti State of Nigeria, which would have completely silted up, but for perennial dredging. The situation in northern Nigeria where there is marked seasonality in rainfall is similar. For example, in his study of the extent of sedimentation in the reservoir of Kubanni River Zaria, Iguisi (1997) recorded a maximum depth of 5.2m as against the initial 8.5m which indicated a loss of about 3.3m ( i.e about 30% loss in storage capacity) in 23 years and an average annual loss of depth of about 14.3cm. This is the result of eroded 155
- 2. Journal of Environment and Earth Science ISSN 2224-3216 (Paper) ISSN 2225-0948 (Online) Vol. 3, No.12, 2013 www.iiste.org materials transported and deposited on the reservoir floor, thus, sediment accumulation within the basin is very high. Yusuf & Igbinigie (2010) studied the relationship between Discharge and Sediment Loads of Samaru Stream, Zaria. Their findings revealed that the stream discharge is a response to rainfall seasonality. The Kano River Irrigation Project Phase I is a large area with a proposed 22,000 hectares of land with lateral, distributory, and field canals to deliver water to farmlands. The project is entirely gravitational and canals are the conveyance system of the irrigation water. However, for over two decades, the canals particularly the distributory canals have been overgrow by an emergence of aquatic weeds belonging to the family Typhacea, and it is believed to be a direct response to siltation of the conveyance canals (Abdullahi, 2009). It is a common practice for the local farmers and fishermen in the Kano River areas to clear canals, drainage and channels by cutting and removing these plants for successful farming. Government on the other hand used to disilt the canals from time to time. None of these studies touched on the rate of sediment yield and its effect on the functioning of the irrigation canals of the project. Yet the muddy nature of the water in the canals indicates high concentration of sediments. It is because of this reason therefore, that this research focused on sedimentation problems in one of the largest irrigation schemes in West Africa, with a view to examine the rate of sediment accumulation and find out whether it constitutes part of the problem of the irrigation project. 1.2 Aim and Objectives The aim of the study is to examine the rate of sediment yield in the canals, with a view to determine if it constitutes part of the problem of the irrigation project. The objectives to achieve the aim are to: i. Determine the suspended and dissolved sediment of the canal’s discharge ii. Determine the potential and present water discharge of the canals, and iii. Examine the rate of sediment accumulation in a sample of them 2.0 Materials and Methods 2.1 Study Area Kano River Irrigation Project is divided by the River Shimar into East and West Branch. For the purpose of this study, the western branch of the project was selected and used as the study area. The Western Branch sectors falls within longitude 80 23’ to 80 37’ East and latitude 110 36’ to 110 51’ North. The cultivated area is situated in southern part of Kano State in Kura and Garun Malam Local Government Areas. It is 13, 630 hectares in extent and bound by the Kano River and Shimar River on the western and eastern side respectively. Water from the Tiga Dam is conveyed by (19 km) long Main Canal up to Garun Babba village where the division works have been constructed. (Hadejia Jama’are River Basin Development Authority Year Book 1994). 156
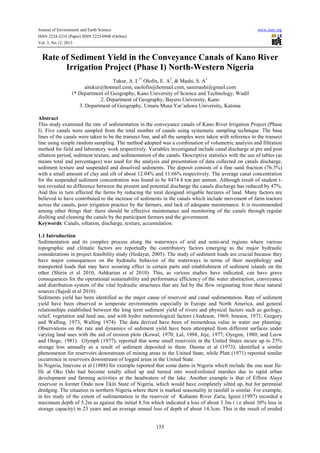
- 3. Journal of Environment and Earth Science ISSN 2224-3216 (Paper) ISSN 2225-0948 (Online) Vol. 3, No.12, 2013 www.iiste.org 2.2 Sampling and Site Selection The Kano River Irrigation Project Phase I has 18 sectors each with a Distributory Canal (DCs) and Field Canals (FCs), besides the Main Canal (MCs). Distributary Canals (DCs) are the focus of the research, simply because they are the major canals affected by the sedimentation problem and they supply the field canals with water that supplies the farms. A sample of five distributory canals was taken using systematic sampling techniques from Kore, Agolas, Gori South, Gori North and Rakauna Sector. The base line of the canals were taken to be the transect line and all the sampling points within the canal were taken with reference to the transect line. The number of sampling points within each canal is proportional to the length of the canal and 6 points were taken from Kore DC , 7 points from Agolas DC , and 5 points each from Gori South DC , Gori North DC , and Rakauna DC . A total of 28 points were selected for collection of bed loads and water sample using simple random sampling techniques. Figure 2. Kano River Irrigation Project Phase 1 (22, 000 ha) Showing Sampling Points. 2.3 Types of Data The types of data collected are sediment deposits, sediments depth, canal width, depth and length, and water sample and water discharge. 2.4 Method of Data Collection a. Collection of Bed Loads The base line of the canal was used as the grid line to determine the depth of the deposit and its volume. The deposits were first exposed by closing the water in the canals for 48 hours and the lined portion with concrete was used. One meter excavation was made and the depth of the deposit was measured. The samples were taken from the sediment deposit from the points of study. The samples were properly mixed to represent the entire sediment. All the samples were taken at different points along the canals in order to have good representation of the sediment characteristics of interest. All the samples collected were put in clean polythene bags and numbers indicating the canal/sector each sample belonged were used to label each bag. b. Collection of Water Sample Plastic bottles of 350mls were used for collecting water samples. The bottles were held and deepened in the water in the manner approved for suspended sediment sampling. Each sample taken was put in a clean plastic bottle and leveled. Twenty eight samples were taken in two stages. The stage at which water was released and the stage at which water was closed having 15 and 13 samples respectively. Plate 1 shows the method of water 157
- 4. Journal of Environment and Earth Science ISSN 2224-3216 (Paper) ISSN 2225-0948 (Online) Vol. 3, No.12, 2013 www.iiste.org collection. Plate 1. Immersing the Collecting Bottle to Collect Water Sample 2.5 Method of Data Analysis 2.5.1 Laboratory Analysis. 2.5.1.1 Particles Size Distribution Analysis The sediment samples collected were air-dried and big lumps were crushed with an aid of motar and pestle. They were then passed into a 2mm sieve and stored in polythene bags for final analysis. Hydrometer method was used for analyzing the particle sizes. 50 grams of 2mm sieved soil samples was weighed into a polythene bottle. To this, 25ml of Calgon (sodium hexametaphosphate) plus 400 ml tap water were added and shaked thoroughly on end-over-end shaker at 40 to 60 revolutions per minute lasting for 15 minutes. This was in the absence of a high speed stirrer container for proper shakened. The soil suspension was transferred into a 1 litre capacity cylinder and diluted and also stirred for 1 minute by the use of a plunger. The hydrometer was inserted and the readings were taken at two different times (4 minutes, 48 second and 5 hours) under a temperature of 32 0C. Mean values of sand, silt and clay were determined and textural class of the sediment deposit was obtained. 2.5.1.2 Measurement of Suspended and Dissolved Sediment Filtration method was used for the analysis. To this end, 20mls of the water samples was measured using a measuring cylinder. The measured sample was poured into a dry and weighed conical flask through a funnel filted with a folded filter paper which was also dry and weighed. The aliquot was allowed to drain into the conical flask through the filter paper. The solid suspended sediment was obtained by drying the filter paper in an oven at 1800C. The difference between the weight of the filter paper plus the residues and the weight without the residues signify the quantity of the suspended sediment per 20mls. The filtrate in the conical flask was also dried in a hotplate at 120 0C to allow the water evaporates. This was allowed to cool later. The dissolved solutes were obtained by the difference between the weight of the flask with and without the residue. The dissolved and suspended sediment were then added to determine the concentration per liter using the formula described by Finlayson (1981). The canal yield was calculated by multiplying the present discharge with the sediment concentration. Four month’s irrigation period was used to calculate the canal yield per annum simply because the time when the research was undertaken was during the dry season for only four month. 2.5.2 Statistical Analysis Descriptive statistics with the use of tables (as frequencies and percentages) was used for the analysis of the collected data on sediment texture, canals discharge, suspended and dissolved sediments. The results were tabulated for easy assessment. Data on initial depth and present depth of the canals was subjected to students’ttest to find whether there is a significance difference between the two. The difference was also used to estimate the effect of the sedimentation on the functioning of the canals. Also data on canal’s discharge and sediment 158
- 5. Journal of Environment and Earth Science ISSN 2224-3216 (Paper) ISSN 2225-0948 (Online) Vol. 3, No.12, 2013 www.iiste.org concentration was subjected to correlation analysis to see if there is relationship. 3.0 Result and Discussion 3.1 Difference Between the Designed and Present Depth of the Canals Analysis in Table 3.2 reveals that the sediment depth of the canals (3.72m) has reduced from the initial depth of 5.05m accounting for 77 percent reduction. Thus, the canals become shallow and can no longer accommodate the discharge designed for them. Field observation revealed that some silted section of the canals has become a cattle track where the Fulani rearers and farmers have almost converted some passage to permanent routes for them (See Plate 4.2). The result of inferential statistics showed that, there is significance difference between the designed depth and present depth of the canals at 5% level of significance, which has significantly reduced from 5.05m (100%) to 1.33m (23%). The remaining 77% of the depth was accumulated by sediment thereby affecting the function of the canals. Table 1. Difference between the Designed and Present Depth of the Canals Sectors Design Depth (m) Present Depth (m) % Mean Sediment Depth (m) % Kore 0.91 0.11 12 0.80 88 Agolas 1.06 0.36 34 0.70 66 Rakauna 0.78 0.08 10 0.70 90 Gori South 0.84 0.10 12 0.74 88 Gori North 1.46 0.68 47 0.78 53 Average 5.05 1.33 23 3.72 77 Source: Field Work, 2010. 3.2 Particle Size Distribution of the Canal’s Sediment The deposited sediments are characterized by a texture dominated by sand with small fractions of clay and silt as shown in Table 3.1. Sand fraction dominated the texture, followed by clay and silt. The low silt content may be attributed to the excessive washout of the particles by the flowing water. Since the particles are light in nature, they can move in suspension for a long period. Also, the clay fraction was found to be low, but slightly higher than silt fraction and this may be the reason why a thin layer of black deposit was seen between the layers of sand deposit in the process of excavation. Using textural triangle, the deposit was found to be within the range of loamy sand and sandy loamy soil. It is believed that the washout comes from the farm land upstream, and this agreed with the NEDECO (1976) report that the soil of the area was within the range of sandy loamy to loamy sand. And it is observed and agreed that soil erodibility tends to increase with greater silt content and decrease with greater sand and clay contents (Wischimier and Smith, 1958). In addition, the texture provides a good environment for the growth of aquatic grasses. Indeed, Wischimier and Smith (1958) in Yusuf (2006) described such type of texture as favorable range for good roots penetration. This may be the reason why the canals are presently taken over by grasses. The structure is also loose and less compact. This shows that disilting will not be difficult. Table 2. Particle Size Distribution of the Canal’s Sediment Sectors Sand (%) Silt (%) Clay (%) Total Kore 74.3 24.3 1.4 100 Agolas 82.3 6 11.7 100 Rakauna 72.3 10 17.7 100 Gori South 78.3 8 13.7 100 Gori North 74.3 10 15.7 100 Average 76.33 11.6 12.04 100 Source: Field Work, 2010. 3.3 Suspended and Dissolved Sediment of the Canal’s Discharge Table 3 reveals that suspended sediments are lower in percentage than the dissolved ones, and this may be due to the fact that the higher the velocity and volume of water, the lower will be the sediment trapping efficiency of the canals, and this is true even in the flow of Natural River. The higher proportion of dissolved sediment may be attributed to insufficient water in the canals, and as such suspended sediment at that time were stable and static in a small volume which lacked energy to disperse them. Also, the movement of cattle and farm tractors across the canals is higher when the flow is static. These factors might have contributed to the variation in the canals’ sediment concentration. Water samples was collected under two different period (high and low discharge period), and the two samples tested gave different mean concentration per liter as shown in Table 4. The average annual sediment concentration under high discharge period was found to be 8474.4 tons, while that of low discharge period was found to be 9991.2 tons. This may be due to the fact that the higher the velocity and volume of water the lower will be the 159
- 6. Journal of Environment and Earth Science ISSN 2224-3216 (Paper) ISSN 2225-0948 (Online) Vol. 3, No.12, 2013 www.iiste.org sediment concentration in the canal discharge. Thus, the variation in the canal’s concentration is connected with the water level in the canals and velocity at the time of collection. Collection under low discharge period was made at the time when the water in the canals was small and very steady or static. As such suspended sediments at that level were stable and static in a small volume which lacked enough energy to disperse them. Collection under high discharge period on the other hand is the period when the sediments were dispersed all over the canals in an unstable environment with a high velocity. Under such conditions the concentration would be low. These factors have contributed to the variation in the canals sediment concentration. The result of inferential statistics showed a strong relationship between water discharge and sediment concentration where the value obtained is 0.66. The concentration obtained is believed to be a product of erosion and not from the irrigation water itself. The report of NEDECO (1976) shows that the irrigation water at the inception was without such suspended sediments. It can therefore be concluded that the sediment concentration of the canal is a function of both anthropogenic and natural factors. Deforestation, cattle activities and agricultural machineries are believed to be the anthropogenic factors, while the type of soil texture of the area to some extent contributed to the increase of sediment yield in the area. This is because the physical aspects of any region can determine the rate of siltation in the area, simply because whatever sediment is produced and transported depends on the magnitude of the various active and passive forces operating within the areas (Fournier, 1960). Table 3. Suspended and Dissolved Sediment of the Canal’s Discharge Sectors. Suspended (g/lit) Dissolved (g/lit) Kore 1.2 1.2 Agolas 1.1 1.7 Rakauna 1.0 1.1 Gori South 0.9 1.0 Gori North 0.9 1.1 Average 1.02 1.22 Total 2.4 2.8 2.1 1.9 2.0 2.24 Source: Field Work, 2010 Table 4. Sediment Concentration in Tons under High and Low Discharge Period Sectors. High Discharge Period Low Discharge Period Day (10 hours) Month Year (4 Month) Day (10 hours) Month Year (4 Month) Kore 124.7 3741 14964 157.7 4731 18924 Agolas 159.7 4791 19164 164.5 4935 19740 Rakauna 44.9 1347 5388 54.9 1647 6588 Gori South 11.6 1392 1392 18.2 546 2184 Gori North 12.2 1464 1464 21 630 2520 Average 68.3 2547 8474 83.26 2497.8 9991.2 Source: Field Work, 2010 3.4. Difference between Potential and Present Water Discharge Table 5 revealed that the accumulated sediment has reduced the potential discharge of the canals by an average of 651.58 lit/sec or 47%. Thus, the canals become shallow and no longer accommodate the discharge designed for them. The result of inferential statistics however showed no significance difference between the potential and present canal’s discharge at 5% level of significance, and this may be due to the small samples of canals taken. Had it been the samples taken are large, it would show a significance difference. Field observation on the other hand revealed that, some silted sections of the canals have become cattle tracks which the Fulani rearers have almost converted to permanent routes for them. Thus, the reduction of about 47% of the potential discharge is enough to ascertain that sediment deposits have accumulated in large volume in the canals’ thereby reducing the designed capacity of the canals discharge. This is similar with the findings of U.S Geological Survey on reservoir sediment studies in Kansas where the results indicated decreases in total water-storage capacity at normal pool elevations due to sedimentation which ranged from less than 5 percent at Cheney Reservoir (southcentral Kansas), Hillsdale Lake (northeast Kansas), and Webster Reservoir (north-central Kansas) to about 55 percent at Crystal Lake, a small impoundment in east-central Kansas. Decreases in storage capacity at Perry and Tuttle Creek Lakes (northeast Kansas) were in the range of 20 to 35 percent. 160
- 7. Journal of Environment and Earth Science ISSN 2224-3216 (Paper) ISSN 2225-0948 (Online) Vol. 3, No.12, 2013 www.iiste.org Table 5. Difference between Potential and Present Water Discharge Sectors. Potential (lit/Sec) Present (Lit/Sec) Difference Kore 2633.76 1444.32 1189.44 Agolas 3030.24 1584.8 1445.44 Rakauna 594.72 283.2 311.52 Gori South 339.84 169.92 169.92 Gori North 311.52 169.92 141.6 Average 1382.01 730.43 651.58 Source: Field Work, 2010 Reduction (%) 45.16 47.70 52.36 50.0 45.45 47.14 4.0 Conclusion The study examined the rate of sediment yield in the conveyance canals of Kano River Irrigation Project Phase I. The study has shown that irrigation canals can be made less effective by siltation/sedimentation where there is poor maintenance culture. It is obvious that over the years, the canals at the Kano River Irrigation Project have not received proper attention to remove the sediments from the canals. Rather, the problem of sedimentation is compounded by escalated erosion within and upstream of the irrigated plots by human and animal activities. This in turns affected the total hectares under cultivation and serious crises of irrigation water. 4.1 Recommendations Based on the findings of the study, the following recommendations are given to reduce the problem of sedimentation to the minimum, as sedimentation is a natural phenomenon which can not be controlled in totality. i. There should be effective maintenance and monitoring of the canals through regular disilting and cleaning of the canals by the government and participating farmers. Indeed, the Farmers association like Water Users Association (WUA) should be encouraged and enlightened to pursue disilting and cleaning of the canals at short intervals of about 6 month. To this end, they should be mobilized through enlightenment campaigns ii. Efforts should be made to reduce erosion in the upstream areas through tree planting at the erosion catchments area and to prevent cattle using the canals and irrigated farms as transit routes. iii. Adequate and timely financial support should be given regularly to the Kano River Irrigation Authority by the government to maintain the irrigation structures and repair the equipments for desiltation. iv. Participating farmers should always be consulted and their view sought when solving the problem of siltation. References: Abdullahi, I.L. (2009), Typaceae in the Kano River Irrigation Project and Management Issues. Ph.D Seminar of Geography 9206, Department of Geography, Bayero University, Kano. Anderson, H. W. (1969), Relating Sediment Yield to Water Shed Variables. Trans. Amer. Goephysical Union, Pp. 38, 6, 921-924 Ashkarian, S. Kiamanesh, H. and Hedayat, N. (2010), Symulation of Flow Pattern Using Flow 3D in Dez Diversion Dam in Dezful. Proceedings of National Conference on Water, Soil , Plant Sciences & Agricultural Mechanization , Islamic Azad University Dezful Branch, Dezful, Iran.2-3 March 2010 Dasma,R.F., Mitan, J.P and Freeman, P.H. (1973), Ecological Principles of Economic Development. John Wiley, London. Glymph, L.M. (1977), Sedimentation of Reservoir, In: Acherman, W.C. et al (eds) Man Made Lakes: Their Problems and Environmental Effects. Geophysical Monography.17, American Geophysical Union, Washington, D.C. Pp. 4342-4348 Gregory, K.J. and Walling, D.E (1973), Drainage Basin, Form and Process, Edward Arnold, London Hadejia Jama’are River Basin Development Authority Year Book, 1994 Hedayat, N (2005). Improving the Performance of Water Delivery in the Dez and Moghan Irrigation Schemes in Iran ”, PhD thesis, Crandfieid University, UK Iguisi, E.O. (1997), An Assessment of the Current level of Sedimentation of the Kubanni Dam. Savanna, 18(1), Pp. 17-28 Imeson, A.C. (1971), Solute Variations in Small Catchment Streams. Transactions Inst. of British Geographers, Pp. 87-100 Imevore, A.M., Ogunkoya, O.O., and Sagua, V.O. (1988), Effects of Soil Erosion on Aquatic Ecosystem in Nigeria, In: Sagua, V.O. et al (eds) Ecological Disaster in Nigreria: Soil Erosion. Federal Ministry of Science and Technology, Lagos. Jeje, L.K. (1977), Some Soil Erosion Factors and Losses from Experimental Plots in the University Farm, University of Ife-Ife, Nigeria. The Nigerian Geographical Journal, Vol. 20, Pp. 59-69 161
- 8. Journal of Environment and Earth Science ISSN 2224-3216 (Paper) ISSN 2225-0948 (Online) Vol. 3, No.12, 2013 www.iiste.org Kowal, J. (1970), The Hydrology of a Small Catchment Basin at Samaru, Nigeria: IV Assessment of Soil Erosion Under Varied Land Management and Vegetation Cover. Nigerian Journal of Agriculture. 7, 2, Pp. 134147 Lal, R, ed (1988) Soil Erosion Research Methods. Soil and Water Conservation Society, Ankeny, Iowa. Leow, K.S. and Ologe, K.O. (1981), Rates of Soil Wash Under a Savanna Climate, Zaria, Northern Nigeria. Mimeo, Dept. of Geography, Ahmadu Bello University, Zaria. Netherland Engineering Consultants (NEDECO) Main Reports, 1976 Oyegun, R.O (1980) The Effect of Tropical Rainfall on Sediment Yield From Different Land Use Surface in Sub- Urban Ibadan. Unpublished PhD Thesis, University of Ibadan. Platt, W.S. (1971) The Effects of Logging and Road Construction on the Aquatic Habit of the South Salmon River, Idaho. Testimony of U.S. Senate Hearing on Clear Cutting Practices on Natural Timberland. Pp 113-115 Sajedi, A.H. (2010), “ Analytical Study of the Sediment Formation Using the SHARC Computer Model- A Case Study of the Western Water Intake in the Dez Diversion Weir in Dezful”, Iran. M.Sc Dissertation, I.Azad University, Dezful, Iran.Shirin, H, Hedayat, N and Kiamanesh, H. (2010), “ Investigating the Sedimentation Process using the SHARC Software- A Case Study of the Eastern Water Intake of the Dez Diversion Weir in Dezful”, Proceedings of the National Conference in water, Soil, Plant and Agricultural Mechanization, Islamic, Azad University,Dezful, Iran. 2-3 March 2010 Walling, D.E (1974), Suspended Sediment and Solute Yields from a Small Catchments Prior to Urbanization. I.B.G. Special Publication. 6, Pp. 169- 192 Wischmier, W.H. and Smith, D.D. (1978), Predicting Rainfall Erosion Losses. A guide to Conservation Planning. U.S Department of Agriculture HandBook, 537 Washington D.C Yusuf, Y.O. and Igbinigie, V. O. (2010), Relationships between Discharge and Sediment Loads of Samaru Stream, Zaria, Nigeria. The Nigerian Geographical Journal New Series Vol. 6 No. 1, 2010. pp. 73-88. Yusuf, Y.O. (2006), An Analysis of the Magnitude of Suspended Sediment Production by the Northernmost Tributary of the Kubani River, Zaria, Kaduna State. Unpublished M.Sc Thesis, Department of Geography, Ahmadu Bello University, Zaria. 162
- 9. This academic article was published by The International Institute for Science, Technology and Education (IISTE). The IISTE is a pioneer in the Open Access Publishing service based in the U.S. and Europe. The aim of the institute is Accelerating Global Knowledge Sharing. More information about the publisher can be found in the IISTE’s homepage: http://www.iiste.org CALL FOR JOURNAL PAPERS The IISTE is currently hosting more than 30 peer-reviewed academic journals and collaborating with academic institutions around the world. There’s no deadline for submission. Prospective authors of IISTE journals can find the submission instruction on the following page: http://www.iiste.org/journals/ The IISTE editorial team promises to the review and publish all the qualified submissions in a fast manner. All the journals articles are available online to the readers all over the world without financial, legal, or technical barriers other than those inseparable from gaining access to the internet itself. Printed version of the journals is also available upon request of readers and authors. MORE RESOURCES Book publication information: http://www.iiste.org/book/ Recent conferences: http://www.iiste.org/conference/ IISTE Knowledge Sharing Partners EBSCO, Index Copernicus, Ulrich's Periodicals Directory, JournalTOCS, PKP Open Archives Harvester, Bielefeld Academic Search Engine, Elektronische Zeitschriftenbibliothek EZB, Open J-Gate, OCLC WorldCat, Universe Digtial Library , NewJour, Google Scholar