1. Your Task: Completing and Analysing graphs Due in: Thursday 22nd March
Focus: Statistical Investigations
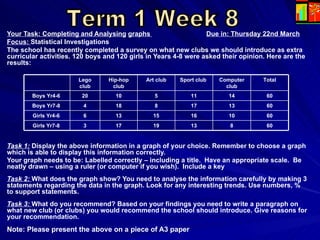
The school has recently completed a survey on what new clubs we should introduce as extra
curricular activities. 120 boys and 120 girls in Years 4-8 were asked their opinion. Here are the
results:
Lego Hip-hop Art club Sport club Computer Total
club club club
Boys Yr4-6 20 10 5 11 14 60
Boys Yr7-8 4 18 8 17 13 60
Girls Yr4-6 6 13 15 16 10 60
Girls Yr7-8 3 17 19 13 8 60
Task 1: Display the above information in a graph of your choice. Remember to choose a graph
which is able to display this information correctly.
Your graph needs to be: Labelled correctly – including a title. Have an appropriate scale. Be
neatly drawn – using a ruler (or computer if you wish). Include a key
Task 2: What does the graph show? You need to analyse the information carefully by making 3
statements regarding the data in the graph. Look for any interesting trends. Use numbers, %
to support statements.
Task 3: What do you recommend? Based on your findings you need to write a paragraph on
what new club (or clubs) you would recommend the school should introduce. Give reasons for
your recommendation.
Note: Please present the above on a piece of A3 paper