Sex differences in brain activation when viewing humor
•
1 recomendación•640 vistas

Activación cerebral en hombres y mujeres en cuanto al HUMOR
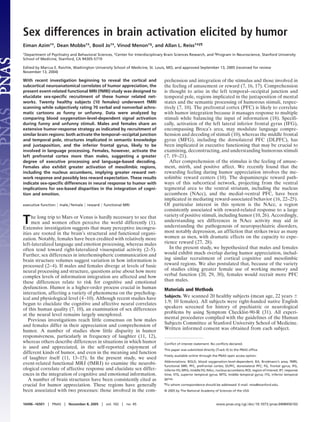
![Rating of Cartoons. Participants of similar age and background to
the subjects selected 42 of the funniest cartoons from a portfolio
of 130 cartoons, rating each cartoon for simplicity and visual
clarity. During the scan, 30 funny and 40 unfunny (12 funny and
2 unfunny cartoons were missing because of script error) were
presented. The majority of the cartoons were of the violationof-expectation type, and most were captioned.
Experimental Design. A more detailed description of experimental
design can be found elsewhere (10). Briefly, subjects were told
to respond with the press of a button if they found the cartoon
funny or not during the scan. Psyscope (32) was used to present
stimuli in an event-related fMRI paradigm, with each cartoon
presented in random order for 6,000 ms. A jittered interstimulus
interval (ISI) was used, varying among 2,000, 4,000, and 6,000 ms
and counterbalanced across the two stimulus types. Each full
session lasted 15 min and 4 s (Fig. 1a). After the scan, subjects
were asked to rank each cartoon they had found funny during the
scan on a 1-to-10 ‘‘funniness’’ scale. These subjective rankings
were later used to parametrically covary humor intensity with
associated linear changes in blood oxygenation-level-dependent
(BOLD) signal intensity. Time points (n frames) corresponding
to cartoon presentation were labeled with each subject’s corresponding ranking from 1 to 10. The n frames corresponding to
the ISI and jokes considered unfunny were scored as zero.
fMRI Acquisition. Images were acquired on a 3-T scanner (Signa,
General Electric) using a standard GE whole-head coil. The
scanner runs on an LX platform, with gradients in ‘‘MiniCRM’’
configuration (35 mT͞m, slew rate 190 mT per m͞s), and has a
3-T 80-cm magnet (Magnex). A custom-built head holder was
used to prevent head movement associated with laughter. To
maximize magnetic-field inhomogeneity, an automatic shim was
applied. Twenty-eight axial slices (4-mm thick, 0.5-mm skip)
parallel to the anterior–posterior commissure covering the
whole brain were imaged with a temporal resolution of 2 s using
a T2*-weighted gradient echo spiral pulse sequence (repetition
time ϭ 2,000 ms, echo time ϭ 30 ms, flip angle ϭ 80°, and 1
interleave) (33). The field of view was 200 ϫ 200 mm2, and the
matrix size was 64 ϫ 64, giving an in-plane spatial resolution of
3.125 mm.
Azim et al.
Statistical Analysis. Inverse Fourier transform was used to reconstruct images for each of the 450 n-frame time points into 64 ϫ
64 ϫ 18 image matrices (voxel size: 3.75 ϫ 3.75 ϫ 7 mm).
Statistical parametric mapping (SPM99, www.fil.ion.ucl.ac.uk͞
spm99.html) was used to preprocess all fMRI data, including
realignment, normalization to stereotaxic Talairach coordinates
(34), and smoothing. These methods are described in more detail
in ref. 10. Statistical parametric maps were first generated for
funny vs. unfunny stimuli for each subject by using a general
linear model. Second, random effects analysis was performed to
determine each subject’s voxel-wise activation (35, ʈ). For the
entire subject pool, significant clusters of activation were determined by using the joint expected probability distribution (36)
with height (P Ͻ 0.05) and extent (P Ͻ 0.05) thresholds corrected
at the whole-brain level. Region of interest (ROI) analysis was
performed by using group-wise activation clusters at the wholebrain level (10). The percentage of voxels in each cluster of
interest, with z Ͼ 1.96 (P Ͻ 0.05), was determined for each
contrast. An ␣ level for significance of P Ͻ 0.05 (two-tailed) was
used.
Results
Behavioral Performance. Males and females showed no significant
difference in the number of stimuli that they rated as funny
[t(17.531) ϭ Ϫ0.029, P Ͻ 0.977]. Of the 30 funny cartoons,
females found 82.33 Ϯ 23.68% funny, and males found 82.67 Ϯ
27.92%. After the scan, subjects ranked each stimulus that they
had classified as funny during the scan on a 1-to-10 Likert scale;
males and females showed no significant difference in how funny
they found the humorous stimuli [t(17) ϭ 0.895, P Ͻ 0.383].
Response time (RT) for both funny and unfunny cartoons (the
amount of time between the presentation of the cartoon and the
rating of the cartoon as funny or unfunny by the subject) was
equivalent between males and females [funny, t(17.99) ϭ 0.20,
P Ͻ 0.944; unfunny, t(16.22) ϭ Ϫ0.769, P Ͻ 0.453]. In addition,
within-sex analysis showed no significant difference in RT
between funny and unfunny cartoons for males [t(9) ϭ Ϫ0.20,
P Ͻ 0.984); funny mean RT, 3,802.40 Ϯ 498.02 ms; unfunny mean
RT, 3,806.41 Ϯ 814.83 ms]. However, female RT was significantly shorter for unfunny than funny cartoons [t(9) ϭ 2.949, P Ͻ
ʈHolmes,
A. P. & Friston, K. J. (1998) NeuroImage 7, S754 (abstr.).
PNAS ͉ November 8, 2005 ͉ vol. 102 ͉ no. 45 ͉ 16497
PSYCHOLOGY
Fig. 1. Event-related cartoon presentation and behavioral results. (a) Task design. Funny (I) and unfunny (II) stimuli were presented in an event-related
paradigm with each cartoon presented in random order for 6,000 ms. A jittered inter-stimulus interval (ISI) of 2,000, 4,000, and 6,000 ms was varied randomly
and counterbalanced across events (see Materials and Methods for more details). (b) Behavioral results. We found no between-sex differences in the number
of stimuli found funny [t(17.531) ϭ Ϫ0.029, P Ͻ 0.977], the subjective degree of funniness [t(17) ϭ 0.895, P Ͻ 0.383], or the response time (RT) to funny [t(17.99) ϭ
0.20, P Ͻ 0.944] or unfunny [t(16.22) ϭ Ϫ0.769, P Ͻ 0.453] stimuli. Males show no within-sex RT differences to funny and unfunny cartoons [t(9) ϭ Ϫ0.20, P Ͻ
0.984], whereas female RT is significantly shorter for unfunny stimuli [t(9) ϭ 2.949, P Ͻ 0.016]. Error bars indicate SD.](data:image/gif;base64,R0lGODlhAQABAIAAAAAAAP///yH5BAEAAAAALAAAAAABAAEAAAIBRAA7)
Recomendados
Más contenido relacionado
Destacado
Similar a Sex differences in brain activation when viewing humor
Similar a Sex differences in brain activation when viewing humor (20)
Más de UTPL
Más de UTPL (20)
Último
Último (20)
Sex differences in brain activation when viewing humor
- 1. Sex differences in brain activation elicited by humor Eiman Azim†‡, Dean Mobbs†‡, Booil Jo†‡, Vinod Menon†§, and Allan L. Reiss†‡§¶ †Department of Psychiatry and Behavioral Sciences, ‡Center for Interdisciplinary Brain Sciences Research, and §Program in Neuroscience, Stanford University School of Medicine, Stanford, CA 94305-5719 Edited by Marcus E. Raichle, Washington University School of Medicine, St. Louis, MO, and approved September 13, 2005 (received for review November 13, 2004) With recent investigation beginning to reveal the cortical and subcortical neuroanatomical correlates of humor appreciation, the present event-related functional MRI (fMRI) study was designed to elucidate sex-specific recruitment of these humor related networks. Twenty healthy subjects (10 females) underwent fMRI scanning while subjectively rating 70 verbal and nonverbal achromatic cartoons as funny or unfunny. Data were analyzed by comparing blood oxygenation-level-dependent signal activation during funny and unfunny stimuli. Males and females share an extensive humor-response strategy as indicated by recruitment of similar brain regions: both activate the temporal– occipital junction and temporal pole, structures implicated in semantic knowledge and juxtaposition, and the inferior frontal gyrus, likely to be involved in language processing. Females, however, activate the left prefrontal cortex more than males, suggesting a greater degree of executive processing and language-based decoding. Females also exhibit greater activation of mesolimbic regions, including the nucleus accumbens, implying greater reward network response and possibly less reward expectation. These results indicate sex-specific differences in neural response to humor with implications for sex-based disparities in the integration of cognition and emotion. executive function ͉ male͞female ͉ reward ͉ functional MRI T he long trip to Mars or Venus is hardly necessary to see that men and women often perceive the world differently (1). Extensive investigation suggests that many perceptive incongruities are rooted in the brain’s structural and functional organization. Notably, females have been credited with relatively more left-lateralized language and emotion processing, whereas males often tend toward right-lateralized visuospatial activity (2–5). Further, sex differences in interhemispheric communication and brain structure volumes suggest variation in how information is processed (2–4). If males and females diverge at levels of basic neural processing and structure, questions arise about how more complex levels of information integration are affected and how these differences relate to risk for cognitive and emotional dysfunction. Humor is a higher-order process crucial in human interaction, affecting a variety of phenomena on the psychological and physiological level (4–10). Although recent studies have begun to elucidate the cognitive and affective neural correlates of this human quality (7, 10), an examination of sex differences at the neural level remains largely unexplored. Previous investigations reach little consensus on how males and females differ in their appreciation and comprehension of humor. A number of studies show little disparity in humor responsiveness, particularly in frequency of laughter (11, 12), whereas others describe differences in situations in which humor is used and appreciated, in the self-reported enjoyment of different kinds of humor, and even in the meaning and function of laughter itself (11, 13–15). In the present study, we used event-related functional MRI (fMRI) to examine the neurobiological correlate of affective response and elucidate sex differences in the integration of cognitive and emotional information. A number of brain structures have been consistently cited as crucial for humor appreciation. These regions have generally been associated with two processes: those involved in the com16496 –16501 ͉ PNAS ͉ November 8, 2005 ͉ vol. 102 ͉ no. 45 prehension and integration of the stimulus and those involved in the feeling of amusement or reward (7, 16, 17). Comprehension is thought to arise in the left temporal–occipital junction and temporal pole, regions implicated in the juxtaposition of mental states and the semantic processing of humorous stimuli, respectively (7, 10). The prefrontal cortex (PFC) is likely to correlate with humor integration because it manages response to multiple stimuli while balancing the input of information (18). Specifically, activation of the left lateral inferior frontal gyrus (IFG), encompassing Broca’s area, may modulate language comprehension and decoding of stimuli (10), whereas the middle frontal gyrus (MFG), including the dorsolateral PFC (DLPFC), has been implicated in executive functioning that may be crucial to examining, deconstructing, and understanding humorous stimuli (7, 19–21). After comprehension of the stimulus is the feeling of amusement, mirth, and positive affect. We recently found that the rewarding feeling during humor appreciation involves the mesolimbic reward centers (10). The dopaminergic reward pathways of this subcortical network, projecting from the ventral tegmental area to the ventral striatum, including the nucleus accumbens (NAcc), and the medial–ventral PFC, have been implicated in mediating reward-associated behavior (16, 22–25). Of particular interest in this system is the NAcc, a region consistently associated with reward-related response to a large variety of positive stimuli, including humor (10, 26). Accordingly, understanding sex differences in NAcc activity may aid in understanding the pathogenesis of neuropsychiatric disorders, most notably depression, an affliction that strikes twice as many women as men, with dramatic effects on the capacity to experience reward (27, 28). In the present study, we hypothesized that males and females would exhibit much overlap during humor appreciation, including similar recruitment of cortical cognitive and mesolimbic reward regions. We also postulated that, because of the variety of studies citing greater female use of working memory and verbal function (20, 29, 30), females would recruit more PFC than males. Materials and Methods Subjects. We scanned 20 healthy subjects (mean age, 22 years Ϯ 1.9; 10 females). All subjects were right-handed native English speakers screened for history of psychiatric or neurological problems by using Symptom Checklist-90-R (31). All experimental procedures complied with the guidelines of the Human Subjects Committee at Stanford University School of Medicine. Written informed consent was obtained from each subject. Conflict of interest statement: No conflicts declared. This paper was submitted directly (Track II) to the PNAS office. Freely available online through the PNAS open access option. Abbreviations: BOLD, blood oxygenation-level-dependent; BA, Brodmann’s area; fMRI, functional MRI; PFC, prefrontal cortex; DLPFC, dorsolateral PFC; FG, frontal gyrus; IFG, inferior FG; MFG, middle FG; NAcc, nucleus accumbens; ROI, region of interest; RT, response time; STG, superior temporal gyrus; MTG, middle temporal gyrus; ITG, inferior temporal gyrus. ¶To whom correspondence should be addressed. E-mail: reiss@stanford.edu. © 2005 by The National Academy of Sciences of the USA www.pnas.org͞cgi͞doi͞10.1073͞pnas.0408456102
- 2. Rating of Cartoons. Participants of similar age and background to the subjects selected 42 of the funniest cartoons from a portfolio of 130 cartoons, rating each cartoon for simplicity and visual clarity. During the scan, 30 funny and 40 unfunny (12 funny and 2 unfunny cartoons were missing because of script error) were presented. The majority of the cartoons were of the violationof-expectation type, and most were captioned. Experimental Design. A more detailed description of experimental design can be found elsewhere (10). Briefly, subjects were told to respond with the press of a button if they found the cartoon funny or not during the scan. Psyscope (32) was used to present stimuli in an event-related fMRI paradigm, with each cartoon presented in random order for 6,000 ms. A jittered interstimulus interval (ISI) was used, varying among 2,000, 4,000, and 6,000 ms and counterbalanced across the two stimulus types. Each full session lasted 15 min and 4 s (Fig. 1a). After the scan, subjects were asked to rank each cartoon they had found funny during the scan on a 1-to-10 ‘‘funniness’’ scale. These subjective rankings were later used to parametrically covary humor intensity with associated linear changes in blood oxygenation-level-dependent (BOLD) signal intensity. Time points (n frames) corresponding to cartoon presentation were labeled with each subject’s corresponding ranking from 1 to 10. The n frames corresponding to the ISI and jokes considered unfunny were scored as zero. fMRI Acquisition. Images were acquired on a 3-T scanner (Signa, General Electric) using a standard GE whole-head coil. The scanner runs on an LX platform, with gradients in ‘‘MiniCRM’’ configuration (35 mT͞m, slew rate 190 mT per m͞s), and has a 3-T 80-cm magnet (Magnex). A custom-built head holder was used to prevent head movement associated with laughter. To maximize magnetic-field inhomogeneity, an automatic shim was applied. Twenty-eight axial slices (4-mm thick, 0.5-mm skip) parallel to the anterior–posterior commissure covering the whole brain were imaged with a temporal resolution of 2 s using a T2*-weighted gradient echo spiral pulse sequence (repetition time ϭ 2,000 ms, echo time ϭ 30 ms, flip angle ϭ 80°, and 1 interleave) (33). The field of view was 200 ϫ 200 mm2, and the matrix size was 64 ϫ 64, giving an in-plane spatial resolution of 3.125 mm. Azim et al. Statistical Analysis. Inverse Fourier transform was used to reconstruct images for each of the 450 n-frame time points into 64 ϫ 64 ϫ 18 image matrices (voxel size: 3.75 ϫ 3.75 ϫ 7 mm). Statistical parametric mapping (SPM99, www.fil.ion.ucl.ac.uk͞ spm99.html) was used to preprocess all fMRI data, including realignment, normalization to stereotaxic Talairach coordinates (34), and smoothing. These methods are described in more detail in ref. 10. Statistical parametric maps were first generated for funny vs. unfunny stimuli for each subject by using a general linear model. Second, random effects analysis was performed to determine each subject’s voxel-wise activation (35, ʈ). For the entire subject pool, significant clusters of activation were determined by using the joint expected probability distribution (36) with height (P Ͻ 0.05) and extent (P Ͻ 0.05) thresholds corrected at the whole-brain level. Region of interest (ROI) analysis was performed by using group-wise activation clusters at the wholebrain level (10). The percentage of voxels in each cluster of interest, with z Ͼ 1.96 (P Ͻ 0.05), was determined for each contrast. An ␣ level for significance of P Ͻ 0.05 (two-tailed) was used. Results Behavioral Performance. Males and females showed no significant difference in the number of stimuli that they rated as funny [t(17.531) ϭ Ϫ0.029, P Ͻ 0.977]. Of the 30 funny cartoons, females found 82.33 Ϯ 23.68% funny, and males found 82.67 Ϯ 27.92%. After the scan, subjects ranked each stimulus that they had classified as funny during the scan on a 1-to-10 Likert scale; males and females showed no significant difference in how funny they found the humorous stimuli [t(17) ϭ 0.895, P Ͻ 0.383]. Response time (RT) for both funny and unfunny cartoons (the amount of time between the presentation of the cartoon and the rating of the cartoon as funny or unfunny by the subject) was equivalent between males and females [funny, t(17.99) ϭ 0.20, P Ͻ 0.944; unfunny, t(16.22) ϭ Ϫ0.769, P Ͻ 0.453]. In addition, within-sex analysis showed no significant difference in RT between funny and unfunny cartoons for males [t(9) ϭ Ϫ0.20, P Ͻ 0.984); funny mean RT, 3,802.40 Ϯ 498.02 ms; unfunny mean RT, 3,806.41 Ϯ 814.83 ms]. However, female RT was significantly shorter for unfunny than funny cartoons [t(9) ϭ 2.949, P Ͻ ʈHolmes, A. P. & Friston, K. J. (1998) NeuroImage 7, S754 (abstr.). PNAS ͉ November 8, 2005 ͉ vol. 102 ͉ no. 45 ͉ 16497 PSYCHOLOGY Fig. 1. Event-related cartoon presentation and behavioral results. (a) Task design. Funny (I) and unfunny (II) stimuli were presented in an event-related paradigm with each cartoon presented in random order for 6,000 ms. A jittered inter-stimulus interval (ISI) of 2,000, 4,000, and 6,000 ms was varied randomly and counterbalanced across events (see Materials and Methods for more details). (b) Behavioral results. We found no between-sex differences in the number of stimuli found funny [t(17.531) ϭ Ϫ0.029, P Ͻ 0.977], the subjective degree of funniness [t(17) ϭ 0.895, P Ͻ 0.383], or the response time (RT) to funny [t(17.99) ϭ 0.20, P Ͻ 0.944] or unfunny [t(16.22) ϭ Ϫ0.769, P Ͻ 0.453] stimuli. Males show no within-sex RT differences to funny and unfunny cartoons [t(9) ϭ Ϫ0.20, P Ͻ 0.984], whereas female RT is significantly shorter for unfunny stimuli [t(9) ϭ 2.949, P Ͻ 0.016]. Error bars indicate SD.
- 3. Table 1. Voxel coordinates in Talairach space and associated z score showing BOLD activation by sex for funny cartoons vs. unfunny cartoons Regions Males (n ϭ 10) Left STG,* left MTG, left IFG Left ITG,* left FG Females (n ϭ 10) Left FG,* left ITG, left MTG Right NAcc,* left lenticular nucleus (putamen), Left IFG, left MFG, left DLPFC, left STG͞MTG Females Ϫ males Right NAcc,* right caudate nucleus, right IFG Left MFC,* left DLPFC, left IFG Left lenticular nucleus (putamen),* left IFG Males Ϫ females No significantly higher male activity BA P value 38͞21͞44 37͞19 Ͻ0.009 Ͻ0.015 19͞37͞21 44͞45͞46͞38 Cluster size, voxels Coordinates T score x y z 529 569 3.98 3.71 Ϫ51 Ϫ55 17 Ϫ60 Ϫ19 Ϫ3 Ͻ0.004 Ͻ0.0001 780 5,071 4.27 4.9 Ϫ44 8 Ϫ61 4 Ϫ12 Ϫ5 47 9͞45͞46͞47 45͞47 Ͻ0.0001 Ͻ0.001 Ͻ0.002 1,332 1,007 866 4.72 3.73 3.74 8 Ϫ44 Ϫ30 4 23 Ϫ15 Ϫ7 26 6 – – – – – Extent threshold ϭ P Ͻ 0.05 corrected for whole brain. Stereotaxic coordinates and BA correspond to Talairach–Tournoux atlas space. *Peak activation. 0.016; funny mean RT, 3847.55 ms Ϯ 512.49; unfunny mean RT, 3,563.68 Ϯ 577.22 ms] (Fig. 1b). fMRI Data. Male activation. In comparing BOLD signal during funny vs. unfunny stimuli at a threshold of P Ͻ 0.05 (corrected for the whole-brain analysis), males showed activation increases in the temporal pole, including the left superior temporal gyrus (STG) [Brodmann’s area (BA) 38; Talairach coordinates, Ϫ51, 17, Ϫ19] extending through the left middle temporal gyrus (MTG) and into the left IFG (BA 44). Activation also peaked in the temporal–occipital junction in proximity to the left inferior temporal gyrus (ITG) (BA 37; Ϫ55, Ϫ60, Ϫ3) and extending to the left fusiform gyrus (FG) (BA 19) (Table 1 and Fig. 2). Female activation. Females showed peak activation (P Ͻ 0.05) in the temporal–occipital junction, including the left FG (BA 19͞37; Ϫ44, Ϫ61, Ϫ12) spreading to the left ITG (BA 37) and the left MTG (BA 21). Another activation peak was seen at the right NAcc (8, 4, Ϫ5), extending to the left lenticular nucleus. Finally, activation was observed in the left IFG (BA 44͞45), spreading to the left MFG (BA 46) and the DLPFC, reaching the temporal pole (STG͞MTG) (BA 38) (Table 1 and Fig. 2). Sex differences. Subtracting female from male activation did not reveal any region where males have significantly higher BOLD signal. However, performing the opposite analysis showed significantly increased BOLD signal in females relative to males (P Ͻ 0.05). Specifically, a large peak was seen in the right NAcc (8, 4, Ϫ7), spreading to the left lenticular nucleus (putamen) and the left IFG (BA 45͞47). Female Ͼ male differences also peaked in the left MFG (BA 9͞46; Ϫ44, 23, 26), extending to the left DLPFC and left IFG (BA 45͞47) (Table 1 and Fig. 3). Time-series analysis in the NAcc and the DLPFC. To further characterize sex differences in NAcc response to humor, we isolated the caudal aspect of this structure as an a priori ROI. The coordinates, as specified by a whole-group contrast in our previous humor study (10), define a 10-voxel subcluster (peak stereotaxic coordinates, 6, 2, Ϫ4; P Ͻ 0.0001). By comparing activation in this ROI during funny and unfunny events, a posthoc time-series analysis of activation was created. Females appeared to robustly activate the NAcc during funny stimuli, whereas males had observable but low levels of activity. Furthermore, during unfunny events, females showed very little activity in the NAcc, whereas males demonstrated deactivation. We also isolated a 477-voxel cluster extending through the DLPFC as an a priori ROI for time-series analysis. This ROI was specified by performing a whole-group contrast (peak stereotaxic coordinates, 16498 ͉ www.pnas.org͞cgi͞doi͞10.1073͞pnas.0408456102 Ϫ44, 10, 28; P Ͻ 0.05). During funny events, females appeared to manifest more robust activation in this region, compared with males, whereas unfunny stimuli elicited similar (lower) responses across both groups (Fig. 3). We performed growth modeling to ascertain the statistical significance of sex differences observed in these time-series Fig. 2. BOLD signal activation for funny Ϫ unfunny cartoons. Clusters of activation were superimposed on a Talairach-normalized brain by using MRICRO software. Significance of activation was determined by using the joint expected probability distribution (36) with height (P Ͻ 0.05) and extent (P Ͻ 0.05) corrected for the whole brain. Males demonstrate cortical activation of the temporal– occipital junction (FG͞ITG) (BA 37), the temporal pole, and STG (BA 38), as well as the IFG (BA 44). Females show activation of the temporal– occipital junction (FG͞ITG) (BA 37), the temporal pole, and STG (BA 38), extending into the DLPFC, IFG, and MFG (BA 44͞45͞46), as well as subcortical dopaminergic reward regions, including the NAcc. Azim et al.
- 4. graphs. For each region by stimulus combination (NAcc–Funny, NAcc–Unfunny, DLPFC–Funny, DLPFC–Unfunny) a quadratic growth model was fitted by using the maximum likelihood estimation method. Free parameters in this model included fixed initial status, fixed linear slope, fixed quadratic slope, residual variances corresponding to the first eight time points, and sex effects on initial status, linear slope, and quadratic slope. Two alternative models were fitted for each region by stimulus combination. These alternative models differed only on whether sex was allowed to affect growth patterns. Models were formally compared based on the log-likelihood difference test. A likelihood ratio test based on sex differences in three factors (initial status, linear growth, quadratic growth) served as an omnibus test for overall model fit comparison. These analyses confirmed that there were significant sex differences for the NAcc–Funny, NAcc–Unfunny and DLPFC–Funny combinations (P Յ 0.001), but not for the DLPFC–Unfunny combination (P ϭ 0.95). Parametric analysis. To further elucidate NAcc activity, we performed a posthoc covariate analysis on the ROI (peak stereotaxic coordinates, 6, 2, Ϫ4; P Ͻ 0.0001), comparing humor intensity (as quantified by subjects’ degree of funniness rankings after the scan) and BOLD signal magnitude. Humor intensity was correlated with degree of NAcc activity in females but not in males. When the male activation map resulting from this covariate analysis was subtracted from the female activation map, a significantly higher female peak NAcc voxel intensity was observed [t(18) ϭ 4.702, P Ͻ 0.0005] (Fig. 4). Subtracting female from male activation demonstrated no significantly higher male covariance. response patterns shared by the sexes can inform our understanding of common neural processing strategies. Both sexes show activation in the left temporal–occipital junction (BA 37), with activation peaks in the left ITG and left FG. These regions, which participate in ‘‘ventral-stream’’ visual cortical processing, are considered crucial for semantic processing during the coherence component of joke comprehension (7, 37). Both sexes Discussion The present study confirms and builds on recent findings on the neural correlates of cognitive and affective components of humor appreciation. Because males and females recruit many of the same regions when presented with humorous stimuli, the Fig. 4. Female NAcc activation covarying with degree of humor intensity. Parametric analysis (see Materials and Methods) reveals NAcc activity (stereotaxic coordinates, 6, 2, Ϫ4; P Ͻ 0.0001) covarying with subjective rankings of humor intensity in females but not in males. Female Ϫ male comparison of NAcc activity shows significant increase in disparity as humor intensity increases [t(18) ϭ 4.702, P Ͻ 0.0005]. Azim et al. PNAS ͉ November 8, 2005 ͉ vol. 102 ͉ no. 45 ͉ 16499 PSYCHOLOGY Fig. 3. Female Ϫ male activation: time-series analysis of NAcc and DLPFC. Female Ϫ male comparison shows greater female activation in the DLPFC, IFG, and MFG (BA 45, 46, and 47), as well as the NAcc. Averaged time-series analysis for funny vs. unfunny activity in a 10-voxel subcluster of the NAcc (stereotaxic coordinates, 6, 2, Ϫ4; P Ͻ 0.0001) reveals strong female activation during funny stimuli and little activity during unfunny events. Males show low activation during funny stimuli and deactivation during unfunny events. A 477-voxel cluster extending through the DLPFC (peak stereotaxic coordinates, Ϫ44, 10, 28; P Ͻ 0.05) shows similar male and female response to unfunny stimuli and a noticeably more robust female response when they find the cartoon funny. Sex differences were significant for the NAcc–Funny, NAcc–Unfunny, DLPFC–Funny time-series curves (P Յ 0.001), but not for the DLPFC-Unfunny curves (P ϭ 0.95).
- 5. also exhibit activation in the temporal pole (BA 38), a region implicated in semantic knowledge and decoding (38, 39). The left temporal–occipital and temporal pole regions may participate in the detection of incongruity, suggesting a role in the juxtaposition of mental states and the maintenance of less probable word meanings during humor comprehension (7, 40). Males and females also share activation in the IFG at Broca’s area (BA 44). Predictably, the appreciation of cartoons (many of them with captions) recruits a region implicated in languagebased decoding and coherence development (21, 41). These results indicate a tendency by males and females to recruit a very similar coherence network when presented with funny stimuli, implying parallel cognitive correlates across sexes. Furthermore, between sexes, there is no significant difference in the number of cartoons found funny, the degree of funniness, or RT to stimuli, further suggesting that many aspects of humor response have universal characteristics. Yet, important between-sex differences also emerge, offering insight into disparate modes of humor processing. Females appear to recruit specific brain regions to a greater extent than males when presented with humorous stimuli. One of these regions is the left PFC, including the left IFG (BA 45͞47) and left MFG (BA 46), suggesting greater emphasis on language and executive processing in women. Females have been credited with dominance in language-based approaches to processing stimuli (29, 30), a finding consistent with reportedly larger volumes of Broca’s area (42) and the DLPFC (43) in women. Prior studies also have revealed greater left IFG activity in women during emotionally incongruous semantic processing, a cognitive paradigm analogous to reconciling the juxtaposed and emotioneliciting components of a humorous stimulus (44). Stronger female activation of the left PFC also suggests greater use of executive functions involved in coherence, potentially using working memory, mental shifting, verbal abstraction, self-directed attention, and irrelevance screening (17, 18). Of these, working memory is especially crucial during the temporary storage and manipulation of stimuli (20). The coherence stage of humor often requires a frame-shifting step involving the comparison of data from the stimulus stored in working memory to preexisting, long-term information (17). Thus, making sense of a funny stimulus, particularly in women, may be rooted in the ability of these left-lateralized executive processing regions to store, manipulate, and compare interdependent elements (19), perhaps specializing in positive emotion-eliciting stimuli such as humor (45). Averaged time-series ROI analysis of an isolated section of the DLPFC reveals more robust activation by females only during funny cartoons, further suggesting greater recruitment of executive functioning tools during the development of humor coherence (Fig. 3). Surprisingly, females also demonstrate more robust recruitment of mesolimbic reward regions at the right NAcc, suggesting greater reward network activity during humor response. This small brain region has been implicated in psychological reward, including situations of self-reported happiness, monetary reward receipt, the processing of attractive faces, and cocaine-induced euphoria (16, 23, 24, 46). Behavioral results from our study indicate that subjective levels of amusement are equivalent across the sexes, suggesting that differences in NAcc activation may have less to do with how funny the stimulus is considered and more to do with how it is processed. Because equivalent amusement seems to be processed differently, the patterns of activity observed here may provide compelling insight into sex-based differences in humor at the neural level. Our averaged time-series ROI results indicate that during funny stimuli, females show more robust activation of NAcc neurons than males. For unfunny stimuli, females show negligible activation of the NAcc, whereas males show deactivation (Fig. 3). Additionally, parametric analysis reveals an increase in female but not male 16500 ͉ www.pnas.org͞cgi͞doi͞10.1073͞pnas.0408456102 NAcc activity as humor intensity increases, and this between-sex disparity gets larger as the stimulus gets funnier (Fig. 4). These discrepancies may be explained by coding patterns found in groups of dopaminergic neurons, most stimulated by unpredictable rewards, neutral during fully predictable rewards, and negatively activated when expected rewards are removed (47). By recognizing the discrepancy between reward prediction and reward occurrence, these neurons code a ‘‘reward prediction error’’ that is used in behavior modification and learning. A global reinforcement signal about reward prediction is then communicated to neurons throughout the dopaminergic pathway (22). The correlation between unexpected reward and NAcc activation may be related to humor processing in that the more unexpected the ‘‘punch line,’’ the greater the activity in the network as it encodes prediction error. In the present experiment, females may expect the reward less, resulting in a large reward prediction error when the ‘‘punch line’’ arrives. As such, the greater the humor intensity, the larger the encoded prediction error. This pattern is reflected by more robust female NAcc activation during funny events as well as the correlation between NAcc activity and the perceived funniness of the reward (Figs. 3 and 4). Male reward anticipation, on the other hand, may lower unexpectedness and, thus, reduce prediction error during funny events. Male NAcc activity does not increase with perceived funniness, suggesting that, in males, increasing humor intensity does little to violate reward prediction and elicit error encoding (Figs. 3 and 4). Furthermore, if males anticipate reward more than females, unfunny events (equivalent to removal of the expected reward and a large error in prediction) would be expected to elicit deactivation of these NAcc neurons (47). This pattern is precisely what our ROI analysis reveals, with unfunny events producing deactivation in males and little to no activity in females (Fig. 3). Although discrepancy in NAcc activation between sexes at first glance seems to support findings that women often laugh and appreciate jokes more than men (15), these results suggest that the disparity may be the result of differences in reward expectancy rather than degree of amusement. Parametric analysis demonstrates that these patterns become more pronounced as funniness increases, suggesting that males and females use distinct reward-processing strategies that can be increasingly revealed with escalating reward intensity (Fig. 4). Additionally, although behavioral data indicate that males and females have similar latency as they respond to both stimulus conditions in this experiment, withingroup analysis shows that female RT is significantly shorter for unfunny stimuli relative to funny stimuli, whereas males spend the same amount of time reacting to both stimulus conditions. Reward prediction provides a compelling explanation for these behavioral patterns; if males expect reward from both types of stimuli, their processing strategy across conditions may be similar as they try to detect humor in funny and unfunny cartoons, whereas lack of female expectancy may allow them to quickly discern the unfunny stimulus from the more demanding funny stimulus. It is important to note that reward prediction coding is not specific to humor, and these discrepancies in NAcc activation and RT may be applicable across reward paradigms. Although reward coding provides an attractive model to explain sex differences, it also is possible that greater female NAcc activity during funny and unfunny events is a nonspecific discrepancy resulting from generally higher female activation, a necessary concern because no region showed greater male activity in this study. Future analysis should investigate whether the activity differences observed here are absent during nonreward-related tasks. Although there has been a tendency to discuss the two stages of coherence and amusement separately, this distinction should not be exaggerated. There is extensive evidence that cognitive and affective processes intersect and interact, particularly in the Azim et al.
- 6. PFC. This region, which houses much of the machinery for developing coherence, is innervated by a dopaminergic pathway originating in the ventral tegmental area, indicating that comprehension and amusement are most likely functionally connected (48, 49). This integration may be crucial for expectancy of emotional stimuli as well as reward-directed attention and behavior (50, 51). Thus, cognitive and affective pathways may have the ability to influence each other reciprocally, having an acute effect on humor response (52). Our findings on the interaction of these pathways may be of clinical import in explaining sex discrepancies in the frequency of mood disorders, particularly the fact that women are about twice as likely as men to experience clinical symptoms of depression (27, 28). It is reported that tasks demanding greater emotional processing tend to elicit less cognitive modulation and, thus, greater activation of the limbic system in women (53). It is conceivable that circumstances triggering emotional participation can exploit susceptibility to both positive and negative affect (54, 55). If female dopaminergic systems are more responsive to funny situations, emotionally stressful circumstances may elicit similar limbic sensitivity in the other direction. Results from this and other investigations of emotional response may help to inform We thank Gaurav Srivastava, Michael D. Greicius, and Amy Garrett for their assistance. This work was supported by National Institutes of Health Grants MH01142 (to A.L.R.) and HD40761 (to V.M.) and a Howard Hughes Summer Fellowship from the Department of Biological Sciences at Stanford University (to E.A.). 1. Gray, J. (1992) Men Are From Mars, Women Are From Venus (Thorsons͞Harper Collins, New York). 2. Nowicka, A. & Fersten, E. (2001) Cognit. Neurosci. Neuropsychol. 12, 4171– 4175. 3. Allen, L. S. & Gorski, R. A. (1991) J. Comp. Neurol. 312, 97–104. 4. Henman, L. D. (2001) Humor 14, 83–94. 5. Lefcourt, H. M., Davidson-Katz, K. & Kueneman, K. (1990) Humor 3, 305–321. 6. Nevo, O., Keiman, G. & Tesimovsky-Arditi, M. (1993) Humor 6, 71–88. 7. Goel, V. & Dolan, R. J. (2001) Nat. Neurosci. 4, 237–238. 8. Zand, J., Spreen, A. N. & LaValle, J. B. (1999) Smart Medicine for Healthier Living (Avery, Garden City Park, NY). 9. Fry, W. F., Jr. (1992) J. Am. Med. Assoc. 267, 1857–1858. 10. Mobbs, D., Greicius, M. D., Abdel-Azim, E., Menon, V. & Reiss, A. L. (2003) Neuron 40, 1041–1048. 11. Martin, R. A. & Kuiper, N. (1999) Humor 12, 355–384. 12. Nevo, O., Nevo, B. & Yin, J. L. (2001) J. Gen. Psychol. 128, 143–156. 13. Mundorf, N., Bhatia, A., Zillmann, D., Lester, P. & Robertson, S. (1988) Humor 1, 231–243. 14. Cox, J. A., Read, R. L. & Van Auken, P. M. (1990) Humor 3, 287–295. 15. Neitz, M. J. (1980) Psychiatry 43, 211–223. 16. Knutson, B., Adams, C. M., Fong, G. W. & Hommer, D. (2001) J. Neurosci. 21, RC159. 17. Coulson, S. & Kutas, M. (2001) Neurosci. Lett. 316, 71–74. 18. Shammi, P. & Stuss, D. T. (1999) Brain 122, 657–666. 19. Coulson, S. & Lovett, C. (2004) Cognit. Brain Res. 19, 275–288. 20. Speck, O., Ernst, T., Braun, J., Koch, C., Miller, E. & Chang, L. (2000) NeuroReport 11, 2581–2585. 21. Moran, J. M., Wig, G. S., Adams, R. B., Jr., Janata, P. & Kelley, W. M. (2004) NeuroImage 21, 1055–1060. 22. Schultz, W. (2002) Neuron 36, 241–263. 23. Breiter, H. C., Aharon, I., Kahneman, D., Dale, A. & Shizgal, P. (2001) Neuron 30, 619–639. 24. Breiter, H. C. & Rosen, B. R. (1999) Ann. N.Y. Acad. Sci. 877, 523–547. 25. Devous, M. D., Sr., Trivedi, M. H. & Rush, A. J. (2001) J. Nucl. Med. 42, 535–542. 26. Miyazaki, K., Mogi, E., Araki, N. & Matsumoto, G. (1998) NeuroReport 9, 3943–3948. 27. Nolen-Hoeksema, S. (1987) Psychol. Bull. 101, 259–282. 28. Weissman, M. M. & Klerman, G. L. (1977) Arch. Gen. Psychiatry 34, 98–111. 29. Shaywitz, B. A., Shaywitz, S. E., Pugh, K. R., Constable, R. T., Skudlarski, P., Fulbright, R. K., Bronen, R. A., Fletcher, J. M., Shankweiler, D. P., Katz, L., et al. (1995) Nature 373, 607–609. 30. Vikingstad, E. M., George, K. P., Johnson, A. F. & Cao, Y. (2000) Neurol. Sci. 175, 17–27. 31. Derogatis, L. R. (1977) SCL-90: Administration, Scoring, and Procedures Manual (Johns Hopkins Univ. Press, Baltimore). 32. Cohan, J. D., MacWhinney, B., Flatt, M. & Provost, J. (1993) Behav. Res. Methods Instrum. Comput. 25, 257–271. 33. Glover, G. H. & Lai, S. (1998) Magn. Reson. Med. 39, 361–368. 34. Talairach, J. & Tournoux, P. (1988) Co-Planar Stereotaxic Atlas of the Human Brain (Thieme, Stuttgart). 35. Friston, K. J., Holmes, A. P., Poline, J. B., Grasby, P. J., Williams, S. C., Frackowiak, R. S. & Turner, R. (1995) NeuroImage 2, 45–53. 36. Poline, J. B., Worsley, K. J., Evans, A. C. & Friston, K. J. (1997) NeuroImage 5, 83–96. 37. Ozawa, F., Matsuo, K., Kato, C., Nakai, T., Isoda, H., Takehara, Y., Moriya, T. & Sakahara, H. (2000) NeuroReport 11, 1141–1143. 38. Mummery, C. J., Patterson, K., Price, C. J., Ashburner, J., Frackowiak, R. S. & Hodges, J. R. (2000) Ann. Neurol. 47, 36–45. 39. Damasio, H., Grabowski, T. J., Tranel, D., Hichwa, R. D. & Damasio, A. R. (1996) Nature 380, 499–505. 40. Iwase, M., Ouchi, Y., Okada, H., Yokoyama, C., Nobezawa, S., Yoshikawa, E., Tsukada, H., Takeda, M., Yamashita, K. & Takeda, M., et al. (2002) NeuroImage 17, 758–768. 41. Price, C. J., Wise, R. J., Warburton, E. A., Moore, C. J., Howard, D., Patterson, K., Frackowiak, R. S. & Friston, K. J. (1996) Brain 119, 919–931. 42. Harasty, J., Double, K. L., Halliday, G. M., Kril, J. J. & McRitchie, D. A. (1997) Arch. Neurol. 54, 171–176. 43. Schlaepfer, T. E., Harris, G. J., Tien, A. Y., Peng, L., Lee, S. & Pearlson, G. D. (1995) Psychiatry Res. 61, 129–135. 44. Schirmer, A., Zysset, S., Kotz, S. A. & Yves von Cramon, D. (2004) NeuroImage 21, 1114–1123. 45. Rosencranz, M. A., Jackson, D. C., Dalton, K. M., Dolski, I., Ryff, C. D., Singer, B. H., Muller, D., Kalin, N. H. & Davidson, R. J. (2003) Proc. Natl. Acad. Sci. USA 100, 11148–11152. 46. Aharon, I., Etcoff, N., Ariely, D., Chabris, C. F., O’Connor, E. & Breiter, H. C. (2001) Neuron 32, 537–551. 47. Schultz, W., Tremblay, L. & Hollerman, J. R. (2000) Cereb. Cortex 10, 272–283. 48. Diekamp, B., Kalt, T. & Gunturkun, O. (2002) J. Neurosci. 22, 1–5. ¨ ¨ ¨ 49. Weinberger, D. R. (1993) J. Neuropsychiatry Clin. Neurosci. 5, 241–253. 50. Ueda, K., Okamoto, Y., Okada, G., Yamashita, H., Hori, T. & Yamawaki, S. (2003) NeuroReport 14, 51–55. 51. Gray, J. R., Braver, T. S. & Raichle, M. E. (2002) Proc. Natl. Acad. Sci. USA 99, 4115–4120. 52. Otto, J. H. (1994) Z. Exp. Angew. Psychol. 41, 232–260. 53. Hall, G. B. C., Witelson, S. F., Szechtman, H. & Nahmias, C. (2004) NeuroReport 15, 219–223. 54. Diener, E., Colvin, C. R., Pavot, W. G. & Allman, A. (1991) J. Pers. Soc. Psychol. 61, 492–503. 55. Fujita, F., Diener, E. & Sandvik, E. (1991) J. Pers. Soc. Psychol. 61, 427– 434. Azim et al. PNAS ͉ November 8, 2005 ͉ vol. 102 ͉ no. 45 ͉ 16501 PSYCHOLOGY the development of better diagnostic and therapeutic approaches to clinical depression. In summary, this study utilizes a fundamental human characteristic to uncover overlapping and divergent neural correlates of high-order processing. Importantly, the differences in neural activity observed in this study are independent of any measured between-sex behavioral differences. Equivalent subjective amusement seems to recruit divergent processing strategies that manifest equivalent behavior, indicating either that these differences in neural processing appear without behavioral correlate, or that our behavioral assays are insensitive to more subtle dissimilarities. The implications of our results for the appreciation of noncartoon humor across a broader age spectrum are open to future investigation. As fMRI analysis of humor progresses, examination of the role of specific brain regions can elucidate how the components of these networks interact and functionally connect, further revealing the neuroanatomical correlates of cognition, emotion, and sense of humor.