1. 4QFY2010 Result Update I Banking
May 05, 2010
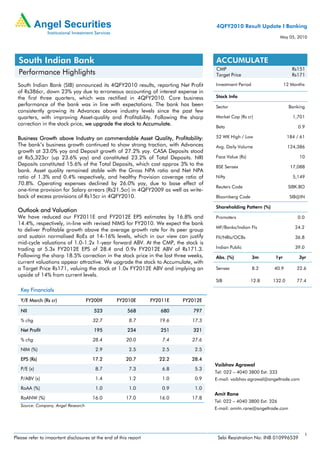
South Indian Bank ACCUMULATE
CMP Rs151
Performance Highlights Target Price Rs171
South Indian Bank (SIB) announced its 4QFY2010 results, reporting Net Profit Investment Period 12 Months
of Rs386cr, down 23% yoy due to erroneous accounting of interest expense in
the first three quarters, which was rectified in 4QFY2010. Core business Stock Info
performance of the bank was in line with expectations. The bank has been Sector Banking
consistently growing its Advances above industry levels since the past few
quarters, with improving Asset-quality and Profitability. Following the sharp Market Cap (Rs cr) 1,701
correction in the stock price, we upgrade the stock to Accumulate.
Beta 0.9
Business Growth above Industry on commendable Asset Quality, Profitability: 52 WK High / Low 184 / 61
The bank’s business growth continued to show strong traction, with Advances Avg. Daily Volume 124,386
growth at 33.0% yoy and Deposit growth of 27.2% yoy. CASA Deposits stood
at Rs5,323cr (up 23.6% yoy) and constituted 23.2% of Total Deposits. NRI Face Value (Rs) 10
Deposits constituted 15.6% of the Total Deposits, which cost approx 3% to the BSE Sensex 17,088
bank. Asset quality remained stable with the Gross NPA ratio and Net NPA
ratio of 1.3% and 0.4% respectively, and healthy Provision coverage ratio of Nifty 5,149
70.8%. Operating expenses declined by 26.0% yoy, due to base effect of
Reuters Code SIBK.BO
one-time provision for Salary arrears (Rs21.5cr) in 4QFY2009 as well as write-
back of excess provisions of Rs15cr in 4QFY2010. Bloomberg Code SIB@IN
Shareholding Pattern (%)
Outlook and Valuation
We have reduced our FY2011E and FY2012E EPS estimates by 16.8% and Promoters 0.0
14.4%, respectively, in-line with revised NIMS for FY2010. We expect the bank
MF/Banks/Indian FIs 24.2
to deliver Profitable growth above the average growth rate for its peer group
and sustain normalised RoEs at 14-16% levels, which in our view can justify FII/NRIs/OCBs 36.8
mid-cycle valuations of 1.0-1.2x 1-year forward ABV. At the CMP, the stock is
trading at 5.3x FY2012E EPS of 28.4 and 0.9x FY2012E ABV of Rs171.3. Indian Public 39.0
Following the sharp 18.5% correction in the stock price in the last three weeks, Abs. (%) 3m 1yr 3yr
current valuations appear attractive. We upgrade the stock to Accumulate, with
a Target Price Rs171, valuing the stock at 1.0x FY2012E ABV and implying an Sensex 8.2 40.9 22.6
upside of 14% from current levels.
SIB 12.8 132.0 77.4
Key Financials
Y/E March (Rs cr) FY2009 FY2010E FY2011E FY2012E
NII 523 568 680 797
% chg 32.7 8.7 19.6 17.3
Net Profit 195 234 251 321
% chg 28.4 20.0 7.4 27.6
NIM (%) 2.9 2.5 2.5 2.5
EPS (Rs) 17.2 20.7 22.2 28.4
Vaibhav Agrawal
P/E (x) 8.7 7.3 6.8 5.3
Tel: 022 – 4040 3800 Ext: 333
P/ABV (x) 1.4 1.2 1.0 0.9 E-mail: vaibhav.agrawal@angeltrade.com
RoAA (%) 1.0 1.0 0.9 1.0
Amit Rane
RoANW (%) 16.0 17.0 16.0 17.8
Tel: 022 – 4040 3800 Ext: 326
Source: Company, Angel Research
E-mail: amitn.rane@angeltrade.com
1
Please refer to important disclosures at the end of this report Sebi Registration No: INB 010996539
2. South Indian Bank I 4QFY2010 Result Update
Exhibit 1: 4QFY2010 Performance
Y/E March (Rs cr) 4QFY2010 3QFY2010 % chg 4QFY2009 % chg FY2010 FY2009 % chg
Interest Earned 514 488 5.3 473 8.6 1935.72 1686.93 14.7
Interest Expenses 435 316 37.6 325 33.8 1367.42 1164.03 17.5
Net Interest Income 79 172 (54.1) 148 (46.7) 568 523 8.7
Non-Interest Income 44 43 1.7 44 (1.0) 208.46 164.27 26.9
Total Income 123 215 (42.9) 192 (36.2) 777 687 13.0
Operating Expenses 71 97 (26.5) 96 (26.0) 366.18 328.48 11.5
Pre-Prov Profit 52 118 (56.3) 96 (46.3) 411 359 14.5
Provisions & Cont. (3) 19 (115.8) 14 (121.3) 43.27 57.3 (24.5)
PBT 55 99 (44.6) 82 (33.1) 367 301 21.9
Prov. for Taxes 16 36 (55.7) 31 (48.9) 133.55 106.62 25.3
PAT 39 62 (38.2) 50 (23.2) 234 195 20.0
EPS (Rs) 3.4 5.5 (38.2) 4.4 (23.2) 20.7 17.2 20.0
Cost to Income (%) 58.0 45.0 50.0 47.1 47.8
Effective Tax Rate (%) 29.4 36.7 38.5 36.4 35.4
Net NPA (%) 0.4 0.4 1.1 0.4 1.1
Source: Company, Angel Research
NII declined due to adjustment for Accounting Error
SIB had introduced a special deposit scheme (on the occasion of completion of 80
years of existence) in 4QFY2009, through which it raised Rs950cr of deposits at a
cost of 10.5%. The interest expenditure towards these deposit scheme was not
captured by the MIS of the bank during first three quarters of FY2010. The same was
rectified and accounted for in 4QFY2010, which resulted in a sharp increase in
interest expenditure on deposits. Accordingly, the bank had to debit the Rs75cr of
interest expenses on these deposits in first three quarters which was not accounted
and additional Rs25cr for the current quarter which resulted in NII being lower by
Rs100cr for the quarter. The NIMs of the bank in previous quarters have been
overstated as follows:
Exhibit 2: Reported Vs Actual NIMs
1QFY10 2QFY10 3QFY10 4QFY10
Reported NIM 3.11 3.12 3.09 2.77
Actual NIM 2.70 2.70 2.75 2.77
Source: Company, Angel Research
As a results, the actual NII recorded by the bank for FY2010 stood at Rs568cr
against our estimate of Rs674cr. The bank also had to pay lower taxes to that extent
in 4QFY2010. After factoring in the FY2010 numbers, we have reduced our
FY2011E and FY2012E estimates.
Exhibit 3: Change in Key Estimates
Old Revised
(Rs) FY2010 FY2011E FY2012E FY2010A FY2011E FY2012E
EPS 24.0 26.7 33.2 20.7 22.2 28.4
ABV 129.7 151.1 179.4 128.9 146.9 171.3
Source: Company, Angel Research
May 5, 2010 2
3. South Indian Bank I 4QFY2010 Result Update
Robust business growth continues
The bank’s business growth continued to register strong traction, with Advances
recording 33.0% yoy growth and Deposits growing 27.2% yoy. CASA Deposits stood
at Rs5,323cr (up 23.6% yoy) and constituted 23.2% of the Total Deposits. NRI
Deposits constituted 15.6% of Total Deposits, which approx cost 3% for the bank.
Key drivers for the growth in Advances included disbursals to the Power and
Infrastructure sectors, and the gold loan. Going ahead, the bank expects to focus
more on corporate lending and gold loans.
Exhibit 4: Trend in Business Growth
(Rs cr) (%)
25,000 14.0
12.0
20,000
10.0
15,000 8.0
10,000 6.0
4.0
5,000
2.0
- -
4QFY09 1QFY10 2QFY10 3QFY10 4QFY10
Advances (LHS) Deposits (LHS)
QoQ Advances Growth (RHS) QoQ Deposits Growth (RHS)
Source: Company, Angel Research
Asset quality stable
Gross and Net NPAs of the bank have been on a steady decline since 4QFY2009,
due to lower slippages and higher recoveries. In 4QFY2010 the bank’s Gross NPAs
remained flat sequentially at Rs211cr, however, the Gross NPA ratio declined to
1.3% in 4QFY2010 from 2.2% in 4QFY2009. The Net NPA ratio remained stable on
a sequential basis at 0.4%. The bank maintained a healthy provision coverage ratio
of 70.8%. The Gross slippages during FY2010 were stable at Rs174cr (Rs172cr in
FY2009). The slippages of the bank largely remained under control during FY2010
contrary to the rising trend in the industry. The reduction in Gross NPAs exceeded
additions on account of recoveries, upgrades and write-offs, which stood at Rs224cr
in FY2010. The restructured assets of the bank stood at Rs380cr (2.3% of Advances
and 25.6% of the Net Worth).
May 5, 2010 3
4. South Indian Bank I 4QFY2010 Result Update
Exhibit 5: Trend in Asset Quality
(%)
2.5 90.0
80.0
2.0 70.0
60.0
1.5
50.0
40.0
1.0
30.0
0.5 20.0
10.0
- -
2QFY09 3QFY09 4QFY09 1QFY10 2QFY10 3QFY10 4QFY10
NPA Coverage (RHS) Gross NPA (LHS) Net NPA (LHS)
Source: Company, Angel Research
Operating expenses decline due to base effect and write back of excess
provisions
Operating expenses declined by 26.0% yoy, due to one-time provision for Salary
arrears (Rs21.5cr) in 4QFY2009 and write-back of excess provisions of Rs15cr in
4QFY2010. Over the next year, the bank plans to add another 60 branches to the
current network of 580 branches. Going forward, the operating expenses of the
bank are expected to grow in the range of 12-13% over FY2011-12E, thereby
implying a sustainable cost-to-income ratio of 45% during this period.
Non-Interest Income disappointing
In 4QFY2010, Non-Interest Income of the bank remained flat sequentially at Rs44cr.
For FY2010, Non-Interest Income excluding Treasury Income increased by a
marginal 1.3%, while Treasury Income increased by 120% to Rs78cr resulting in
26.9% yoy growth in Total Non-Interest Income. Going forward, growth in Non-
Interest Income excluding Treasury Income is expected to be largely in-line with the
balance sheet growth. However, on account of lower Treasury gains, overall Non-
Interest Income is estimated to decline by 16.7% in FY2011E.
Capital Adequacy
As per Basel-II norms, the bank has a Capital Adequacy Ratio of 15.4%, with a Tier-I
capital of 12.4% at the end of 4QFY2010.
May 5, 2010 4
5. South Indian Bank I 4QFY2010 Result Update
Outlook and Valuation
We believe that SIB is one of the better-performing old private sector banks. Largely
concentrated in the semi-urban areas in the Southern states, the bank’s profitable,
cost-efficient and technologically up-to-date network of 580 branches constitutes a
reasonably attractive standalone franchise. The bank’s deposit franchise includes a
niche NRI customer base that contributes a meaningful 15.6% of total deposits and
gives it a distinct cost advantage over several of its peers.
We have reduced our FY2011E and FY2012E EPS estimates by 16.8% and 14.4%,
respectively, in-line with revised NIMS for FY2010. Going forward, we expect the
bank to deliver Profitable growth above the average growth rate for its peer group
and sustain normalised RoEs at 14-16% levels, which in our view can justify mid-
cycle valuations of 1.0-1.2x 1-year forward ABV. At the CMP, the stock is trading at
5.3x FY2012E EPS of 28.4 and 0.9x FY2012E ABV of Rs171.3. Following the sharp
18.5% correction in the stock price in the last three weeks, current valuations appear
attractive. We upgrade the stock to Accumulate, with a Target Price Rs171, valuing
the stock at 1.0x FY2012E ABV and implying an upside of 14% from current levels.
Exhibit 6: P/ABV Band – South Indian Bank
250
200
150
100
50
0
Apr-03
Apr-04
Apr-05
Apr-06
Apr-07
Apr-08
Apr-09
Apr-10
Mar-02
Jul-02
Dec-02
Aug-03
Dec-03
Aug-04
Dec-04
Aug-05
Dec-05
Aug-06
Dec-06
Aug-07
Dec-07
Aug-08
Dec-08
Aug-09
Dec-09
Price 0.3 0.6 0.9 1.2 1.5
Source: Company, Angel Research
May 5, 2010 5
6. South Indian Bank I 4QFY2010 Result Update
Income Statement (Rs cr) Ratio Analysis
Y/E March FY2009 FY2010E FY2011E FY2012E Y/E March FY2009 FY2010E FY2011E FY2012E
Net Interest Income 523 568 680 797 Profitability ratios (%)
YoY Growth (%) 32.7 8.7 19.6 17.3 NIMs 2.9 2.5 2.5 2.5
Other Income 164 209 174 207 Cost to Income ratio 47.8 47.1 48.9 48.2
YoY Growth (%) 15.2 26.9 (16.7) 19.4 RoA 1.0 1.0 0.9 1.0
Operating Income 687 777 853 1,004 RoE 16.0 17.0 16.0 17.8
YoY Growth (%) 28.0 13.0 9.8 17.7 B/S ratios (%)
Operating Expenses 328 366 417 484 CASA ratio 23.8 23.2 22.4 21.7
YoY Growth (%) 32.4 11.5 14.0 16.0 Credit/Deposit ratio 65.5 68.5 69.1 70.3
Pre - Provision Profit 359 411 436 520
CAR 13.9 15.3 13.2 11.7
YoY Growth (%) 24.3 14.5 6.1 19.3
- Tier I 12.4 13.7 11.8 10.5
Prov. & Cont. 57 43 55 34
Asset Quality (%)
YoY Growth (%) 0.7 (24.4) 27.8 (37.7)
Gross NPAs 2.2 1.3 1.1 0.9
Profit Before Tax 301 367 380 486
Net NPAs 1.1 0.4 0.3 0.2
YoY Growth (%) 30.0 21.9 3.6 27.6
Slippages 1.6 1.5 1.4 1.3
Prov. for Taxation 107 134 129 165
NPA prov. / avg.
0.1 0.2 0.1 0.1
as a % of PBT 35.4 36.4 34.0 34.0 assets
Provision coverage 48.4 70.2 72.7 74.1
PAT 195 234 251 321
Per Share Data (Rs)
YoY Growth (%) 28.4 20.0 7.4 27.6
EPS 17.2 20.7 22.2 28.4
ABVPS (75% Cover.) 107.6 128.9 146.9 171.3
DPS 3.0 4.0 4.0 5.0
Valuation Ratios
Balance Sheet (Rs cr)
P/E (x) 8.7 7.3 6.8 5.3
Y/E March FY2009 FY2010E FY2011E FY2012E
P/ABVPS (x) 1.4 1.2 1.0 0.9
Share Capital 113 113 113 113
Dividend Yield 2.0 2.7 2.7 3.3
Reserve & Surplus 1,191 1,372 1,570 1,825
DuPont Analysis
Deposits 18,092 23,012 27,154 32,042
NII 2.8 2.5 2.4 2.4
Growth (%) 19.4 27.2 18.0 18.0
Borrowings 257 331 390 461 (-) Prov. Exp. 0.3 0.2 0.2 0.1
Tier 2 Capital 155 197 233 275 Adj. NII 2.5 2.3 2.2 2.3
Other Liab. & Prov. 575 509 670 839 Treasury 0.2 0.3 0.1 0.1
Total Liabilities 20,384 25,534 30,130 35,554 Int. Sens. Inc. 2.7 2.6 2.3 2.4
Cash balances 998 1,151 1,358 1,602 Other Inc. 0.7 0.6 0.6 0.6
Bank balances 1,038 1,277 1,507 1,778
Op. Inc. 3.4 3.2 2.9 3.0
Investments 6,075 6,820 7,896 8,942
Opex 1.8 1.6 1.5 1.5
Advances 11,852 15,765 18,760 22,512
PBT 1.6 1.6 1.4 1.5
Growth (%) 13.4 33.0 19.0 20.0
Taxes 0.6 0.6 0.5 0.5
Fixed Assets 136 166 190 224
RoA 1.0 1.0 0.9 1.0
Other Assets 284 356 420 496
Total Assets 20,384 25,534 30,130 35,554 Leverage 15.4 16.7 17.8 18.2
Growth (%) 19.3 25.3 18.0 18.0 RoE 16.0 17.0 16.0 17.8
May 5, 2010 6
7. South Indian Bank I 4QFY2010 Result Update
Research Team Tel: 022-4040 3800 E-mail: research@angeltrade.com Website: www.angeltrade.com
DISCLAIMER
This document is solely for the personal information of the recipient, and must not be singularly used as the basis of any investment decision. Nothing in this
document should be construed as investment or financial advice. Each recipient of this document should make such investigations as they deem necessary to
arrive at an independent evaluation of an investment in the securities of the companies referred to in this document (including the merits and risks involved),
and should consult their own advisors to determine the merits and risks of such an investment.
Angel Securities Limited, its affiliates, directors, its proprietary trading and investment businesses may, from time to time, make investment decisions that are
inconsistent with or contradictory to the recommendations expressed herein. The views contained in this document are those of the analyst, and the company
may or may not subscribe to all the views expressed within.
Reports based on technical and derivative analysis center on studying charts of a stock's price movement, outstanding positions and trading volume, as
opposed to focusing on a company's fundamentals and, as such, may not match with a report on a company's fundamentals.
The information in this document has been printed on the basis of publicly available information, internal data and other reliable sources believed to be true,
and is for general guidance only. Angel Securities Limited has not independently verified all the information contained within this document. Accordingly, we
cannot testify, nor make any representation or warranty, express or implied, to the accuracy, contents or data contained within this document. While Angel
Securities Limited endeavours to update on a reasonable basis the information discussed in this material, there may be regulatory, compliance, or other
reasons that prevent us from doing so.
This document is being supplied to you solely for your information, and its contents, information or data may not be reproduced, redistributed or passed on,
directly or indirectly.
Angel Securities Limited and its affiliates may seek to provide or have engaged in providing corporate finance, investment banking or other advisory services
in a merger or specific transaction to the companies referred to in this report, as on the date of this report or in the past.
Neither Angel Securities Limited, nor its directors, employees or affiliates shall be liable for any loss or damage that may arise from or in connection with the
use of this information.
Note: Please refer to the important `Stock Holding Disclosure' report on the Angel website (Research Section).
Disclosure of Interest Statement South Indian Bank
1. Analyst ownership of the stock No
2. Angel and its Group companies ownership of the stock No
3. Angel and its Group companies’ Directors ownership of the stock No
4. Broking relationship with company covered No
Note: We have not considered any Exposure below Rs 1 lakh for Angel and its Group companies.
.
Address: Acme Plaza, ‘A’ Wing, 3rd Floor, M.V. Road, Opp. Sangam Cinema, Andheri (E), Mumbai - 400 059.
Tel : (022) 3952 4568 / 4040 3800
Angel Broking Ltd: BSE Sebi Regn No : INB 010996539 / CDSL Regn No: IN - DP - CDSL - 234 - 2004 / PMS Regn Code: PM/INP000001546 Angel Securities Ltd:BSE: INB010994639/INF010994639 NSE:
INB230994635/INF230994635 Membership numbers: BSE 028/NSE:09946
Angel Capital & Debt Market Ltd: INB 231279838 / NSE FNO: INF 231279838 / NSE Member code -12798 Angel Commodities Broking (P) Ltd: MCX Member ID: 12685 / FMC Regn No: MCX / TCM /
CORP / 0037 NCDEX : Member ID 00220 / FMC Regn No: NCDEX / TCM / CORP / 0302
May 5, 2010 7