PK14:Continental‐scale analysis of total soil biodiversity using molecular techniques
•
1 recomendación•333 vistas

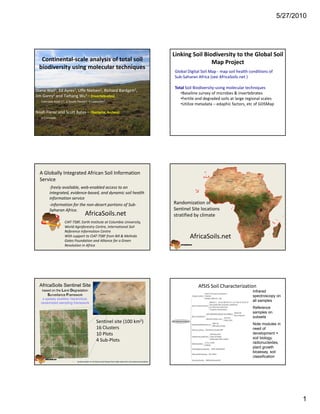
A presentation by Prof. Dian Wall: Linking Soil Biodiversity to the Global Soil Map Project

Recomendados
Recomendados
Más contenido relacionado
La actualidad más candente
La actualidad más candente (20)
Similar a PK14:Continental‐scale analysis of total soil biodiversity using molecular techniques
Similar a PK14:Continental‐scale analysis of total soil biodiversity using molecular techniques (20)
Más de CSM _BGBD biodiversity
Más de CSM _BGBD biodiversity (20)
Último
Último (20)
PK14:Continental‐scale analysis of total soil biodiversity using molecular techniques
- 1. 5/27/2010 Linking Soil Biodiversity to the Global Soil Continental‐scale analysis of total soil Map Project biodiversity using molecular techniques Global Digital Soil Map ‐ map soil health conditions of Sub‐Saharan Africa (see AfricaSoils.net ) Total Soil Biodiversity‐using molecular techniques Diana Wall1, Ed Ayres1, Uffe Nielsen1, Richard Bardgett2, , y , , g B li f i b &i t b t •Baseline survey of microbes & invertebrates Jim Garey3 and Tiehang Wu3 – (Invertebrates) •Fertile and degraded soils at large regional scales Colorado State U1, U South Florida2, U Lancaster3 •Utilize metadata – edaphic factors, etc of GDSMap Noah Fierer and Scott Bates – (Bacteria, Archea) U Colorado A Globally Integrated African Soil Information Service ‐freely available, web‐enabled access to an integrated, evidence‐based, and dynamic soil health information service ‐information for the non‐desert portions of Sub‐ Randomization of Saharan Africa. Sentinel Site locations l l AfricaSoils.net stratified by climate CIAT‐TSBF, Earth Institute at Columbia University, World Agroforestry Centre, International Soil Reference Information Centre With support to CIAT‐TSBF from Bill & Melinda Gates Foundation and Alliance for a Green AfricaSoils.net Revolution in Africa AfricaSoils Sentinel Site AfSIS Soil Characterization based on the Land Degradation • Infrared Surveillance Framework spectroscopy on a spatially stratified, hierarchical, all samples randomized sampling framework • Reference samples on subsets Sentinel site (100 km2) Sentinel site (100 km • Note modules in 16 Clusters need of 10 Plots development = soil biology, 4 Sub‐Plots radionucleides, plant growth bioassay, soil classification • randomization to minimize local biases that might arise from convenience sampling 1
- 2. 5/27/2010 Total Soil Biodiversity‐Why molecular sequencing? •Less than 1% microbes in soil are culturable •Invertebrate identification problematic for total biodiversity specialists, extraction methods and efficiencies, soil types Next generation of molecular techniques allow rapid processing (days vs years) •2 analyses from a composite sample provides all the sequence •2 analyses from a composite sample provides all the sequence data for microbes and invertebrates •Results provide >1000‐10K sequences per sample and all collected samples simultaneously •Our 200 samples include fertile and degraded soils covering a broad geographic scale •Numerous sequences will allow for intensive community analyses Soil Animals A sequenced based soil animal diversity approach Standardized Methods • Sampled at peak biomass, 4 plots on 1 km transect,0‐ 10cm • Bulked samples into ethanol, sieved, DNA extracted Measurements •Animals: molecular (18S rRNA gene clone •Animals: molecular (18S rRNA gene – clone libraries) & morphological analysis •NOT next generation ‐ so labor was intensive, time consuming and yielded far fewer sequences •Soils: physical, chemical & biological properties Wu et al., 2009, Soil Biol. Biochem. Some animals from DNA sequencing of a sample Sequence‐based Rarefaction of Taxonomic Richness 350 AB Kenya AR 300 Alaska Tundra BZ CR Sweden AB Alaska Forest DV 250 KY ed OTUs (Sobs) Kansas Sweden Forest KZ Costa Rica NZ 200 South Africa PU Nematoda Tardigrada Platyhelminthes Annelida RE NZ NZ Observe SA 150 1 0 TK Peru 100 50 Argentina Antarctic Dry Valleys 0 Collembola Acari Centipedes Spiders Gastrotricha Arthropoda 2
- 3. 5/27/2010 Arthropoda Nematoda Soil Animals Soil animal composition based Annelida Similar sequences for genera common to four or more sites Platyhelminthes on sequence Chordata Rotifera 18 Cnidaria Tardigrada Alaska ‐Bonanza (boreal forest) Gastrotricha 13 Other ‐Toolik (tundra) 25 Tundra Tundra Kansas Boreal ‐ Konza 20 Forest Boreal Forest Sweden 9 ‐ Reivo (boreal forest) 22 ‐ Abisko (tundra) Tallgrass Costa Rica Costa Rica New Zealand N Z l d Arid 14 Tropical Forest Grassland Peru 18 Kenya Tropical Temperate 4 11 Forest Mediterranean Forest Argentina Shrub Steppe South Africa 4 10 Cold Desert Antarctic Pyrosequencing DNA extracted from soil samples PCR amplification with group specific primers for SSU rRNA gene g Pyrosequencing gives ~1500 sequence per sample across many samples (>450,000 seq per run) Taxonomic Information AGCCTTAA… AGCCTTAA… AGCCTTAA… per sample GCTACCAT… CGGATCAC… GCTACCAT… CGGATCAC… GCTACCAT… CGGATCAC… CTCGATTC… CTCGATTC… CTCGATTC… Soils from 150 sites at peak of growing season Sequences aligned and inserted into a phylogenetic tree 3
- 4. 5/27/2010 Do bacterial communities vary across a single biome? Does Biome type determine pattern of Wolf Creek Fairbanks Noatak Toolik Dempster bacterial Taglu Island diversity ? Daring Lake Yamba Lake Aylmer Lake Artillery Lake Cambridge Bay Ramsay Lake Truelove Alexandra Fiord Bylot Island Circum‐Arctic Ci A i Bear Island Kuujjarapik Kangirsujjuaq Cape Tanfield heath tundra soils Kangirsuallujjuaq Torngat Mountains Svalbard Island Tropical forest Kangerlussuaq Skallovaara Kilpisjarvi village Temp. conif. forest Laxardalur Valley Abisko Lake Raudavatn Temp. decid. forest Non Metric Multidimensional Scaling Prairie Boreal forest Temp. grassland Tundra Lauber et al. 2009. Appl. Environ. Microbiol. Desert Mediterranean (Chu et al. In Press. Environ. Microbiol.) ‐ Arctic heath soils Vegetation Type Mean Annual Temperature Soil moisture deficit (PET‐MAP) % H2O C:N ratio pH Tropical forest Temp. conif. forest % silt + clay Temp. decid. forest Biome type means nothing to bacterial % organic C Prairie communities Boreal forest C mineralization rate Temp. grassland Tundra net N mineralization rate Chu et al. In Press. PNAS Desert Mediterranean pH is the best predictor for bacterial communities Vegetation Type pH explains ~70% of the MAT variablility Soil moisture deficit (PET‐MAP) % H2O C:N ratio pH % silt + clay % organic C C mineralization rate High pH Low net N mineralization rate Lauber et al. 2009. Appl. Environ. Microbiol., Fierer and Jackson. 2006. PNAS 4
- 5. 5/27/2010 Sequence data allows for detailed analysis of community The Belowground Biodiversity Project has shown: shifts • soil diversity is not the same everywhere • species and communities have biogeography • diversity decreases with land use change • certain groups or species are indicators The next generation pyrosequencing approach will extend the BGBD and GlobalSoilMap.net particularly extend the BGBD and GlobalSoilMap.net particularly for: Archaea Bacteria And together add to Total eukaryotic communities (fungi + invertebrates) Lauber et al. 2009. Appl. Environ. Microbiol. Soil animal biodiversity Figure 4. “Genera richness” (97% OTUs) observed at four or more sites. Nematode families 18 Alaska ‐Bonanza (boreal forest) 100 13 ‐Toolik (tundra) Everything is NOT 25 everywhere? Kansas ‐ Konza 20 ccurrence Sweden 9 ‐ Reivo (boreal forest) 22 ‐ Abisko (tundra) 50 Costa Rica Costa Rica New Zealand N Z l d % oc 14 Peru 18 Kenya 11 4 Argentina 0 South Africa 4 10 Nematode family Antarctic p 120 Molecular 100 Morphological r2=0.52 Relative abundance (%) 80 60 40 20 0 Soils collected from >100 sites at peak of plant growing season Figure 9b. Relative abundance (%) of arthropods at each SA AB AR BZ CR DV KY KZ NZ PU RE TK location using molecular and morphological methods. Locations Fierer and Jackson. 2006. PNAS. Lauber et al. 2009. Appl. Environ. Microbiol. 5