DRTV Still Works & Digital Advertising is Making it Better [INFOGRAPHIC]
•
2 recomendaciones•821 vistas

With the rise of time-shifted TV and the consumption of shows on-line, is TV advertising becoming less relevant? At BKV, we know this is definitely not the case. In fact, TV advertising is alive and well and spending is growing each year! TV also remains the highest reach medium and is the most influential advertising medium when making a purchase decision. While TV advertising is still very relevant, the ad environment has without a doubt grown more complicated. That’s where BKV comes in! Our DRTV advertising experts are here to help clear up the confusion and have provided this Infographic as a guide to the current TV advertising landscape, plus more information on the newest technologies in the space.
Recomendados

Recomendados
Más contenido relacionado
Último
Último (20)
Destacado
Destacado (20)
DRTV Still Works & Digital Advertising is Making it Better [INFOGRAPHIC]
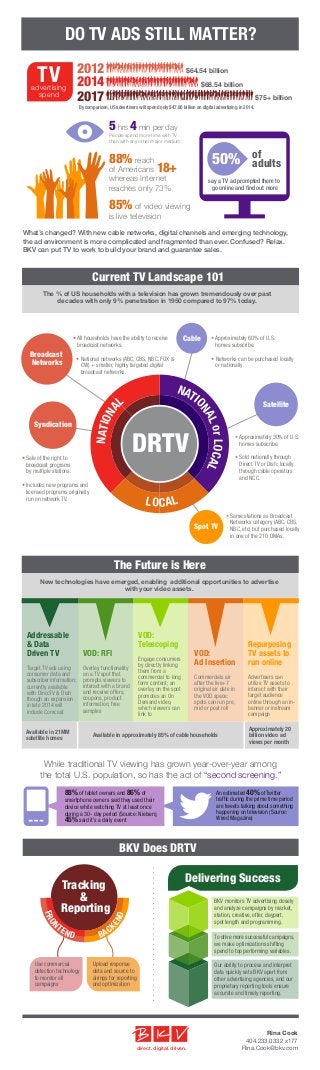
- 1. TVadvertising spend $64.54 billion $68.54 billion $75+ billion DO TV ADS STILL MATTER? Cable Satellite Spot TV Syndication Broadcast Networks NATIONA L NATIO NALorLOCAL LOCAL DRTV 2012 2014 2017 Current TV Landscape 101 BKV Does DRTV Delivering Success Rina Cook 404.233.0332 x177 Rina.Cook@bkv.com FRON TEND BAC KEND Tracking & Reporting Use commercial detection technology to monitor all campaigns Upload response data and source to airings for reporting and optimization By comparison, US advertisers will spend only $47.80 billion on digital advertising in 2014. direct. digital. driven.direct. digital. driven. What’s changed? With new cable networks, digital channels and emerging technology, the ad environment is more complicated and fragmented than ever. Confused? Relax. BKV can put TV to work to build your brand and guarantee sales. The % of US households with a television has grown tremendously over past decades with only 9% penetration in 1950 compared to 97% today. • National networks (ABC, CBS, NBC, FOX & CW) + smaller, highly targeted digital broadcast networks. • All households have the ability to receive broadcast networks. • Includes new programs and licensed programs originally run on network TV. • Sale of the right to broadcast programs by multiple stations. • Same stations as Broadcast Networks category (ABC, CBS, NBC, etc) but purchased locally in one of the 210 DMAs. • Approximately 60% of U.S. homes subscribe. • Networks can be purchased locally or nationally. • Sold nationally through Direct TV or Dish; locally through cable operators and NCC. • Approximately 30% of U.S. homes subscribe. BKV monitors TV advertising closely and analyze campaigns by market, station, creative, offer, daypart, spot length and programming. Our ability to process and interpret data quickly sets BKV apart from other advertising agencies, and our proprietary reporting tools ensure accurate and timely reporting. To drive more successful campaigns, we make optimizations shifting spend to top performing variables. The Future is Here New technologies have emerged, enabling additional opportunities to advertise with your video assets. Addressable & Data Driven TV Target TV ads using consumer data and subscriber information; currently available with DirecTV & Dish though an expansion in late 2014 will include Comcast VOD: RFI Overlay functionality on a TV spot that prompts viewers to interact with a brand and receive offers, coupons, product information, free samples VOD: Telescoping Engage consumers by directly linking them from a commercial to long form content; an overlay on the spot promotes an On Demand video, which viewers can link to VOD: Ad Insertion Commercials air after the live+7 original air date in the VOD space; spots can run pre, mid or post roll Repurposing TV assets to run online Advertisers can utilize TV assets to interact with their target audience online through an in- banner or instream campaign 5hrs 4min per day People spend more time with TV than with any other major medium 50% of adults say a TV ad prompted them to go online and find out more Available in approximately 85% of cable households Approximately 20 billion video ad views per month Available in 21MM satellite homes 88% reach of Americans 18+ whereas Internet reaches only 73% 85% of video viewing is live television 88% of tablet owners and 86% of smartphone owners said they used their device while watching TV at least once during a 30- day period (Source: Nielsen); 45% said it’s a daily event An estimated 40% of Twitter traffic during the prime time period are tweets talking about something happening on television (Source: Wired Magazine) While traditional TV viewing has grown year-over-year among the total U.S. population, so has the act of “second screening.”