DIABETES IN PREGNANCY AMONG FIRST NATIONS WOMEN IN ALBERTA: A MULTIPHASE MIXED METHODS APPROACH
1. DIABETES IN PREGNANCY AMONG FIRST NATIONS WOMEN IN
ALBERTA: A MULTIPHASE MIXED METHODS APPROACH
Women without diabetes (n = 407,855)
It is believed that a complex combination of social, cultural,
environmental and genetic factors have led to Canadian First Nations
populations suffering type 2 diabetes rates that are reportedly 2-5 times
higher than the non-First Nations population (1, 2), with First Nations
women being excessively affected (3). In attempts to understand the
causes of this epidemic, the possible contribution of diabetes in
pregnancy, particularly gestational diabetes mellitus (GDM), has received
recent attention. In First Nations populations, it is suggested that
diabetes in pregnancy contributes to a vicious cycle by increasing the
risk of type 2 diabetes in both offspring and mothers (4). Driving this
cycle is increasing obesity prevalence in the younger age groups,
coupled with a decrease in the average age of diabetes diagnosis among
First Nations individuals (3, 5). Moreover, fertility/birth rates are 1.5-2
times that of the non-First Nations population (6). Hence, pregnancy may
be a crucial point for interventions and appropriate healthcare aimed at
ultimately reducing type 2 diabetes rates in First Nations peoples. Yet,
the extent of the problem has not been well explored nor addressed. The
epidemiology needs to be better characterized, and the cultural, physical
and social environment in which these women live has to be considered.
This poster provides an overview of my (R.T.O.) doctoral research that
was part of a larger mixed methods plan aimed at examining diabetes in
pregnancy among Aboriginal women, with the ultimate goal of developing
interventions that can effectively improve care for diabetes in pregnancy.
A multiphase mixed methods research approach is being utilized (7),
whereby this thesis encompassed the initial two phases that were
concurrent and incremental.
STUDY 1
Objective
To use administrative data from the Alberta Perinatal Health Program
(APHP) and Alberta Health & Wellness (AHW) to generate an
epidemiological profile of First Nations diabetes in pregnancy.
Methods
A longitudinal retrospective observational study design was utilized.
Briefly, de-identified data from all delivery records of adult women were
obtained from the APHP for the years 2000-2009, and First Nations
women were identified by AHW. Pregestational, past obstetrical, and
delivery outcomes and problems were described and compared via ttests and chi-square tests. Annual crude and age-adjusted (direct
method) rates of diabetes in pregnancy by ethnicity were calculated and
compared via chi-square analysis. Longitudinal changes in prevalence
over time were computed and compared via Average Annual Percent
Change (AAPC) analysis. The predictors of diabetes in pregnancy were
explored via logistic regression analyses.
Results
Between 2000-2009 there were 433,445 pregnancies in Alberta.
Diabetes category was missing for some records (n = 6,387), thus
427,058 pregnancy records were explored, of which 28,306 (6.6%) were
First Nations women.
In general, First Nations women tended to have more risk factors and
poorer outcomes than non-First Nations (Table 1). The majority of these
differences by ethnicity persisted when comparing only those
pregnancies affected by diabetes. Among First Nations women alone,
those with diabetes tended to have more pregnancy risk factors and
poorer outcomes. As opposed to those women with GDM, those with
pregestational diabetes were more likely to have antenatal risk factors
and adverse infant outcomes (data not shown).
First Nations
(n = 26,793)
Non-First Nations
(n = 381,092)
24.7 (5.8)
8.1% (7.8-8.4)
6.9% (6.6-7.2)
51.8% (51.2-52.4)
0.4% (0.4-0.5)
10.8% (10.5-11.2)
0.9% (0.8-1.0)
0.1% (0.0-0.1)
First Nations
(n = 1,513)
Non-First Nations
(n = 17,660)
28.7 (5.5)†
1.2% (1.2-1.3)†
15.2% (15.0-15.3)†
15.9 (15.8-16.0)†
0.6% (0.5-0.6)†
8.0% (7.9-8.1)†
0.9% (0.9-1.0)
0.1% (0.0-0.1)
28.9 (6.2)
2.7% (3.3-5.6)
20.0% (17.9-22.1)
52.5% (49.9-55.0)
0.7% (0.3-1.2)
31.7% (29.3-34.1)
4.2% (3.3-5.4)
0.3% (0.1-0.8)
31.6 (5.3)‡
0.2% (0.2-0.3)‡
30.0% (29.4-30.7)‡
11.4% (10.9-11.9)‡
0.7% (0.6-0.8)
18.4% (17.9-19.0)‡
3.3% (3.0-3.5)‡
0.1% (0.0-0.2)‡
Past obstetrical
Parity
Preterm
Neonatal death
Stillbirth
Abortion
Cesarean section
SGA
LGA
Major fetal anomaly
1.7 (1.9)
8.3% (7.9-8.7)
1.0% (0.9-1.1)
1.9% (1.7-2.0)
7.3% (6.9-7.6)
11.6% (11.2-11.9)
0.7% (0.6-0.8)
1.6% (1.4-1.74
0.8% (0.7-0.9)
0.9 (1.1)†
4.8% (4.7-4.9)†
0.5% (0.5-0.6)†
0.9% (0.8-0.9)†
4.9% (4.9-5.0)†
12.2% (12.1-12.3)†
0.7 % (0.6-0.7)
1.0% (1.00-1.1)†
0.6% (0.5-0.6)†
2.2 (2.1)
12.8% (11.0-14.8)
1.7% (1.1-2.4)
5.0% (3.9-6.2)
9.1% (7.7-10.6)
20.2% (18.2-22.3)
0.3% (0.1-0.7)
6.9% (5.7-8.3)
1.1% (0.7-1.8)
1.1 (1.4)‡
7.9% (7.3-8.4)‡
0.9% (0.8-1.1)‡
2.2% (2.0-2.4)‡
6.0% (5.7-6.4)‡
18.9% (18.3-19.8)
0.7% (0.6-0.9)‡
3.0% (2.7-3.2)‡
0.8% (0.7-1.0)
2.9% (2.7-3.1)
4.4% (4.2-4.7)
2.4% (2.2-2.6)
1.2% (1.0-1.3)
2.3% (2.1-2.5)
13.8% (13.4-14.3)
54.7% (54.1-55.3)
0.9% (0.8-1.1)
9.5% (9.2-9.9)
6.6% (6.3-6.9)
2.9 (2.7)
10.4% (10.1-10.8)
3.4% (3.3-3.4)†
5.7% (5.6-5.7)†
1.9% (1.9-2.0)†
1.5% (1.4-1.5)†
0.6% (0.5-0.6)†
14.4% (14.3-14.6)†
17.0% (16.9-17.2)†
0.1% (0.0-0.1)†
1.6% (1.5-1.6)†
0.9% (0.8-0.9)†
2.1 (2.2)†
5.1% (5.1-5.2)†
3.5% (2.6-4.6)
8.1% (6.7-9.7)
5.6% (4.5-6.9)
1.5% (0.9-2.2)
1.3% (0.8-2.0)
5.1% (4.1-6.3)
49.4% (46.8-51.9)
0.6% (0.3-1.2)
7.2% (5.9-8.6)
3.5% (2.6-4.6)
5.6 (3.6)
30.7% (28.4-33.1)
3.9% (3.6-4.3)
12.2% (11.7-12.7)
3.9% (3.9-4.2)‡
2.2% (2.0-2.5)‡
0.5% (0.4-0.7)‡
4.3% (4.1-4.7)
14.3% (13.8-14.8)‡
0.1% (0.0-0.1)‡
0.9% (0.8-1.04)‡
0.4% (0.3-0.5)‡
4.4 (3.0)‡
19.8% (19.2-2.4)‡
Current pregnancy
Multiple pregnancy
PIH
Proteinuria
Insufficient weight gain
Anemia
Pregnancy ≥ 41 weeks
Smoker
Alcohol ≥ 1 drink/day
Alcohol ≥ 3 drinks ever
Drug dependant
Antepartum risk score
Antepartum risk ≥ 7
Labour and newborn
outcomes
Induction of labour
APGAR 1 min
APGAR 5 min
Birth weight (g)
LBW
HBW
Gestational age (m)
Breastfeeding
Preterm
Stillbirth
NICU admission
Congenital anomaly
Cesarean section
Vaginal breech
10
First Nations
Non First Nations
A
8
7
6
5
4
3
2
23.8% (23.1-24.3)
7.8 (2.0)
8.9 (1.4)
3411.5 (706.0)
8.0% (7.6-8.3)
16.7% (16.3-17.2)
38.5 (2.7)
71.2% (70.5-72.8)
9.2% (8.9-9.6)
1.2% (1.1-1.3)
8.6% (8.3-9.0)
1.8% (1.6-2.0)
19.1% (18.6-19.5)
0.9% (0.8-1.0)
†
27.3% (27.1-27.4)
7.9 (1.7)†
8.8 (1.1)†
3338.5 (620.8)†
7.1% (7.0-7.2)†
11.1% (10.9-11.1)†
38.7 (2.4)†
88.3% (88.2-88.6)†
8.8% (8.7-8.9)†
0.7% (0.6-0.7)†
11.2% (11.1-11.3)†
1.5% (1.4-1.5)†
25.5% (25.4-25.6)†
0.6% (0.5-0.6)†
41.7% (39.2-44.2)
7.5 (2.1)
8.6 (1.6)
3577.5 (805.4)
7.2% (6.0-8.6)
29.3% (27.0-31.6)
37.8 (2.6)
74.7% (69.3-79.6)
17.3% (15.4-19.3)
2.1% (1.5-2.9)
16.7% (14.8-15.7)
1.4% (0.8-2.3)
35.4% (33.0-37.8)
0.9% (0.5-1.5)
Significant difference (p < 0.05) between First Nations without diabetes and First Nations with diabetes
† Significant difference (p < 0.05) between First Nations and non-First Nations without diabetes
‡ Significant difference (p < 0.05) between First Nations and non-First Nations with diabetes
40.9% (40.2-41.7)
7.8 (1.9)‡
8.8 (1.1)‡
3326.8 (65.1)‡
8.6% (8.2-9.0)
12.9% (12.4-13.4)‡
38.0 (2.1)‡
86.3% (85.4-87.1)‡
14.7% (14.2-15.3)‡
0.6% (0.5-0.8)‡
19.4% (18.8-20.0)‡
1.7% (1.5-2.1)
39.8% (39.0-40.9)‡
0.4% (0.3-0.5)‡
0
First Nations
Non-First Nations
Rate
ratio*
p-value
4.3%
(4.26-4.38)
4.9%
(4.16-4.63)
1.0%
(1.01-1.03)
1.1%
(0.76-1.49)
3.8%
(3.77-3.89)
4.8%
(4.60-4.98)
0.6%
(0.58-0.62)
0.7%
(0.60-0.75)
6.1%
(5.99-6.13)
6.9%
(6.79-6.94)
1.5%
(1.43-1.50)
1.4%
(1.33-1.39)
3.8%
(3.74-3.85)
4.6%
(4.58-4.70)
0.6%
(0.57-0.62)
0.7%
(0.64-0.71)
1.1
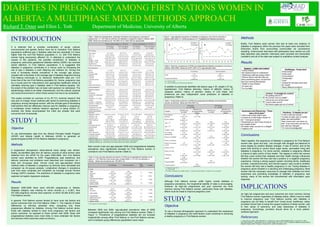
GDM (2009)
Pregestational
diabetes (all years)
Pregestational
diabetes (2009)
20
15
10
2000
2001
2002
2003
2004
2005
2006
2007
2008
2009
2000
2001
2002
2003
2004
2005
2006
2007
2008
2009
Table 3. Ethnicity comparisons of GDM and pregestational diabetes prevalence over time in
Alberta, 2000-2009. Values are AAPC (95% CI) in age-adjusted rates.
First Nations
1.51
(-2.04-5.20)
1.55
(-4.68-8.19)
GDM
Pregestational diabetes
Non-First Nations
4.48*†
(2.88-6.11)
1.35
(-0.38-3.12)
p < 0.05 for AAPC
† p < 0.05 for difference in AAPC between ethnicities
In addition to previously identified risk factors (age ≥ 35, weight ≥ 91 kg,
hypertension, First Nations ethnicity), history of stillbirth, history of
cesarean section, history of abortion, history of LGA infant, and
proteinuria are also independent novel predictors of diabetes in
pregnancy (Table 4).
1.0
0.861
1.7
First Nations
ethnicity
Rural residence
Age ≤ 17
Age ≥ 35
Weight ≥ 91 kg
Pre-existing
hypertension
History of stillbirth
History of cesarean
section
History of SGA
History of LGA
Smoker
Drug dependant
Alcohol anytime‡
All women
(n = 427,058)
OR (95% CI)
OR (95% CI)
for pregestational
for GDM
diabetes
1.47
1.73
†
(1.38-1.57)
(1.52-1.96)
0.69
-(0.66-0.73)†
0.35
0.29
†
(0.28-0.45)
(0.16-0.52)†
2.34
1.57
†
(2.26-2.42)
(1.43-1.72)†
2.51
2.31
†
(2.40-2.61)
(2.10-2.54)†
1.63
4.45
†
(1.45-1.84)
(3.82-5.43)†
1.96
2.56
†
(1.75-2.18)
(2.07-3.18)†
1.42
-(1.23-1.64)†
1.37
1.76
†
(1.32-1.43)
(1.61-1.94)†
0.53
-(0.29-0.96)†
2.79
-(2.31-3.39)†
1.61
2.62
†
(1.48-1.76)
(2.23-3.08)†
0.90
-(0.86-0.94)†
0.51
-(0.41-0.63)†
0.68
-(0.50-0.93)†
First Nations
(n = 28,306)
OR (95% CI)
OR (95% CI)
for pregestational
for GDM
diabetes
--
--
--
--
0.48
(0.34-0.67)†
2.81
(2.41-3.27)†
2.93
(2.56-3.33)†
1.40
(1.20-1.63)†
0.42
(0.18-0.94)†
2.23
(1.64-3.02)†
3.25
(2.52-4.18)†
5.09
(3.03-8.58)†
3.05
(1.93-4.81)†
1.58
(1.11-2.25)†
1.88
(1.41-2.47)†
--
--
2.58
(1.99-3.35)†
1.85
(1.40-2.44)†
3.23
(2.10-4.97)†
2.05
(1.26-3.32)†
--
--
0.54
(0.39-0.74)†
--
--
--
-1.76
(1.30-2.38)†
--
< 0.001
1.6
< 0.001
1.6
< 0.001
1.5
< 0.001
2.0
< 0.001
Conclusions
Although First Nations women suffer higher overall diabetes in
pregnancy prevalence, the longitudinal stability of rates is encouraging.
However, as high-risk pregnancies and poor outcomes are more
common among First Nations women, particularly those with diabetes,
efforts must be made to improve pregnancy care.
< 0.001
2.5
* First Nations-to-non-First Nations
Between 2000 and 2009, age-adjusted prevalence rates of GDM
increased significantly only among non-First Nations women (Table 3,
Figure 1). Prevalence of pregestational diabetes did not increase
longitudinally among either First Nations or non-First Nations women,
and no between group differences (parallelism) were noted.
Briefly, First Nations adult women that had at least one instance of
diabetes in pregnancy within the previous five years were recruited from
Edmonton and/or from surrounding communities via convenience
sampling. Unstructured interviews with participants were carried out until
data saturation was reached. Interviews were recorded and transcribed
(verbatim) and all of the data was subject to qualitative content analysis.
Results
Support: “I didn’t do it alone”
“Family helped”
“My husband tried to understand”
“Healthcare staff was always there”
“Women like to hear like they are
doing something good, not just that
they are harming themselves”
“Health is more holistic”
“An open ear”
“For my baby”
STUDY 2
Objective
To use a focused ethnographic approach to understand the experience
of diabetes in pregnancy and what factors could contribute to achieving
a healthy pregnancy in First Nations women.
Challenges: “It was hard”
“Extra stress”
“Extra work”
“Inconvenient”
“Problematic”
“Fear”
“Scared for the baby more than
for myself”
“Many different emotions”
Control: “A struggle for control”
“No getting around it”
“No control over my health”
“Just do as your doctor says”
“I had to take control”
“My blood sugars got out of control”
Table 4. Multivariate predictors of GDM and pregestational diabetes among Albertan
women by ethnicity. Values are ORs (95% CI).
< 0.001
Age-adjusted
GDM
(all years)
Non First Nations
Compared to age 18-34
† p < 0.01 for OR
‡ To reduce co-linearity, the variables alcohol ≥ 1 drink per day and alcohol ≥ 3 drinks ever were combined
Crude
GDM
(all years)
GDM
(2009)
Pregestational diabetes
(all years)
Pregestational
diabetes (2009)
B
0
Proteinuria
Table 2 Crude and age-adjusted prevalence of GDM and pregestational diabetes for all
years (n = 427,058) and most recent year of data (2009; n = 51,231) by ethnicity in
Alberta. Values are prevalence per 100 (95% CI).
25
5
History of abortion
Both overall crude and age-adjusted GDM and pregesational diabetes
prevalence were significantly elevated for First Nations women in
contrast to non-First Nations women (Table 2).
First Nations
1
Variable
Methods
30
9
Women with diabetes (n = 19,173)
Pre-existing
Age (years)
Age ≤ 17
Age ≥ 35
Rural
Weight ≤ 45 kg
Weight ≥ 91 kg
Hypertension
Chronic renal disease
Figure 1. Age-adjusted prevalence of diabetes in pregnancy over time by ethnicity in
Alberta, 2000-2009. A = GDM prevalence; B = Pregestational diabetes prevalence.
Rate per 1000 x
Table 1. Maternal characteristics, antenatal risk factors and pregnancy outcomes of
pregnancies (n = 427,058) by ethnicity and diabetes in pregnancy status in Alberta, 20002009. Values are prevalence per 100 (95% CI) or mean (SD) as appropriate.
x
INTRODUCTION
Department of Medicine, University of Alberta
Rate, %
Richard T. Oster and Ellen L. Toth
Awareness and Resources: “There
was a lot to learn”
“I didn’t even know what it was”
“A whole lot of information thrown at
me” “I had good access”
“Sometimes you don’t have money to
buy healthy foods”
“Its harder when you are on a budget”
“I walked a lot”
Positives: “It helped me too”
“It was a real eye-opener”
“It made me take care of myself
better and eat healthier”
“Now I know and I can show my
kids” “Ever since then me and my
kids diet has changed”
“I’m more knowledgeable”
Conclusions
Taken together, the experience of diabetes in pregnancy for First Nations
women was “good and bad”, one wrought with struggle but balanced to
some degree by positive lifestyle changes. A loss of control, and at the
same time striving to control blood sugar levels, permeated living with
diabetes in pregnancy. For some women, diabetes in pregnancy offered
a chance to take control of their health. The degree to which the women
felt they could control their diabetes and their health strongly influenced
whether the women felt they had had a positive or a negative pregnancy
experience. Having a strong support system including family, healthcare
provider, cultural/community, and internal support, was crucial to whether
the women felt they had a healthy pregnancy or not. Facing diabetes in
pregnancy alone resulted in a daunting and challenging pregnancy. Most
women had the necessary resources to manage their diabetes but when
awareness and preceding knowledge of diabetes in pregnancy was
lacking, many of the women felt overwhelmed with information upon
diagnosis.
IMPLICATIONS
As high-risk pregnancies and poor outcomes are more common among
First Nations women regardless of diabetes status, efforts must be made
to improve pregnancy care. First Nations women with diabetes in
pregnancy are not likely to benefit from ‘broad brush’ healthcare, rather
providers should look to boost the support systems of these women, add
to their sense of autonomy, and raise awareness of diabetes in
pregnancy. Accordingly, providers should strive for a more patientcentered approach.
References
1. Young TK et al. CMAJ. 2000;163(5):561-6. 2. King M et al. Lancet. 2009;374(9683):76-85. 3. Dyck R et al. CMAJ.
2010;182(3):249-56. 4. Osgood ND et al. Am J Public Health. 2011;101(1):173-9. 5. Shields M. Statistics Canada; 2006. 6.
Statistics Canada; 2006.7. Creswell J, Plano Clark VL. SAGE Publications; 2011.