Ba fin prakash123
•
1 recomendación•373 vistas

A STUDY OF DEALERS & RETAILER OPINION TOWARDS SAFETY PRODUCTS IN MIDAS

Recomendados
Recomendados
Más contenido relacionado
La actualidad más candente
La actualidad más candente (20)
Destacado
Destacado (11)
Similar a Ba fin prakash123
Similar a Ba fin prakash123 (20)
Último
Último (20)
Ba fin prakash123
- 1. A STUDY OF DEALERS & RETAILER OPINION TOWARDS SAFETY PRODUCTS IN MIDAS A PROJECT REPORT Submitted by BAFIN PRAKASH.M (Reg.No: 212915631010) Under the guidance of Mr.MANOJ G In partial fulfilment for the award of the degree of MASTER OF BUSINESS ADMINISTRATION ST. JOSEPH COLLEGE OF ENGINEERING SRIPERUMBUDUR, CHENNAI ANNA UNIVERSITY: CHENNAI - 600025 AUG – 2016
- 2. ST. JOSEPH COLLEGE OF ENGINEERING SRIPERUMBUDUR, CHENNAI 602117 BONAFIDE CERTIFICATE Certify that the project report titled “A STUDY OF DEALERS & RETAILER OPINION TOWARDS SAFETY PRODUCTS IN MIDAS” is the bonafide work of (Reg. No.: 212915631011) who carried out the work under my supervision. Certified further that to the best of my knowledge the work reported herein does not form part of any other project report or dissertation on the basis of which a degree or award was conferred on an earlier occasion on this or any other candidate. Signature of the supervisor Signature of HOD Mr.MANOJ G Mr.P.GOVIDASWAMY, Ass Prof, Dep.of Management Studies HEAD-Dept of Management St. Joseph College of Engg, Chennai. St. Joseph college of Engg, Chennai. Project viva voce held on_________________ INTERNAL EXAMINER EXTERNAL EXAMINER
- 3. DECLARATION Bafin prakash.M (Reg. No: 212915631010) a bonafide student of Department of management Studies, ST. JOSEPH COLLEGE OF ENGINEERING, Sriperumbudur hereby declare that the project entitled “A STUDY OF DEALERS & RETAILER OPINION TOWARDS SAFETY PRODUCTS IN MIDAS” submitted to Anna university in partial fulfilment of the requirements of the Degree of Master of Business Administration in St. Joseph college of Engineering in my original work. Date: Signature Place: Chennai (Bafin prakash.M)
- 4. ACKNOWLEDGEMENT I immensely place in taking up this opportunity to thank the God for his substantial blessing and mercy on us at all stages in the completion of the project successful. I express my deepest and sincere gratitude to our Rev. Fr. Dr. J. E. ARULRAJ Founder and Chairman, of this Wonderful institution of St. Joseph college of Engineering I take this opportunity to express my gratitude to our Rev. Fr.SAVARIYAPPAN, MMI and our Principal, Dr. M.A. LEO VIJILIOUS for allowing us to take over this project. I would like to thank our Head of the Department Mr. P. GOVINDASWAMY, for his scintillating discussion and encouragement towards our project work. I would like to express my deep sense of gratitude to my esteemed Supervisor Mr.MANOJ G, Assist. Professor, Department of Management Studies, for his constant guidance and co- operation during the project work. It is my pleasure to express my gratitude to HR Mr.Santhosh, for his support and encouragement to complete this project. It is pleasure to Regional sales Manager Mr.Anilkumar, and I acknowledge my indebtedness to all the staff members of our Department who aided us successfully to bring our project as effective once. Finally, it is my foremost duty to express my gratitude to my parents and friends for their support and encouragement without I would not have been able to complete this project. (BAFIN PRAKASH.M)
- 5. S, NO DESCRIPTION PAGE NO ABSTRACT LIST OF TABLE LIST OF CHART 1 INTRODUCTION 1.1 ABOUT THE STUDY 1.2 INDUSTRY PROFILE 1.3 COMPANY PROFILE 2 DEVELOPMENT OF MAIN THEME 2.1 NEED OF THE STUDY 2.2 OBJECTIVES OF THE STUDY 2.3 SCOPE OF THE STUDY 2.4 LIMITATIONS OF THE STUDY 2.5 REVIEW OF LITERATURE 2.6 STATEMENT OF THE PROBLEM 3. ANALYSIS, INTERPRETATION & CONCLUSION 3.1 RESEARCH METHODOLOTY 3.2 DATA ANALYSIS AND INTERPRETATION 3.3 FINDINGS 3.4 SUGGESTIONS 3.5 CONCLUSIONS APPENDIX BIBILIOGRAPHY QUESTIONNAIRE
- 6. ABSTRACT The project works entitle “A STUDY OF DEALERS & RETAILER OPINION reference to MIDAS SAFETYPRODUCTS PVT LTD AT SRIPERUMBUDUR”, is mainly conducted to determine the opinion of dealers & retailer about MIDAS safety products. With the above aim, the research has taken the MIDAS SAFETY PRODUCTS PVT LTD for conducting his study. The research has selected a sample of 80 dealers and retailers in different location in an around Tamilnadu state. The methodology selected for the study is descriptive in nature. The data was collected using questionnaire method from the dealers and retailers. The dealers and retailers was selected on the basis of simple random sampling. The collected data were analysed with various advanced statistical tools namely percentage analysis, chi-square analysis, one sample run test, correlation coefficient. After the analysis, the results were tabulated and interpreted and came out with recommendations most appropriate for the organization. Depending upon the survey several findings and suggestions were given to the company.
- 7. TABLE OF CONTENTS S.NO CONTENTS PAGE NO QUESTIONNAIRE 3.2.1 Experience in dealership 3.2.2 How long you are dealing with MIDAS SAFETY? 3.2.3 What do you feel about Quality of MIDAS SAFETY? 3.2.4 Which factors enable you to be the dealer of MIDAS SAFETY? 3.2.5 What do you feel about Credit Period given by MIDAS SAFETY? 3.2.6HOW Wha What do you think about promotional activities given by MIDAS SAFETY? 3.2.7 What do you feel about the Price of MIDAS SAFETY? 3.2.8 What type of promotional activity do you prefer with MIDAS SAFETY? 3.2.9 Whether the expected quantity of MIDAS SAFETY is supplied to you time? 3.2.10 Are you dealing with any other company? 3.2.11 What are the factors that you expect from MIDAS SAFETY? 3.2.12 Do you recommend your customer about MIDAS SAFETY? 3.2.13 Do you have any complaints about MIDAS SAFETY? 3.2.14 How do you feel about the MIDAS SAFETY transportation? 3.2.15 What do you feel about after sales service given by MIDAS SAFETY? 3.2.16 Do you have any suggestions to improve the Quality of MIDAS SAFETY? 3.2.17 Comparative to MIDAS which brand is better in promotional activity? 3.2.18 Which of the following media advertising are considered to be more effective? 3.2.19 What is overall rating you give to MIDAS SAFETY? 3.2.2.2 Correlation co-efficient 3.2.2.3 chi-square
- 8. LIST OF CHARTS S.NO CONTENTS PAGE NO 3.2.1 Experience in dealership 3.2.2 How long you are dealing with MIDAS SAFETY? 3.2.3 What do you feel about Quality of MIDAS SAFETY? 3.2.4 Which factors enable you to be the dealer of MIDAS SAFETY? 3.2.5 What do you feel about Credit Period given by MIDAS SAFETY? 3.2.6HOW Wha What do you think about promotional activities given by MIDAS SAFETY? 3.2.7 What do you feel about the Price of MIDAS SAFETY? 3.2.8 What type of promotional activity do you prefer with MIDAS SAFETY? 3.2.9 Whether the expected quantity of MIDAS SAFETY is supplied to you time? 3.2.10 Are you dealing with any other company? 3.2.11 What are the factors that you expect from MIDAS SAFETY? 3.2.12 Do you recommend your customer about MIDAS SAFETY? 3.2.13 Do you have any complaints about MIDAS SAFETY? 3.2.14 How do you feel about the MIDAS SAFETY transportation? 3.2.15 What do you feel about after sales service given by MIDAS SAFETY? 3.2.16 Do you have any suggestions to improve the Quality of MIDAS SAFETY? 3.2.17 Comparative to MIDAS which brand is better in promotional activity? 3.2.18 Which of the following media advertising are considered to be more effective? 3.2.19 What is overall rating you give to MIDAS SAFETY?
- 9. INTRODUCTION
- 10. 1. INTRODUCTION 1.1 ABOUT THE STUDY Marketing is a communication process that has the purpose of individuals or groups - that are directly or indirectly able to purchase - aware of products and services that may satisfy their existing or newly-identified needs and wants. Marketing is defined by the American Marketing Association as the activity, set of institutions, and processes for creating, communicating, delivering, and exchanging offerings that have value for customers, clients, partners, and society at large. The term developed from the original meaning which referred literally to going to market, as in shopping, or going to a market to buy or sell goods or services. Dealer Any person who carries on business in purchasing, selling, supplying or distributing goods and also includes works contractor, company, Co-operative Society, Broker, Commission Agent, Auctioneer or any other mercantile Agent for the consideration of cash, commission and deferred payment. There are two types of dealer such as: 1) Registered dealer. 2) Casual dealer Registered dealer Registered dealer are the dealer in which they having legal authorized dealer form the company to selling their company product. Casual dealer Casual dealer are the dealer in which they having not legal authorized dealer form the company to selling their company product.
- 11. DEALER’S RELATION Large manufacturers depends on dealer to sell their products, therefore good relations are most important to them , every manufactures thus wants to motivate his distribution channel to sell more of his own products. Here the manufacturer must realize that dealers are themselves business men and must be viewed as customers and human beings rather than mechanical entities for flow of his products The dealer interested in maximizing their profits thus good dealer relations can be promoted if the manner is fair to his dealers in his behavior for example- salesmen of some manufactures dump products on dealers through aggressive selling. Thereafter, the dealer finds stocks are laying at heavy on his hands and he cannot sell those products by adequately. Advertising products in the area concern the manufacturer should provide his dealers with promotional literature; he should correspond them as frequently as necessary to show that the manufacturer is there to help the dealers to sell all and thus makes profit for them. He may offer adequate trade discount, provided display facilitate and even arrange contests among the dealers to motivate them towards better results. The manufacture should realize that the company dealers are more important assets. If they are assisted with promotional help. They will appreciate effort and would be more in demand to support the company campaigns in advertising. DEALER OPIONION Opinion in level of persons felt state resulting from company’s products perceives performance in relational to the person’s expectations. Satisfaction is a function of the difference between the perceived performance and expectations. Company seeks to win in today’s market. The must track their declares expectations, perceive company performance and dealers satisfaction. While assessing the satisfaction level a company must not conclude that it can get full picture of dealer satisfaction and dissatisfaction by simply running complaints and suggestions. As some times dealers may feel that their complaints are minor or that they will be made to feel stupid , or that normally will be offered the results is that the company has need Lesley lost dealers.
- 12. Therefore companies instead of using complaints level as measure of dealer’s satisfaction, obtaining a direct measure of dealer satisfaction of conducting periodic survey would provide more appropriate measures. The questionnaire can be made to a random sample of their recent customers. To find out how they fell about various aspects of the company’s performance. They can also solicit dealers view on the competitor’s performance. the respondents can be asked to list out problems they have, had with the offer and to list out improvements they could suggest companies would also ask the respondents to rate various elements of the offer in terms of the importance of each element and how well the company has performed Exclusive dealers needed to bring dealers satisfaction. Many dealers like to develop exclusive channels for their products. The strategy in which the producer allows only certain concepts to carry its products is called exclusive design when the producer requires that these dealers should not handle expeditor products its strategy is called exclusive dealing, both parties benefits from exclusive arrangements. Retailer A retailer buys goods or products in large quantities from manufacturers or importers, either directly or through a wholesaler, and then sells individual items or small quantities to the general public or end user customers, usually in a shop, also called store. Retailers are at the end of the supply chain. Market On dealers and retailers opinion process Segmentation It is the process of identifying variables that allow someone to divide the market into distinct subsets that can be selected as a marketing target to be researched using the Marketing Mix Segmentation is essential because without it, the best thing a firm could do is to deliver average value. Segmentation Methods Characteristics of the dealers and retailers.
- 13. Benefits sought Systematic Product Related Behaviour (by purchasing behaviour or by channel) Cohort Analysis Geographic Segmentation Targeting Targeting is the process of evaluating the attractiveness of each segment and choose a target. In order to select a target segment, firms must first balance attractiveness with capability and monitor whether actual buyers match the target segment. Characteristics that make a segment attractive Segment Size Growth of Segments Value of Segments Stability Current Company position within the segment Ease of entry Retailers Attitude Unlike urban markets, rural markets are difficult to predict and possess special characteristics. The featured population is predominantly illiterate, have low income, characterized by irregular income, lack of monthly income and flow of income fluctuating with the monsoon winds. Retails markets face the critical issues of Distribution, Understanding the rural consumer, Communication and Poor infrastructure. The marketer has to strengthen the distribution and pricing strategies. The rural consumer expects value for money and owing to has unsteady and meagre status of weekly income; increasing the household income and improving distribution are the viable strategies that have to be adapted to tap the immense potential of the market. Retail markets face the critical issues of Distribution, Understanding the rural consumer, Communication and Poor infrastructure. The marketer has to strengthen the distribution and pricing strategies. It is uneconomical to access a large number of small villages with a very low population density spread over a large geographic area. Social norms, traditions, castes, and social customs have greater influence on the consumer behaviour in rural areas than in urban
- 14. areas. Factors such as limited physical access, low density of shops, limited storage facilities, need for a large number of intermediaries in the distribution channel to reach the end customers, and low capacity of intermediaries to invest in business make the tasks of reaching rural consumers very complex. Retailing is the world’s largest private sector contributing to 8% of the GDP and it employs one sixth of the labour force. The estimated retail trade is expected to be 7 trillion US $. Many countries have developed only due to retailing and presently there is a vast change in the retail industry. As far as India is concerned it contributes to 14% of GDP and it is the second largest sector next to agriculture which provides employment to more number of persons. Now according to a survey, India is classified in to the fifth most attractive retail destination and second among the countries in Asia. Worldwide it is ranked as fifth most attractive retail destination. Retailing includes all activities involved in selling the products and services to the ultimate consumers. So this is said to be the last person in the channel of distribution. FUNCTIONS OF RETAILING Retailing is supposed to provide • Product Utility • Place utility • Time Utility • Ownership Utility It provides final end products to the consumers, not raw materials, end products in usable form to the consumers. Thereby it creates product utility. Second one, it is given in the place where it is required by the consumer. That is, retailing outlets are open in the places according to the convenience of the customer and also based on the demand of the consumer. Third One, it creates Time Utility that is the shops are open as per the requirement of the consumer, whenever the consumers want to go and shop they can go and shop at a particular period convenient to them. Next one, when the product is sold finally it creates Ownership Utility. So retailing is a marketing intermediary which creates Product Utility, Place Utility, Time Utility and Ownership Utility in providing goods and services to the consumers.
- 15. CLASSIFICATION OF RETAIL INDUSTRY: Retail Sector can basically be classified in to two segments. One is organized segment and another one is unorganized segment. As far as India is concerned this organized segment contributes only to 3% of the retail trade and the unorganized segment contributes to remaining 97% of the retail trade. Because all these days’ people have been purchasing only from the street vendors and from the local shops and organized retailing was not in vogue in India. Only after 1991, after opening up of economy and due to liberalization, this organized sector has come too light and presently it exists in various formats like.
- 16. 1.2 INDUSTRY PROFILE 1.2.1 CONSUMER DURABLE INDUSTRY MIDAS SAFETY PRODUCTS PVT LTD comes under on the consumer durable products industrial sector. India in its 62 years of journey has seen manifold increase in the income of its denizens (Rs. 38,084 as on 2010) and this has led to paradigm shift in the purchasing behaviour of the people here. There is a discernible shift in the consumer’s preference in favour of higher end, technologically superior branded products, the demand being spurred by increasing consumer awareness and preference for new models. This shifts also because of the increase in manufacture of branded products and narrowing down of price between branded and non-branded goods. Competition has forced the companies to offer efficient after sales service and support and this, in turn, has swayed customer preference for branded products. Post liberalization there has been inundation of goods transcending the borders and the customer has a wider choice, breaking the shackles of the consumers regarding limitations of choices. Indian The rising income levels, double-income families and increasing consumer awareness are the main growth drivers of this industry. In addition to them the young nature of Population and easy finance options are also fuelling the market and its dynamics. Consumers today are more indulgent in market place than their predecessors. There76has been shift in the definition of needs and wants. For example a mobile phone is more of a need today then a want. Westernization has influenced the psyche of the Indian customers to a degree. This report is an attempt to reflect the changes in the consumer buying behaviour in the Indian Market especially in home appliances buying. Durable goods are those which don‘t wear out quickly, yielding utility over time rather than at once. The consumer durables industry can be broadly classified into two segments: Consumer Electronics and Consumer Appliances. Consumer Appliances can be further categorized into Brown Goods and White Goods. The rural consumer durables markets’ annual growth rate is 30 percent, according to a study by an industry body. The market will grow up to 45 per cent in rural and semi-urban India by 2011, due to improved income and better living standards among rural people.
- 17. 1.2.2 OBSTACLESOF INDIAN CONSUMER DURABLES SECTOR 1. Global companies The domestic consumer durables sector faces threat from newer companies, especially from global ones who have technologically advanced products to offer. 2. Competition Presence of a large number of players in the domestic consumer durables industry leads to competition and rivalry among companies. Threat from rivalry and competition poses a threat to domestic companies. 3. Potential markets remaining yet untapped A large segment of the domestic market, mostly the rural market is yet to be tapped. Tapping this yet untapped and unorganised market is a major challenge for the Indian consumer durables sector. 4. Availability of choice The availability of a wide product line on account of most products being homogeneous, poses a threat for companies operating in the consumer durables sector. Customers have the choice of both domestically produced and imported goods, with similar features. 1.2.4. PERFORMANCE OFCONSUMERDURABLE GOODS ININDIA In the past 10 years, the global market has witnessed a surge in demand as economies such as Brazil, Mexico, India and China have opened up and begun rapid development, welcoming globalization with élan. The consumer durables industry has always exhibited impressive growth despite strong competition and constant price-cutting, and the first contraction since the 2001 dot-com bust has been due to the global recession. Given the strong correlation between demand for durables (both new and replacements) and income, the industry naturally suffered during the 2008-2009period. However, projections for current year going forward are very optimistic, as consumers resume spending, and producers launch new enticing variants to grab new customers.
- 18. The Indian consumer durables industry has witnessed a considerable change in the past couple of years. Changing lifestyle, higher disposable income coupled with greater affordability and a surge in advertising has been instrumental in bringing about a sea change in the consumer behaviour pattern. In addition, change in policy, such as the WTO FTA in 2005 resulted in zero customs duty on imports of all telecom equipment, thereby improving the pricing and affordability of imported goods. The biggest attraction for MNCs is the growing Indian middle class. This market is characterized with low penetration levels. MNCs hold an edge over their Indian counterparts in terms of superior technology combined with a steady flow of capital, while domestic companies compete on the basis of their well- acknowledged brands, an extensive distribution network and an insight in local market conditions.
- 19. 1.3 COMPANY PROFILE MIDAS SAFETY PVT LTD Midas Safety Pvt. Ltd. is one of the leading Manufacturers & Suppliers of Personal Protective Equipment’s All (PPE). Midas Safety Pvt. Ltd. (formerly Frontier Safety Products Pvt. Ltd.) is part of the multinational Midas Safety Inc. of Canada. Midas group has over three decades of experience in manufacturing and distribution of wide range of Safety and Personal Protective Equipment. Most of our factories operate under the ISO 9002 Quality Assurance Certification. We manufacture and distribute our products across 40 countries and stock a wide range of safety products, catering the needs of our valued customers. Midas is a one-stop superstore for all the Personal Protective Equipment (PPE), designed to protect employees from workplace injuries or illness. We supply our products to most of the reputed Industries like Thermal Power Plants, Cement Industries, Steel Plants, Aluminum Plants, Railways, Pharmaceutical Industries, Ports & Docks, Automobile Industries, and Food Industries etc. through our strong network across India. At present 2013 &2014 last finance year we are Archiving 62.02 Croce in India, we have 7 offices and warehouses in all four metros and Gujarat with future plan of having 77 locations all over India. We know how important it is for your workforce to be safe and at the same time to work efficiently. We could offer you a wide range of products including Hand gloves, Helmets, Goggles, Respirators, Ear Plug, Ear Muff, Protective clothing, Safety Shoes, Reflective Jackets, Fire Blankets, Fall Protection, Breathing Apparatus etc. that ensures complete safety of your employees. We could also provide you a variety of tailor made solutions in garments for industrial requirement. Our Strength / Motto is the commitment to the customers ensuring satisfaction, providing value for money without ever compromising quality, makes us your single source for all Personal Protective Equipment requirement Midas associates, a group of manufacturing facilities represented by Midas safety, have the expertise, passion and hard-won experience to bring the manufacturing processes right from the spinning of the yarn to the dipping, packaging and delivery All production facilities are ISO 9001: 2008 certified, and all products are fully of the
- 20. finished glove tested against all applicable EN and ASTM standards and are certified in accordance with the PPE directive. From a single manufacturing unit in its early days, Midas Safety has, over time, vertically integrated to 15 facilities across 10 countries, covering all stages of the product development cycle; from procurement of raw materials, and spinning and plying our own yarn, till the manufacturing end product Midas Associates have factories located throughout Asia, in Pakistan, Sri Lanka and Bangladesh. All manufacturing units have installed 9001 Quality Assurance Systems, which are regularly audited by independent external auditors. Some of the industrial process are shown below. VISION STATEMENT To be one of the leading manufacturers of Work Wear Clothing, renowned for exceeding customer expectations. MISSION STATEMENT We are Work Wear Clothing Manufacturer, focused on providing consistent quality and superior services through operational excellence & a highly motivated competent team. We act with integrity, uphold meritocracy, ensure social & environmental compliance and exhibit care for all stakeholders SPINNING Our associates' state-of-the-art spinning mill is located in the heart of Pakistan’s rich cotton belt. The mill is able to transform bales of raw cotton into fine yarns. These yarns are then knitted or woven into fabrics for liners. These yarns are also used in our machine-knitting factories to produce seamless knitted gloves and shells for coated glove manufacturing. Great care is taken in the selection of the raw materials used in all parts of the process. Only the most reputable suppliers are trusted to partner with us in our quest to meet and exceed the high quality standards of our many certifications. FABRIC PROCESSING Fabric refers to any material made through weaving, knitting, spreading, crocheting or bonding yarns. The knitting process produces fabrics by interlooping yarns. The weaving
- 21. process produces fabric by interlacing yarns. Bleaching and fire-resistant treatment can be performed when requested by the customer. Midas products combine (or use stand-alone) a wide variety of textile fibers and yarns, including cotton yarns, textured polyester and nylon, more exotic high-performance yarns like glass, steel, and aramid (e.g., Kevlar® and Nomex®) and Ultra-High Molecular Weight Polyethylene (e.g., Dyneema®). Midas Associates include several certified Kevlar® licensees, able to spin Kevlar® yarn, in several counts, for Midas’ own use! PLYING Covering - The covering process combines two or more yarns. This composite yarn is made of a central part called the core and an outside part referred to as the covering yarn or just cover. Very often, the core is a spandex, steel or glass fiber, improving the performance of the wrapped yarn. There are different types of yarn covering: Conventional covering - To produce single or double-covered yarns (one or two covers over a core yarn) Air covering - To produce yarns that are simply intermingled Advantage of in-house covering . A balanced yarn can be made to enhance various properties: resistance to abrasion, cut, tear, puncture, etc. In-house covering allows us the freedom to select yarns that optimize both performance and the cost of the final product, as per your custom order. LATEX STORAGE Natural rubber is one of Sri Lanka’s most abundant resources. Our associates purchase raw latex from local plantations and process it for glove production. The latex is then delivered to our disposable and supported glove factories that surround Colombo, Sri Lanka. DIPPING In the final stages of manufacturing, the glove liners are placed on hand-shaped glove molds, then dipped or flow coated with various polymers such as natural rubber, neoprene, nitrile, PVC,silicone. The procedure of dipping provides improved protective properties to the resulting gloves, such as increased degrees of grip, durability, flexibility, splash protection and chemical protection. In addition to the mainstays, Midas offers several unique proprietary coatings
- 22. THE ONLY LANGUAGE WE UNDERSTAND Quality is a core value at Midas Safety. This uncompromising principle is owned by everyone in our organization, and forms the foundation of all our work. At Midas Safety, you can find following key characteristics of our culture of quality at any time: Our leadership emphasizes and acts as the main driver for total quality management, creating an environment that ensures that everyone has the same benchmarks for quality across our global locations. We take you with us through different stages of development of your customized product. Our employees’ learning is always polished and up-to-date through training. This is critical in their role of delivering quality products. The Quality Mindset extends from supply chain, manufacturing, maintenance, processing, human resource, complaint handling, auditing/assessment, statistical process control tools, team formation, customer service to delivery Our Centralized Quality and post-delivery operations. CENTRALIZED QUALITY MANAGEMENT FOR A GLOBAL NETWORK Management System is the platform that we use globally to guarantee compliance with quality standards of manufacturing and product safety. With the help of teams in each manufacturing facilities, different projects and initiatives are taken up to reduce rejection rates and to find root causes of recurring problems, devise corrective actions, implement the same and follow up. Through these projects effective teams are formed and a cohesive drive towards quality is initiated for standardized practices. Success stories & best practices at one manufacturing location are shared, which help others to develop. This is a continual journey towards excellence. All Midas manufacturing locations operate under strict manufacturing conditions in compliance with ISO 9001.Our quality management with SAP ERP, enables us to do enterprise-wide audit management, quality engineering, quality assurance and control, and continuous quality improvement. We are also able to identify variations in real time, to take corrective actions.
- 23. CUSTOMER-CENTRIC INNOVATION Integral to the core belief of innovation at Midas Safety is the commitment to exceed your expectations. The insights you provide us with are the very seeds of the Innovation process. We apply Six Sigma and Lean tools to become increasingly efficient and effective. The relationship we have with you, our customer, is that of a partner. We take all your viewpoints into our decisions, and we value timely communication with you. This practice, of working with our customers so closely, has often resulted in unlocking unrevealed needs that can lead to a competitive advantage for them. SETTING HIGH BENCHMARKS Midas Safety has been at the forefront of innovation with several patents under its belt and an ambition to file 2-4 patents every year. Our drive for innovation results in producing the highest quality products in the market with unique benefits that exceed your expectations. This is achieved through Integrated Development. We manage the development with cross-functional teams to assure all aspects of product success are considered and acted on. The process of new product development is streamlined to validate product and processes, before it is launched; all permanent changes in specs, performance and raw material have to be verified and validated. Our designers use unique processes, materials and textiles to provide the benchmark in performance in terms of abrasion resistance, water repellence, comfort, breathability and insulation. Stringent in-house/external tests and trials have to be done to ensure that the product will comply to application needs. ENABLING IDEA CONVERSION Innovation is impossible without a broad base of technology. Access to multiple technologies allows researchers to take an idea from one realm and apply it to another. The Regional Innovation Centre for Yarn, Textiles and Fabrics is where new products are developed based on the needs of our clients. From concept & design to production, the RIC is equipped with the most technologically advanced glove manufacturing and design facilities that cover everything from safety gloves to leather and sports gloves. The Regional Innovation Centre for Polymers is dedicated to research on developing new materials and testing of polymers and chemicals for the global manufacturing facilities.
- 24. DEVELOPMENT OF THE MAIN THEME
- 25. 2.1 NEED FOR THE STUDY To study the dealers & retailer opinion towards safety products in MIDAS regarding promotional activities, Supply, quality and quantity of product and to know demand level of MIDAS safety product in the market by the customers Provide information about the performance ranks basing on which decision regarding to developing the market poison. Provide feedback information about the level of achievement and behaviour of Retailers. Provide information which helps to council the Dealers and Distributors.
- 26. 2.2 OBJECTIVES OF THE STUDY PRIMARY OBJECTIVE To study on market on dealers & retailers opinion of safety products in MIDAS with special reference to retailers and dealers in Tamilnadu state. SECONDARY OBJECTIVES To analyse relationship between dealers & retailers in MIDAS safety. To find the factors influencing the dealers and retailers to deal with MIDAS safety. To identify the problem occurs between MIDAS and dealer, retailer. To study the impact of sales promotion on sales. To study the dealers and retailers opinion about quality and service of safety products in MIDAS.
- 27. 2.3 SCOPE OF THE STUDY The study is only in the selected dealers and retailers in Tamilnadu state. To know the dealers and retailers satisfactory levels with quality, supply, packing, service of MIDAS and promotional activities by the company. The study enables to know the expectation of the dealers and consequently the customers. The project highlights the scope for future improvements on the basis of present scale.
- 28. 2.4 LIMITATION OF THE STUDY Since the survey was done only in Tamilnadu state the result obtained may not be taken as universal suggestion. Quality of the information highly dependent on the knowledge of the respondents. The results may not be accurate because the survey is on MIDAS dealers and retailers and hence there is a possibility of bias in their responses. The attitude, perception of the customers and the market situations in Tamilnadu state differs from other market so same approach may not be beneficial.
- 29. 2.5 REVIEW OF LITERATURE Retailers Attitude Retailing is the world’s largest private sector contributing to 8% of the GDP and it employs one sixth of the labor force. The estimated retail trade is expected to be 7 trillion US $. Many countries have developed only due to retailing and presently there is a vast change in the retail industry. As far as India is concerned it contributes to 14% of GDP and it is the second largest sector next to agriculture which provides employment to more number of persons. Now according to a survey, India is classified in to the fifth most attractive retail destination and second among the countries in Asia. Worldwide it is ranked as fifth most attractive retail destination. Retailing includes all activities involved in selling the products and services to the ultimate consumers. So this is said to be the last person in the channel of distribution. Bloemer and Kasper – Retailers Attitude:) the relationship between on Customer satisfaction and loyalty was moderated by respondents on the evaluation of the brand choice. (“http://zenithresearch.org.in/doc/22009663/Market - Retailers- Attitude - Report”) Mittal and Kamakura – Retailers Attitude: address the link between satisfactions and repurchase behavior. Their major findings indicate that despite identical rating on satisfaction, due to respondent characteristics such as age, education, marital status, sex and area of residence, significant difference was observed in repurchase behaviour. (“http://zenithresearch.org.in/doc/22009663/Market - Retailers- Attitude - Report”) Steiner – Retailers Attitude: Steiner Over the past decade, retailers use manufacturer brands to generate consumer interest, patronage and loyalty in a store. With the growth of competition, retailers compete with manufacturers for consumer pull to increase their relative market power and their share of the total channel profit pie (Steiner, 1993). Private label
- 30. strategy can help retailers attract customer traffic and create loyalty to the store by offering exclusive product lines and premium products (Corstjens and Lal, 2000). (“http://zenithresearch.org.in/doc/22009663/Market - Retailers- Attitude - Report”) Dunner and Narasimhan – Retailers Attitude: Private label strategy can help project a lower- price image for retailers, increase their bargaining power over manufacturers and producers of major national brands, and lead to increased control over shelf space. With the overwhelming success of some private labels in European retail (e.g. Marks and Spencer, Asda, Tesco, Carrefour) and the popularity of President's Choice private label in Canada, strong retail brands have become the source of intense interest (Wileman and Jary, International Journal of Business Economics & Management Research Vol.2 Issue 5, May 2012, ISSN 2249 8826 Online available at expect that close to 50% of all EU grocery sales will be represented by the top ten retailers by 2005. Therefore, the cumulative power carried by these retailers and their store brands is significant (Lepir, 2001). (“http://zenithresearch.org.in/doc/22009663/Market - Retailers- Attitude - Report”) Moye and Kincade – Retailers Attitude:Consumers express preference or lack of preference for stores, brands, advertisements and other marketing stimuli by reflecting a favorable or unfavorable attitude. In this sense, consumers with a favorable attitude toward a store will most likely select the store and buy its products, but consumers with unfavorable attitudes will not select the store and not purchase the products there. (“http://zenithresearch.org.in/doc/22009663/Market - Retailers- Attitude - Report”) Peter and Olson – Retailers Attitude: one of the main focuses of the researchers is to figure out the relation between attitude, intention and a person’s actual behavior. Based on the idea of consistency, attitudes toward an object are generally anticipated to be related to behaviors toward the object. (“http://zenithresearch.org.in/doc/22009663/Market - Retailers- Attitude - Report”) Fishbein – Retailers Attitude - “most market researchers believe, and operate under the assumption, that the more favorable a person’s attitude toward a given product (or brand), the more likely the person is to buy or use that product (or brand)
- 31. (“http://zenithresearch.org.in/doc/22009663/Market - Retailers- Attitude - Report”) George BobinskriJr.Bringhamton – Retailers Attitude: retailers often advertise products at “reduced” prices. Past research has suggested this is an effective way to appeal to consumers; but recent evidence indicates growing consumer mistrust of this type of advertising claim. This paper presents an experiment that suggests consumer perceptions of retail price reductions may depend on the rationale the retailer provides for the reductions. (“http://zenithresearch.org.in/doc/22009663/Market - Retailers- Attitude - Report”) Dena Cox and Anthony Cox – Retailers Attitude: Marking up to mark down and referring to a fictions “regular” price in retail advertising can deceive consumers and cause consumer injury. The practice, known as high-low pricing, has become widespread in the intensively competitive retail environment. Consumers respond to this practice by drawing one of the several inferences about the value of the product and the prevailing competitive price. Whether the consumer is deceived depends on the inference drawn. This paper integrates legal, public policy, consumer behavior, and retailing perspectives to examine the issue and the purpose retailer and regulatory solutions. (“http://zenithresearch.org.in/doc/22009663/Market - Retailers- Attitude - Report”) Larry Friedman; “A person or in the business of buying and selling securities of their own account, whether through a broker or otherwise. A dealer is defined by a fact it is acts as a principal in trading for it’s owned as agent in executing orders on behalf of its clients. A dealer is also disinfect from the trading in that buying and selling securities is a part of its regular business, while a trade buys and sells securities for his own or her own account but not on a business basis “ (“http://www.investopedia/terms/d/dealers.asp”) David A. Aaker, ”Individual or firm that buys good from a producer or distributors for wholesale or retail selling unlike a distributors , a dealer is a principal and not an agent.” (“http://www.businessdictionary.com/definition/retailer.htm”)
- 32. Jay Conrad Levinson,“Dealers wants high marginal gain from the manufactures. The main objectives of dealership is earning profits. Dealership business is different from other business.” (“http://www.scribd.com/doc/44372/A-STUDY-ON-DEALERE2%3%satisfaction”) Edward de Boron,” An individual or entity ,such as a securities firm, when it acts a principal and stands ready to buy and sells for its own account .more generally as an individual or entity which buys and sells products and hold an inventory. (“http://www.investorswords.com/1300/retailer.html/ixxYbobyxi”) John Kenneth Galbraith,” A person or business firm acting as a middle man to facilitate distribution of securities or goods .typically , a dealer buys for his or own account as an agent .the dealer’s profits or loss is the difference between the price he pays and the price he receives for the same security or goods. The same individual or company, at different times, function as a dealer or a broker, who buys and sells for his clients’ accounts.” (“http://www.investordictionary.com/definition/dealer”) Stafford Beer,” A pre-approved bank, broker/dealer or other financial institution that is able to make business deals with the U.S. Federal Reserve, such as underwriting new government debt. These dealers must meet certain liquidity and quality requirements as well as provide a valuable flow of information to the fed about the state of the worldwide markets.” (“http://www.investopedia.com/terms/d/primary retailer.asp”) Hugh Mackay,” A market maker in a dealer market stakes its own capital to provide liquidity to investors .the primary mode of risk control for the market maker is therefore the use of the bid-ask spread ,which represents a tangible cost to investors.” (“http://www.investopedia.com/terms/d/dealersmarket.asp”)
- 33. Neil Rachham,” A market in which transaction occur between principals acting as dealers buying and selling for their own accounts, rather than between brokers acting as agents for buyers and sellers. One example is the market for Treasuries.” (“http://www.investorwords.com/1302/dealermarket.html#ixzzzYdjWO”) AI Ries,”A market where market makers can buy and sell for their own account or for customer accounts .usually, at least one side of the transaction is conducted on behalf of the dealers account. A market in which securities are bought and sell through a network of dealers who buy, sell and take position in various security issues.” (“http://www.yourdictionary.com/dealer-market”) Theodore Levitt,” dealers opinion is a functional at perceived performance and expectation .feelings of satisfaction arise when dealers compare their perceptions of the performance of a product or service to their desire and expectations. If the perceived performance equals or exceeds as a dealers expectation, then the dealers is satisfied. But if perceives performance falls short of his expectations, then the dealer is satisfied.” (“http://www.marketingdealerssatisfaction.com.au/features/gurus.html”) 2.6 STATEMENT OF THE PROBLEM In order to survive the present market, to increase sales and to promote safety products through customer satisfaction, companies need information about its overall performance when compared with the activities of the competitors. For this, company was
- 34. needed to analyse the company's position and market trend. To find out the company's strength and weakness in comparison with the competitors.
- 36. 3.1 RESEARCH METHODOLOGY Research methodology is way to systematically solve the research problem. It is a plan of action for a research project and explains in detail how data are collected and analyzed. Research Methodology may be understood as a science of studying how research is done scientifically. It can cover a wide range of studies from simple description and investigation to the construction of sophisticated experiment. A clear objective provides the basis of design of the project. Since the main objective of this study is to identify the customers preference, expectation and perception. It was decided to use descriptive research design include, surveys and fact-findings enquires of different kinds, which found out to be the most suitable design in order to carry out the project. 3.1.1 MEANING OF RESEARCH Research is an art of scientific investigation. The advanced learner’s dictionaries of current English lay down the meaning of research as, “a careful investigation (or) inquiry especially through search for new facts in any branch of knowledge”. Redmen and Mary research as a “systematic effort to gain knowledge”. 3.1.2 RESEARCH DESIGN A Research design is plan that specifies the objectives of the study, method to be adopted in the collection of the data, tools in analysis of data and helpful to frame hypothesis. “A research design is the arrangement of condition for collection and analysis of data in a manner that aims to combine relevance to research purpose with economy in procedure”. Research design is needed because it facilitates the smooth sailing of the various project operations, thereby making the project as efficient as possible yielding maximal information with minimal expenditure of effort time and money. Also it minimizes bias and maximizes the reliability of the data collect.
- 37. 3.1.3 DATA COLLECTION The data collection pertaining to the study involves on the basis of primary data and secondary data. PRIMARY DATA The primary data have been collected from customers by personal interview by selecting consumers belonging to the Customers of Retailers. SECONDARY DATA The secondary data is undertaken only among the domestic sales department within the organization. TYPES OF QUESTIONNAIRE Questionnaire was constructed in two formats i. Dichotomous ii. Multiple choice 3.1.4 SAMPLE DESIGN GEOGRAPHICAL AREA The study is conducted in an around Tamilnadu state. DURATION OF PROJECT The duration of project work is about 30 days POPULATION Population for this research is set of dealers those who are dealing with MIDAS in an around Tamilnadu state and the population is 156 dealers and retailers. SAMPLE UNITS The sampling units used by the researcher for this research, are those who are dealing MIDAS. SAMPLE SIZE The number of samples collected by the researcher is 80 dealers and retailers.
- 38. 3.1.5 STATISTICAL TOOLS The following statistical techniques have been for the study 1. Percentage Analysis. 2. Chi-square Test. 3. Correlation Co-efficient. PERCENTAGE METHOD The percentage method was extensively used for findings various details. It is used for making comparison between two or more series of data. It can be generally calculated. Percentage of customers is this project Percentage method test was used. The following are the formula No of Respondent Percentage of Respondent = x 100 Total no. Of Respondents CHI-SQUARE TEST The chi-square test has been used to find the relationship between variables, as it is applicable for cross-tabulated data. This test has been used to determine whether or not there is any association statistically, between the variables in data collected. The chi-square contingency table has been used, as it is appropriate for the hypothesis of independence between two nominally scaled variables. Chi square (χ2 ) = Σ (Oij-Eij)2 / Eij Where Oij= Observed frequency of the cell in ith roe and jth column Eij= Expected frequency of the cell in ith row and jth column E = Expected frequency O = Observed frequency
- 39. CORRELATION CO-EFFICIENT To test whether a significant relationship between after sales service and transportation given by MIDAS SAFETY 𝑟 = 𝑁∑𝑋𝑌 − ∑𝑋∑𝑌 √Nx2 − (∑X)2 N∑Y2 − (∑Y)2
- 40. 3.2DATA ANALYSIS AND INTERPRETATION TABLE: 3.2.1 Experience in dealership S.No CRITERIA RESPONDENTS PERCENTAGE 1. less than 1 year 6 7 2. 1-3 years 20 25 3. 4-7 years 39 49 4. 8-10 years 12 15 5. Above 10 years 3 4 Total 80 100 Source: primary source CHART: 3.2.1 INTERPRETATION From the above table it observed that 4% are having above ten years’ experience and 15% are in the business of about 8-10 years. The other 49% have 4-7 years of experience, 25% of the dealers have 1-3 years’ experience and the rest 0f 7% are having less than 1 year experience 6 20 39 12 3 7 25 49 15 4 LE S S T H A N 1Y E A R 1- 3 Y E A RS 4- 7 Y E A RS 8- 10 Y E A RS A BOVE 10 Y E A RS Experience in dealership RESPONDENTS PERCENTAGE
- 41. TABLE: 3.2.2 Dealing with MIDAS SAFETY S.No CRITERIA RESPONDENTS PERCENTAGE 1. less than 1 year 6 7 2. 1-3 years 20 25 3. 4-7 years 39 49 4. 8-10 years 12 15 5. Above 10 years 3 4 Total 80 100 Source: primary source CHART: 3.2.2 INTERPRETATION From the above table it observed 4% are having above ten years’ experience and 15% are in the business of about 8-10 years. The other 49% have 4-7 years of experience, 25% of the dealers have 1-3 years’ experience and the rest 0f 7% are having less than 1 year experience. 6 20 39 12 3 7 25 49 15 4 LE S S T H A N 1Y E A R 1- 3 Y E A RS 4- 7 Y E A RS 8- 10 Y E A RS A BOVE 10 Y E A RS Dealing with MIDAS SAFETY RESPONDENTS PERCENTAGE
- 42. TABLE: 3.2.3 Quality of MIDAS SAFETY S.No CRITERIA RESPONDENTS PERCENTAGE 1. Very good 25 32 2. Good 24 30 3. Neutral 16 20 4. Poor 13 15 5. very poor 2 3 Total 80 100 Source: primary source CHART: 3.2.3 INTERPRETATION From the above table it observed 32% of the dealers rated very good toward the quality of MIDAS SAFETY ,30% of dealers rated good,20% of dealers rated neutral,15% of dealers rated poor and remaining 03% rated very poor toward quality of MIDAS SAFETY. 25 24 16 13 2 32 30 20 15 3 VE RY GOOD GOOD NE UT RA L P OOR VE RY P OOR Quality of MIDAS SAFETY RESPONDENTS PERCENTAGE
- 43. TABLE: 3.2.4 Factors enable you to be the dealer of MIDAS SAFETY S.No CRITERIA RESPONDENTS PERCENTAGE 1. Promotions scheme 14 18 2. Quality 15 19 3. Company Policy 21 26 4. Margin 17 22 5. Service 13 15 Total 80 100 Source: primary source CHART: 3.2.4 INTERPRETATION From the above table it observed 26% of the dealers are dealing with MIDAS SAFETY for its Company Policy, 19% for quality, 18% for Promotions scheme, 19% of dealers are dealing for margin and remaining 4% are dealing by seeing Service. 14 15 21 17 13 18 19 26 22 15 P ROMOT IONS S C H E ME QUA LIT Y C OMP A NY P OLIC Y MA RGIN S E RVIC E Factors enable you to be the dealer of MIDAS SAFETY RESPONDENTS PERCENTAGE
- 44. TABLE: 3.2.5 Credit Period given by MIDAS SAFETY S.No CRITERIA RESPONDENTS PERCENTAGE 1. Very good 25 32 2. Good 25 32 3. Neutral 9 10 4. Poor 10 12 5. very poor 11 14 Total 80 100 Source: primary source CHART: 3.2.5 INTERPRETATION From the above table it observed 32% of the dealers rated very good toward the Credit period of MIDAS SAFETY,32% of dealers rated good,10% of dealers rated neutral 10% of dealers rated poor and remaining 14% rated very poor toward Credit period of MIDAS SAFETY. 25 25 9 10 11 32 32 10 12 14 VE RY GOOD GOOD NE UT RA L P OOR VE RY P OOR Credit Period given by MIDAS SAFETY RESPONDENTS PERCENTAGE
- 45. TABLE: 3.2.6 Promotional activities given by MIDAS SAFETY S.No CRITERIA RESPONDENTS PERCENTAGE 1. Very good 19 24 2. Good 24 30 3. Neutral 13 16 4. Poor 13 16 5. Very poor 11 14 Total 80 100 Source: primary source CHART: 3.2.6 INTERPRETATION: From the above table it observed that promotion activities carried out by MIDAS SAFETY s is found to be satisfactory. About 24% of the dealers found very good and 30% of the dealers found are good. 16% dealers are Neutral, 16% dealers are Poor and the rest 06% of the dealers are reporting Very poor. The promotion activities are can be still improved according their opinion. 19 24 13 13 11 24 30 16 16 14 VE RY GOOD GOOD NE UT RA L P OOR VE RY P OOR Promotional activities given by MIDAS SAFETY RESPONDENTS PERCENTAGE
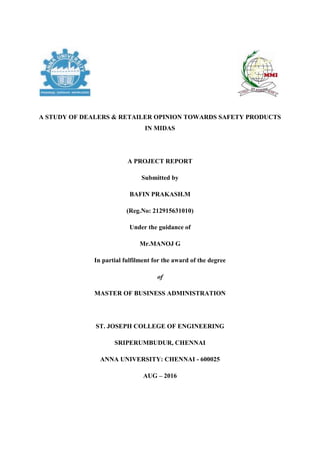
- 46. TABLE: 3.2.7 Price of MIDAS SAFETY S.No CRITERIA RESPONDENTS PERCENTAGE 1. Very High 24 30 2. High 29 36 3. Average 16 21 4. Low 16 7 5. Very Low 5 6 Total 80 100 Source: primary source CHART: 3.2.7 INTERPRETATION From the above table it observed 30% of the dealers rated Very high toward the price of MIDAS SAFETY, 36% of dealers rated High price, 21% of dealers rated Average, 7% of dealers rated low and remaining 06% rated Very Low toward quality of MIDAS SAFETY. 24 29 16 6 5 30 36 21 7 6 VE RY H IGH H IGH A VE RA GE LOW VE RY LOW Price of MIDAS SAFETY RESPONDENTS PERCENTAGE
- 47. TABLE: 3.2.8 Promotional activity do you prefer in MIDAS SAFETY S.No CRITERIA RESPONDENTS PERCENTAGE 1. Discounts 15 19 2. Gifts 13 16 3. Prizes 12 15 4. Offers 29 36 5. Combo offers 11 14 Total 80 100 Source: primary source CHART: 3.2.8 INTERPRETATION From the above table it observed that Most of the dealers are influenced by the offer offering to them. Hence the 36% of the dealers are influenced by offer, 15% are influenced by Prizes, 14% of the dealers are influenced by combo offer, 16% are influenced by Gifts, and 19% are influenced by Discount provided by MIDAS SAFETY. 15 13 12 29 11 19 16 15 36 14 DIS C OUNT S GIF T S P RIZE S OF F E RS C OMBO OF F E RS Promotional activity do you prefer in MIDAS SAFETY RESPONDENTS PERCENTAGE
- 48. TABLE: 3.2.9 Expected quantity of MIDAS SAFETY is supplied to you in time S.No CRITERIA RESPONDENTS PERCENTAGE 1. YES 60 75 2. NO 20 25 Total 80 100 Source: primary source CHART: 3.2.9 INTERPRETATION From the above table it observed that 75% of dealers are satisfied with the supply of MIDAS SAFETY with in time and remaining 25% are dissatisfied. 60 20 75 25 Y E S NO Expected quantity of MIDAS SAFETY is supplied to you in time RESPONDENTS PERCENTAGE
- 49. TABLE: 3.2.10 Dealing with any other company S.No CRITERIA RESPONDENTS PERCENTAGE 1. YES 72 90 2. NO 8 10 Total 80 100 Source: primary source CHART: 3.2.10 INTERPRETATION From the above table it observed that 10% of the dealers are dealing with other companies and 90% deal only MIDAS SAFETY. 72 8 90 10 Y E S NO Dealing with any other company RESPONDENTS PERCENTAGE
- 50. TABLE:3.2.11 Factors that you expect from MIDAS SAFETY S.No CRITERIA RESPONDENTS PERCENTAGE 1. Promotional schemes 8 10 2. Sales follow up 28 35 3. Service 17 22 4. Credit facilities 27 33 Total 80 100 Source: primary source CHART: 3.2.11 INTERPRETATION From the above table it observed that want the support of sales follows, about 35% of dealers want the support of sales follows, 33% of dealers wants the support of credit facilities, 22% of dealers wants the support of Service, and remaining 10% of dealers wants the support of promotional activities. 8 28 17 27 10 35 22 33 P ROMOT IONA L S C H E ME S S A LE S F OLLOW UP S E RVIC E C RE DIT F A C ILIT IE S Factors that you expect from MIDAS SAFETY RESPONDENTS PERCENTAGE
- 51. TABLE: 3.2.12 Recommend your customer about MIDAS SAFETY S.No CRITERIA RESPONDENTS PERCENTAGE 1. YES 71 88 2. NO 09 12 Total 80 100 Source: primary source CHART: 3.2.12 INTERPRETATION From the above table it observed that 88% of dealers recommend to their customers about MIDAS SAFETY and remaining 12% of dealers do not recommend MIDAS SAFETY to their customers. 71 9 88 12 Y E S NO Recommend your customer about MIDAS SAFETY RESPONDENTS PERCENTAGE
- 52. TABLE: 3.2.13 Complaints about MIDAS SAFETY S.No CRITERIA RESPONDENTS PERCENTAGE 1. YES 12 15 2. NO 68 85 Total 80 100 Source: primary source CHART: 3.2.13 INTERPRETATION From the above table it observed that 85% of dealers are not having any complaints with MIDAS SAFETY and remaining 15% or dealers are having some complaints with MIDAS SAFETY. 12 68 15 85 Y E S NO Complaints about MIDAS SAFETY RESPONDENTS PERCENTAGE
- 53. TABLE: 3.2.14 MIDAS SAFETY transportation S.No CRITERIA RESPONDENTS PERCENTAGE 1. Highly Satisfied 26 33 2. Satisfied 19 24 3. Moderate 14 17 4. Dissatisfied 13 16 5. Highly Dissatisfied 8 10 Total 80 100 Source: primary source CHART: 3.2.14 INTERPRETATION From the above table it observed that 33% of the dealers are Highly Satisfied toward the Transportation of MIDAS SAFETY, 24% of dealers are satisfied, 17% of dealers are Moderate, 16% of dealers are dissatisfied and remaining 10% are dissatisfied towards Transportation of MIDAS SAFETY. 26 19 14 13 8 33 24 17 16 10 H IGH LY S A T IS F IE D S A T IS F IE D MODE RA T E DIS S A T IS F IED H IGH LY DIS S A T IS F IED MIDAS SAFETY transportation RESPONDENTS PERCENTAGE
- 54. TABLE: 3.2.15 After sales service given by MIDAS SAFETY S.No CRITERIA RESPONDENTS PERCENTAGE 1. Highly Satisfied 35 44 2. Satisfied 20 25 3. Moderate 18 22 4. Dissatisfied 5 6 5. Highly Dissatisfied 2 3 Total 80 100 Source: primary source CHART3.2.15 INTERPRETATION From the above table it observed that 44% of the dealers are highly satisfied toward the after sales service of MIDAS SAFETY, 25% of dealers are satisfied, 22% of dealers are Moderate, 6% of dealers are dissatisfied and remaining 3% are Highly dissatisfied towards after sales service of MIDAS SAFETY. 35 20 18 5 2 44 25 22 6 3 H IGH LY S A T IS F IE D S A T IS F IE D MODE RA T E DIS S A T IS F IE D H IGH LY DIS S A T IS F IED After sales service given by MIDAS SAFETY RESPONDENTS PERCENTAGE
- 55. TABLE: 3.2.16 Any suggestions to improve the Quality of MIDAS SAFETY S.No CRITERIA RESPONDENTS PERCENTAGE 1. YES 78 97 2. NO 2 3 Total 80 100 Source: primary source CHART: 3.2.16 INTERPRETATION From the above table it observed that 3% of the dealers have suggestions to improve their quality. The rest 97% of the dealers are satisfied with what they are offering in MIDAS SAFETY. 78 2 97 3 Y E S NO Any suggestions to improve the Quality of MIDAS SAFETY RESPONDENTS PERCENTAGE
- 56. TABLE: 3.2.17 Comparative to MIDAS which brand is better in promotional activity S.No CRITERIA RESPONDENTS PERCENTAGE 1. JaycoSafety Products 6 7 2. Industrial Safety Products 7 9 3. Fusionsafety products 15 15 4. Honey well pvt ltd 7 9 5. None of these 48 60 80 100 Source: primary source CHART: 3.2.17 INTERPRETATION From the above table it observed that 60% of the dealers are saying none of these are better in promotional activity when compare to MIDAS SAFETY, 9% of dealers are saying Honey well pvt ltd are better in promotional activity when compare to MIDAS SAFETY, 15% of dealers are saying Fusion safety products are better in promotional activity when compare to MIDAS SAFETY, 9% of dealers are saying industrial safety products are better in promotional activity when compare to MIDAS SAFETY, 15% of dealers are saying Jayco safety products are better in promotional activity when compare to MIDAS SAFETY. 6 7 15 7 48 7 9 15 9 60 JA Y C OS A F E T Y P RODUC T S INDUS T RIA L S A F E T Y P RODUC T S F US IONS A F E T Y P RODUC T S H ONE Y W E LL P VT LT D NONE OF T H E S E Comparative to MIDAS which brand is better in promotional activity RESPONDENTS PERCENTAGE
- 57. TABLE: 3.3.18 Media advertising are considered to be more effective S.No CRITERIA RESPONDENTS PERCENTAGE 1. Print media 20 25 2. Electronic media 19 24 3. Radio 6 7 4. outdoor advertisement 19 24 5. Any other media 16 20 80 100 Source: primary source CHART: 3.3.18 INTERPRETATION From the above table it observed that 25% of the dealers are saying Print media are considered to be more effective, 24% of the dealers are saying electronic media are considered to be more effective, 7% of the dealers are saying radio are considered to be more effective, 24% of the dealers are saying outdoor advertisement are considered to be more effective, 20% of the dealers are saying some other media are considered to be more effective. 20 19 6 19 16 25 24 7 24 20 P RINT ME DIA E LE C T RONIC ME DIA RA DIO OUT DOOR A DVE RT IS E ME NT A NY OT H E R ME DIA Media advertising are considered to be more effective RESPONDENTS PERCENTAGE
- 58. TABLE: 3.2.19 Overall rating you give to MIDAS SAFETY S.No CRITERIA RESPONDENTS PERCENTAGE 1. Very High 25 31 2. High 30 38 3. Average 10 13 4. Low 8 10 5. Very Low 7 8 Total 80 100 Source: primary source CHART: 3.2.19 INTERPRETATION From the above table it observed that 31% of the dealers rated very good toward the overall rating of MIDAS SAFETY,38% of dealers rated good,13% of dealers rated neutral,10% of dealers rated poor and remaining 08% rated very poor toward overall rating of MIDAS SAFETY. 25 30 10 8 7 31 38 13 10 8 VE RY GOOD GOOD NE UT RA L P OOR VE RY P OOR Overall rating you give to MIDAS SAFETY RESPONDENTS PERCENTAGE
- 59. TABLE: 3.2.20 CORRELATION CO-EFFICIENT Need for the test To test whether is a significant relationship between transportation and after sales service given by MIDAS SAFETY and SAFETY TRANSPORTATION RESPONDENTS AFTER SALES SERVICE RESPONDENTS Highly Satisfied 26 Highly Satisfied 35 Satisfied 19 Satisfied 20 Moderate 14 Moderate 18 Dissatisfied 13 Dissatisfied 5 Highly Dissatisfied 8 Highly Dissatisfied 2 TABLE: 3.2.20.1 X Y 𝑿 𝟐 𝒀 𝟐 XY 26 35 676 1225 910 SSS19 20 361 400 380 14 18 196 324 252 13 5 169 25 65 8 2 64 4 16 ∑X=80 ∑Y=80 ∑𝒙 𝟐 =1466 ∑𝒀 𝟐 =1978 ∑XY=1623
- 60. 𝑟 = 𝑁∑𝑋𝑌 − ∑𝑋∑𝑌 √Nx2 − (∑X)2N∑Y2 − (∑X)2 5(1623)-(80)*(80) R =------------------------------------------------- √ (5*1466)-(80)2 √ (5*1978)-(80)2 Calculated value = 0.0043 Conclusion There exists positive correlation. There is a significant relationship between after sales service given by MIDAS SAFETY and SAFETY transportation.
- 61. TABLE: 3.2.21 CHI-SQUARE The chi-square test has been used to find the relationship between variables, as it is applicable for cross-tabulated data Overall rating Experience in dealership Very good Good Moderate Poor Very poor Total <1 year 2 4 0 0 0 6 1-3years 8 5 5 2 0 20 4-7 years 16 14 4 3 2 39 8-10 years 1 6 0 3 2 12 >10 years 2 0 1 0 0 3 Total 29 29 10 8 4 80 NULL HYPOTHESIS There is no significant difference between Experience in dealership and Overall rating of MIDAS safety products. ALTERNATIVE HYPOTHESIS There is significant difference dealership and Overall rating of MIDAS safety products.
- 62. TABLE: 3.2.21.1 S. No 𝑶 𝑰 𝑬 𝑰 𝑶 𝑰 − 𝑬 𝑰 [𝑶 𝑰 − 𝑬 𝑰]𝟐 [𝑶 𝑰 − 𝑬 𝑰]𝟐 𝑬 𝑰 1 2 2.1 0.1 0.01 0.004 2 4 2.1 1.9 3.61 1.719 3 0 0 0 0 0 4 0 0 0 0 0 5 0 0 0 0 0 6 8 7.2 0.8 0.64 0.088 7 5 7.2 2.2 4.84 0.672 8 5 2.5 2.5 6.25 2.5 9 2 2 0 0 0 10 0 0 0 0 0 11 16 14.1 1.9 3.61 0.256 12 14 14.1 0.1 0.01 0.0007 13 4 4.8 0.8 0.64 0.133 14 3 3.9 .09 0.0081 0.002 15 2 1.9 0.1 0.01 0.005 16 1 4.3 3.3 10.89 2.534 17 6 4.3 1.7 2.89 0.672 18 0 0 0 0 0 19 3 1.2 1.8 3.24 2.7 20 2 0.6 1.4 1.96 3.266 21 2 1.8 0.2 0.04 0.022 22 0 0 0 0 0 23 1 0.3 0.7 0.49 1.633 24 0 0 0 0 0 25 0 0 0 0 0 16.20
- 63. FORMULA Chi square (χ2 ) = Σ (Oij-Eij)2 / Eij Level of significance The tabulated value of chi – square (χ2 ) Degree of freedom = (r-1) (c-1)-1 = (5-1) (5-1)-1 = 15, α = 0.05 Calculated value = 16.20 Calculated value < Tabulated value so, alternative hypothesis is selected. Conclusion There is significance difference between Experience in dealership and Overall rating of MIDAS safety products.
- 64. 3.3 Findings Most of the dealers 49% have 4-7 years of experience in dealership among that they are dealing with MIDAS SAFETY. Most of the dealers rated that the Quality of MIDAS SAFETY is very good About 85% of dealers are not having any complaints with MIDAS SAFETY Minimum of the dealers also deal with other brands to satisfy the need of various customers. About 10% of the dealers are dealing with other companies and 90% deal only MIDAS SAFETY. About 64% of the dealers rated good toward the Credit period of MIDAS SAFETY. About 80 dealers, 75% of dealers are satisfied with the supply of MIDAS SAFETY with in time and remaining 25% are dissatisfied. About 66% of the dealers rated high toward the price of MIDAS SAFETY. About 88% of dealers recommend to their customers about MIDAS SAFETY. According to dealers print and electronic media are consider to be more effective to promote MIDAS SAFETY. About 57% of the dealers are satisfied toward the Transportation of MIDAS SAFETY. About 69% of the dealers are satisfied toward the after sales service of MIDAS SAFETY. About 3% of the dealers have suggestions to improve their quality of MIDAS SAFETY. About 60% of the dealers are saying none of these are better in promotional activity when compare to MIDAS SAFETY About 25% of the dealers are saying Print media are considered to be more effective. Overall 69% of the dealers rated MIDAS SAFETY as Good.
- 65. 3.4 Suggestions Dealers should be encouraged through arranging special meetings. Promotional activities should be improved like discounts, gifts, prizes etc. As media impact is more, so company should go for more advertisements in mass media and outdoor advertisements to promote their brand. In time delivery (service) should be improved. Improve awarding the dealers who make the highest turnover yearly Most of the dealers report price is below the satisfactory level for the product. The company should have the credit period given to each dealer, because most dealers are well satisfied with good credit period.
- 66. 3.5 CONCLUSIONS MIDAS SAFETY product is one of the fast moving brands in India. The company is holding a good market value which is the result of efforts made by the company management and the executives. From the market survey we can conclude that: 1. Supply and quality factors are fetching to the movement of brand. 2. The company is having a good dealer network and it is maintaining good relations with them i.e., the service rate of the company is good. 3. The price of MIDAS SAFETY is matching with the quality of the safety products. 4. With the ideal promotional strategies and increasing the satisfactory level of the dealers the company can glow and become a market leader in the future.
- 67. BIBILIOGRAPHY BOOKS: 1. Kothari, C.R., Research Methodology-Methods & Techniques, New Delhi, New Age International (P) Ltd., Second Edition, 2004. 2. Gupta, S.P., Statistical Methods, New Delhi, Sultan Chand & Sons Publishers, Thirty Fourth Editions, 2005. 3. Philip Kotler, Kevin Lane Keller, Abraham Koshy, Marketing Management, New Delhi, Twelfth Edition, 2006. 4. Retailing management, Levy,weitz,pandit, Tata McGraw Hill 5. Principles of Marketing, V.S.RamaSwamy, Prentice Hall India WEBSITES: 1. http://www.midassafety.com/ 2. www.encyclopedia.com/dealership 3. www.msn.com/market On Customer opinion 4. www.wikipedia.com/consumer durables 5. www.tutorial4u.com/consumer behaviour 6. www.scribd.com/retailer
- 68. APPENDIX
- 69. QUESTIONNAIRE A STUDY OF DEALERS & RETAILER OPIONION TOWARDS SAFETY PRODUCTS IN MIDAS 01. Name: 02. Address: 03. Experience in dealership: (a) Less than 1 year (b) 1-3 years (c) 4-7 years (d) 8-10 years (e) Above 10 years 04. Are you dealing with other companies? (a) Yes (b) No If yes, specify ___________________________________________ 05. What is overall rating you give to MIDAS SAFETY? (a) Very Good (b) Good (c) Satisfactory (d) Poor (e) Very poor 06. How long you are dealing with MIDAS SAFETY? (a) Less than 1 year (b) 1-3 years (c) 4-7 years (d) 8-10 years (e) Above 10 years
- 70. 07. Whether the expected quantity of MIDAS SAFETY is supplied to you in time? (a) Yes (b) No 08. Do you have any complaints about MIDAS SAFETY? (a) Yes (b) No If yes, specify the reason, 09. Which factor enables you to be the dealer of MIDAS SAFETY? (a) Promotional Scheme (b) Quality (c) Company Policy (d) Margin (e) Service 10. What are the factors that you expect from MIDAS SAFETY? (a) Promotional Scheme (b) Sales follow-up (c) Service (d) Credit Facility 11. What do you feel about credit period given by MIDAS SAFETY? (a) Very Good (b) Good (c) Neutral (d) Poor (e) Very poor 12. How do you feel about MIDAS SAFETY transportation? (a) Highly Satisfied (b) Satisfied (c) Moderate (d) Dissatisfied (e) Highly Dissatisfied 13. What type of promotional activity do you prefer with MIDAS SAFETY? (a) Discount (b) Gift (c) Prize (d) Offers (e) Combo offers
- 71. 14. What do you think about Promotion Activities given by MIDAS SAFETY? (a) Very Good (b) Good (c) Neutral (d) Poor (e) Very poor 15. Which of the following media advertising are considered to be more effective? (a) Print media (b) Electronic media (c) Radio (d) out door advertisement (e) Any other media 16. What do you feel about the Price of MIDAS SAFETY? (a) Very High (b) High (c) Average (d) Low (e) Very low 17. Do you recommend your customers about MIDAS SAFETY? (a) Yes (b) No If Yes/No, specify the reason, 18. Do you have any suggestions to improve the quality of MIDAS SAFETY? (a) Yes (b) No If Yes/No, specify the reason, 19. What do you feel about Quality of MIDAS SAFETY? (a) Very Good (b) Good (c) Neutral (d) Poor (e) Very poor
- 72. 20. What do you feel about after sales service given by MIDAS SAFETY? (a) Highly Satisfied (b) Satisfied (c) Moderate (d) Dissatisfied (e) Highly Dissatisfied 21. Comparative to MIDAS which brand is better in promotional activity? (a) Jayco Safety Products (b) Industrial Safety Products (c) Fusion safety products (d) Honey well Pvt ltd (e) None of these …………………………………………………………………………