Baton Rouge Condos Townhomes Sales Up Prices Down In April 2014
•
0 likes•486 views

The number of for sale properties decreased 12% from April 2013 to April 2014, while the number of sold properties increased 6%. The median sold price decreased 7% over the same period. The average days on market for sold properties decreased 28%.

Recommended
Recommended
More Related Content
What's hot
What's hot (20)
Similar to Baton Rouge Condos Townhomes Sales Up Prices Down In April 2014
Similar to Baton Rouge Condos Townhomes Sales Up Prices Down In April 2014 (11)
More from Bill Cobb, Appraiser
More from Bill Cobb, Appraiser (20)
Recently uploaded
Recently uploaded (20)
Baton Rouge Condos Townhomes Sales Up Prices Down In April 2014
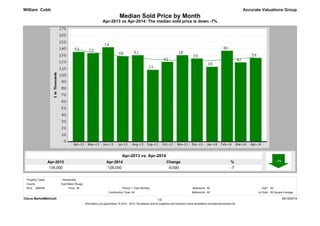
- 1. Apr-2014 126,000 Apr-2013 135,000 % -7 Change -9,000 Apr-2013 vs Apr-2014: The median sold price is down -7% Median Sold Price by Month Accurate Valuations Group Apr-2013 vs. Apr-2014 William Cobb Clarus MarketMetrics® 05/19/2014 Information not guaranteed. © 2014 - 2015 Terradatum and its suppliers and licensors (www.terradatum.com/about/licensors.td). 1/2 MLS: GBRAR Bedrooms: All All Construction Type: All1 Year Monthly SqFt: Bathrooms: Lot Size:All All Square Footage Period:All County: Property Types: : Residential East Baton Rouge Price:
- 2. Median Sold Price by Month Apr-2013 vs Apr-2014: The median sold price is down -7% Accurate Valuations GroupWilliam Cobb Sold Median Price Units Avg DOMTime Period Apr-14 126,000 56 97 Mar-14 119,192 42 96 Feb-14 136,750 40 83 Jan-14 112,500 36 116 Dec-13 125,000 39 92 Nov-13 130,000 18 93 Oct-13 120,000 41 154 Sep-13 108,000 23 84 Aug-13 130,000 61 123 Jul-13 128,500 68 120 Jun-13 142,000 74 107 May-13 133,000 72 159 Apr-13 135,000 53 150 Clarus MarketMetrics® 05/19/2014 Information not guaranteed. © 2014 - 2015 Terradatum and its suppliers and licensors (www.terradatum.com/about/licensors.td). 22/
- 3. Apr-2013 vs Apr-2014: The median price of for sale properties has not changed and the median price of sold properties is down -7% Accurate Valuations Group Apr-2013 vs. Apr-2014 126,900 0 William Cobb 127,250 Apr-2014 Median For Sale vs Median Sold ChangeApr-2013 % 350 Apr-2013 Apr-2014 % 135,000 -7 Apr-2013 vs. Apr-2014 126,000 Change -9,000 Clarus MarketMetrics® 05/19/2014 Information not guaranteed. © 2014 - 2015 Terradatum and its suppliers and licensors (www.terradatum.com/about/licensors.td). 1/2 MLS: GBRAR Bedrooms: All All Construction Type: All1 Year Monthly SqFt: Bathrooms: Lot Size:All All Square Footage Period:All County: Property Types: : Residential East Baton Rouge Price:
- 4. Median For Sale vs Median Sold Apr-2013 vs Apr-2014: The median price of for sale properties has not changed and the median price of sold properties is down -7% Accurate Valuations GroupWilliam Cobb For SaleMedian SoldMedian For Sale # Properties # PropertiesSold Price Difference Time Period Apr-14 536 56127,250 126,000 -1,250 Mar-14 517 42124,000 119,192 -4,808 Feb-14 516 40125,000 136,750 11,750 Jan-14 542 36125,900 112,500 -13,400 Dec-13 528 39125,000 125,000 0 Nov-13 537 18127,000 130,000 3,000 Oct-13 552 41126,450 120,000 -6,450 Sep-13 563 23125,000 108,000 -17,000 Aug-13 558 61124,900 130,000 5,100 Jul-13 561 68123,500 128,500 5,000 Jun-13 576 74122,950 142,000 19,050 May-13 581 72127,000 133,000 6,000 Apr-13 610 53126,900 135,000 8,100 Clarus MarketMetrics® Information not guaranteed. © 2014 - 2015 Terradatum and its suppliers and licensors (www.terradatum.com/about/licensors.td). 05/19/201422/
- 5. Apr-2014 56 Apr-2013 53 % 6 Change 3 Apr-2013 vs Apr-2014: The number of Sold properties is up 6% Sold Properties by Month Accurate Valuations Group Apr-2013 vs. Apr-2014 William Cobb Clarus MarketMetrics® 05/19/2014 Information not guaranteed. © 2014 - 2015 Terradatum and its suppliers and licensors (www.terradatum.com/about/licensors.td). 1/2 MLS: GBRAR Bedrooms: All All Construction Type: All1 Year Monthly SqFt: Bathrooms: Lot Size:All All Square Footage Period:All County: Property Types: : Residential East Baton Rouge Price:
- 6. Sold Properties by Month Apr-2013 vs Apr-2014: The number of Sold properties is up 6% Accurate Valuations GroupWilliam Cobb Time Period Units Median Price Avg DOM Apr-14 126,00056 97 Mar-14 119,19242 96 Feb-14 136,75040 83 Jan-14 112,50036 116 Dec-13 125,00039 92 Nov-13 130,00018 93 Oct-13 120,00041 154 Sep-13 108,00023 84 Aug-13 130,00061 123 Jul-13 128,50068 120 Jun-13 142,00074 107 May-13 133,00072 159 Apr-13 135,00053 150 Clarus MarketMetrics® 05/19/2014 Information not guaranteed. © 2014 - 2015 Terradatum and its suppliers and licensors (www.terradatum.com/about/licensors.td). 22/
- 7. Apr-2014 73 Apr-2013 78 % -6 Change -5 Apr-2013 vs Apr-2014: The number of Under Contract properties is down -6% Under Contract Properties by Month Accurate Valuations Group Apr-2013 vs. Apr-2014 William Cobb Clarus MarketMetrics® 05/19/2014 Information not guaranteed. © 2014 - 2015 Terradatum and its suppliers and licensors (www.terradatum.com/about/licensors.td). 1/2 AllBathrooms: SqFt: All : Residential All Square FootageConstruction Type: Lot Size:GBRAR East Baton Rouge Period: 1 Year Monthly Price: MLS: All AllAll Property Types: Bedrooms: County:
- 8. Under Contract Properties by Month Apr-2013 vs Apr-2014: The number of Under Contract properties is down -6% Accurate Valuations GroupWilliam Cobb Units Avg DOMMedian PriceTime Period Apr-14 122,00073 96 Mar-14 125,00055 115 Feb-14 141,95046 98 Jan-14 137,75044 97 Dec-13 132,25031 107 Nov-13 122,50029 92 Oct-13 128,40032 115 Sep-13 120,90034 121 Aug-13 117,50034 134 Jul-13 134,90053 125 Jun-13 126,40058 104 May-13 147,25074 130 Apr-13 136,25078 134 Clarus MarketMetrics® 05/19/2014 Information not guaranteed. © 2014 - 2015 Terradatum and its suppliers and licensors (www.terradatum.com/about/licensors.td). 22/
- 9. Apr-2014 104 Apr-2013 92 % 13 Change 12 Apr-2013 vs Apr-2014: The number of New properties is up 13% New Properties by Month Accurate Valuations Group Apr-2013 vs. Apr-2014 William Cobb Clarus MarketMetrics® 05/19/2014 Information not guaranteed. © 2014 - 2015 Terradatum and its suppliers and licensors (www.terradatum.com/about/licensors.td). 1/2 MLS: GBRAR Bedrooms: All All Construction Type: All1 Year Monthly SqFt: Bathrooms: Lot Size:All All Square Footage Period:All County: Property Types: : Residential East Baton Rouge Price:
- 10. New Properties by Month Apr-2013 vs Apr-2014: The number of New properties is up 13% Accurate Valuations GroupWilliam Cobb Units Median PriceTime Period Apr-14 145,500104 Mar-14 122,25078 Feb-14 127,42566 Jan-14 143,250114 Dec-13 118,50052 Nov-13 126,00060 Oct-13 124,90067 Sep-13 116,90097 Aug-13 142,90083 Jul-13 125,00083 Jun-13 119,950106 May-13 125,95088 Apr-13 129,94992 Clarus MarketMetrics® 05/19/2014 Information not guaranteed. © 2014 - 2015 Terradatum and its suppliers and licensors (www.terradatum.com/about/licensors.td). 22/
- 11. Apr-2014 536 Apr-2013 610 % -12 Change -74 Apr-2013 vs Apr-2014: The number of For Sale properties is down -12% For Sale Properties by Month Accurate Valuations Group Apr-2013 vs. Apr-2014 William Cobb Clarus MarketMetrics® 05/19/2014 Information not guaranteed. © 2014 - 2015 Terradatum and its suppliers and licensors (www.terradatum.com/about/licensors.td). 1/2 MLS: GBRAR Bedrooms: All All Construction Type: All1 Year Monthly SqFt: Bathrooms: Lot Size:All All Square Footage Period:All County: Property Types: : Residential East Baton Rouge Price:
- 12. For Sale Properties by Month Apr-2013 vs Apr-2014: The number of For Sale properties is down -12% Accurate Valuations GroupWilliam Cobb Units Avg DOMMedian PriceTime Period Apr-14 127,250536 208 Mar-14 124,000517 216 Feb-14 125,000516 211 Jan-14 125,900542 202 Dec-13 125,000528 223 Nov-13 127,000537 207 Oct-13 126,450552 197 Sep-13 125,000563 189 Aug-13 124,900558 219 Jul-13 123,500561 218 Jun-13 122,950576 211 May-13 127,000581 214 Apr-13 126,900610 208 Clarus MarketMetrics® 05/19/2014 Information not guaranteed. © 2014 - 2015 Terradatum and its suppliers and licensors (www.terradatum.com/about/licensors.td). 22/
- 13. Apr-2014 38 Apr-2013 39 % -3 Change -1 Apr-2013 vs Apr-2014: The number of Expired properties is down -3% Expired Properties by Month Accurate Valuations Group Apr-2013 vs. Apr-2014 William Cobb 05/19/2014Clarus MarketMetrics® 1/2 MLS: GBRAR Bedrooms: All All Construction Type: All1 Year Monthly SqFt: Bathrooms: Lot Size:All All Square Footage Period:All County: Property Types: : Residential East Baton Rouge Price:
- 14. Expired Properties by Month Apr-2013 vs Apr-2014: The number of Expired properties is down -3% Accurate Valuations GroupWilliam Cobb Avg DOMUnits Median Price Apr-14 146,00038 228 Mar-14 111,00030 213 Feb-14 119,00031 216 Jan-14 129,90048 188 Dec-13 149,90069 270 Nov-13 130,00032 174 Oct-13 125,00043 188 Sep-13 111,25044 201 Aug-13 110,90058 441 Jul-13 125,00033 261 Jun-13 128,25040 198 May-13 126,90037 209 Apr-13 115,00039 191 Clarus MarketMetrics® 05/19/2014 Information not guaranteed. © 2014 - 2015 Terradatum and its suppliers and licensors (www.terradatum.com/about/licensors.td). 22/
- 15. Apr-2013 vs Apr-2014: The number of for sale properties is down -12% and the number of sold properties is up 6% Accurate Valuations Group Apr-2013 vs. Apr-2014 610 -12 William Cobb 536 Apr-2014 Supply & Demand by Month ChangeApr-2013 % -74 Apr-2013 Apr-2014 % 53 6 Apr-2013 vs. Apr-2014 56 Change 3 Clarus MarketMetrics® 05/19/2014 Information not guaranteed. © 2014 - 2015 Terradatum and its suppliers and licensors (www.terradatum.com/about/licensors.td). 1/2 MLS: GBRAR Bedrooms: All All Construction Type: All1 Year Monthly SqFt: Bathrooms: Lot Size:All All Square Footage Period:All County: Property Types: : Residential East Baton Rouge Price:
- 16. Supply & Demand by Month Apr-2013 vs Apr-2014: The number of for sale properties is down -12% and the number of sold properties is up 6% William Cobb Accurate Valuations Group For Sale Sold # Properties Avg DOM Avg DOM # Properties Time Period Apr-14 208 97536 56 Mar-14 216 96517 42 Feb-14 211 83516 40 Jan-14 202 116542 36 Dec-13 223 92528 39 Nov-13 207 93537 18 Oct-13 197 154552 41 Sep-13 189 84563 23 Aug-13 219 123558 61 Jul-13 218 120561 68 Jun-13 211 107576 74 May-13 214 159581 72 Apr-13 208 150610 53 Clarus MarketMetrics® 05/19/2014 Information not guaranteed. © 2014 - 2015 Terradatum and its suppliers and licensors (www.terradatum.com/about/licensors.td). 22/
- 17. Apr-2014 96 Apr-2013 134 % -28 Change -38 Apr-2013 vs Apr-2014: The average days on market is down -28% The Average Days on Market by Month Accurate Valuations Group Apr-2013 vs. Apr-2014 William Cobb East Baton Rouge All 1 Year Monthly County: Period:Price: Property Types: : Residential 05/19/20141/2Clarus MarketMetrics® All Square Footage Bedrooms: All AllSqFt: All Lot Size:Bathrooms:AllConstruction Type: MLS: GBRAR
- 18. The Average Days on Market by Month Apr-2013 vs Apr-2014: The average days on market is down -28% Accurate Valuations GroupWilliam Cobb # UC UnitsAvg DOMTime Period Apr-14 7396 Mar-14 55115 Feb-14 4698 Jan-14 4497 Dec-13 31107 Nov-13 2992 Oct-13 32115 Sep-13 34121 Aug-13 34134 Jul-13 53125 Jun-13 58104 May-13 74130 Apr-13 78134 Clarus MarketMetrics® 2/2 05/19/2014 Information not guaranteed. © 2014 - 2015 Terradatum and its suppliers and licensors (www.terradatum.com/about/licensors.td).
- 19. Apr-2013 vs Apr-2014: The average months supply of inventory is down -8% Accurate Valuations Group Apr-2013 vs. Apr-2014 6.3 -8 William Cobb 5.8 Apr-2014 Months Supply of Inventory ChangeApr-2013 % -0.5 Clarus MarketMetrics® 05/19/2014 Information not guaranteed. © 2014 - 2015 Terradatum and its suppliers and licensors (www.terradatum.com/about/licensors.td). 1/2 MLS: GBRAR Bedrooms: All All Construction Type: All1 Year Monthly SqFt: Bathrooms: Lot Size:All All Square Footage Period:All County: Property Types: : Residential East Baton Rouge Price:
- 20. Months Supply of Inventory Apr-2013 vs Apr-2014: The average months supply of inventory is down -8% William Cobb Accurate Valuations Group During MonthLast Day of Month MSI # Units For Sale # UC Units UC Avg DOMTime Period Apr-14 73 96425 5.8 Mar-14 55 115432 7.9 Feb-14 46 98439 9.5 Jan-14 44 97450 10.2 Dec-13 31 107428 13.8 Nov-13 29 92476 16.4 Oct-13 32 115477 14.9 Sep-13 34 121485 14.3 Aug-13 34 134466 13.7 Jul-13 53 125475 9.0 Jun-13 58 104478 8.2 May-13 74 130470 6.4 Apr-13 78 134493 6.3 Clarus MarketMetrics® 05/19/2014 Information not guaranteed. © 2014 - 2015 Terradatum and its suppliers and licensors (www.terradatum.com/about/licensors.td). 22/