A study on performance of various gold funds
•
6 recomendaciones•4,053 vistas

There are lots of ways to go about investing in gold. Gold has shown to be quite a solid investment for many years. It is one of those investments where people are happy they elected for it most of the time. Even people who have never invested in anything in their lives are putting their money in gold. They are driven by many different reasons to preserve their wealth in this fashion. They can choose from any one of a number of different ways to invest in this precious metal. Plenty of people choose to invest their money in diverse fashions so that they can take advantage of the benefits of gold as well as the safety it provides.

Recomendados
Recomendados
Más contenido relacionado
La actualidad más candente
La actualidad más candente (20)
Destacado
Destacado (13)
Similar a A study on performance of various gold funds
Similar a A study on performance of various gold funds (20)
Más de Bella Meraki
Más de Bella Meraki (20)
Último
Último (20)
A study on performance of various gold funds
- 1. Table of Contents CHAPTER 1 .............................................................................................................................. 4 INTRODUCTION ................................................................................................................. 4 1.1 STATEMENT OF THE PROBLEM ........................................................................... 6 INDUSTRY PROFILE .......................................................................................................... 6 1. Bombay Stock Exchange: .............................................................................................. 7 2. National Stock Exchange (NSE):................................................................................... 7 3. Other stock exchanges in India ...................................................................................... 9 4. Stock market regulation. .............................................................................................. 10 5. Securities and Exchange Board Of India (SEBI) ......................................................... 10 COMPANY PROFILE ........................................................................................................ 12 1.2 RESEARCH METHODOLOGY................................................................................... 18 1.21 OBJECTIVES .......................................................................................................... 18 1.2.2 METHODOLOGY OF THE STUDY .................................................................... 19 1.2.3 RESEARCH DESIGN ............................................................................................ 19 1.2.4 STATISTICAL ANALYSIS TOOLS USED ......................................................... 19 1.2.5 PERIOD OF THE STUDY ..................................................................................... 21 1.2.6 DATA SOURCES .................................................................................................. 21 Primary Data .................................................................................................................... 21 1.3 SIGNIFICANCE OF STUDY ................................................................................... 22 1.4 LIMITATION OF THE STUDY ............................................................................... 22 1.5 CHAPTERIZATION ................................................................................................. 22 CHAPTER 2 ............................................................................................................................ 23 LITERATURE REVIEW .................................................................................................... 23 2.1 ETFs’ Performance Across Countries ....................................................................... 23 2.2 Mutual Fund Performance in India ............................................................................ 25 2.3 Gold ETF Overview ................................................................................................... 29 2.4 The Status of the Global Gold ETF ........................................................................... 30 References ................................................................................................................................ 32 CHAPTER 3 ............................................................................................................................ 34 DATA COLLECTION AND ANALYSIS .......................................................................... 34 BIRLA SUN LIFE GOLD ETF ....................................................................................... 34 CANARA ROBECO -GOLD ETF .................................................................................. 36 GOLDMAN SACHS ....................................................................................................... 38 HDFC GOLD ETF ........................................................................................................... 40 ICICI GOLD ETF ............................................................................................................ 42 1
- 2. IDBI GOLD ETF ............................................................................................................. 44 QUANTUM GOLD FUND ............................................................................................. 46 KOTAK GOLD ETF ....................................................................................................... 48 RELIANCE GOLD FUND .............................................................................................. 50 SBI GOLD FUND ........................................................................................................... 52 CORRELATION CO-EFFICIENT ..................................................................................... 54 CORRELATION CO-EFFICIENT OF STOCK RETURN AND MARKET RETURN 55 TREND RATIO ................................................................................................................... 65 BIRLA SUN LIFE GOLD ETF ....................................................................................... 65 CANARA ROBECO -GOLD ETF .................................................................................. 67 GOLDMAN SACHS ....................................................................................................... 69 HDFC GOLD ETF ........................................................................................................... 71 ICICI GOLD ETF ............................................................................................................ 73 IDBI GOLD ETF ............................................................................................................. 75 QUANTUM GOLD FUND ............................................................................................. 77 KOTAK GOLD ETF ....................................................................................................... 79 RELIANCE GOLD FUND .............................................................................................. 81 SBI GOLD FUND ........................................................................................................... 83 PERFORMANCE RANKING............................................................................................. 85 SHARPE RATIO ANALYSIS ........................................................................................ 85 TREYNOR RATIO ANALYSIS ......................................................................................... 88 JENSEN INDEX .................................................................................................................. 91 CHAPTER 4 ............................................................................................................................ 96 FINDINGS ........................................................................................................................... 96 SUGGESTIONS .................................................................................................................. 98 CHAPTER 5 ............................................................................................................................ 99 CONCLUSION .................................................................................................................... 99 References .............................................................................................................................. 100 2
- 3. 3
- 4. CHAPTER 1 INTRODUCTION Gold was first discovered as shining, yellow nuggets. "Gold is where you find it," so the saying goes, and gold was first discovered in its natural state, in streams all over the world. No doubt it was the first metal known to early hominids. Gold became a part of every human culture. Its brilliance, natural beauty, and luster, and its great malleability and resistance to tarnish made it enjoyable to work and play with. There are lots of ways to go about investing in gold. Gold has shown to be quite a solid investment for many years. It is one of those investments where people are happy they elected for it most of the time. Even people who have never invested in anything in their lives are putting their money in gold. They are driven by many different reasons to preserve their wealth in this fashion. They can choose from any one of a number of different ways to invest in this precious metal. Plenty of people choose to invest their money in diverse fashions so that they can take advantage of the benefits of gold as well as the safety it provides. The gold exchange traded fund is a burgeoning product to invest in gold. It has very positive significance as foreign exchange, financial safety and avoiding inflation to a country. At the same time, it is convenient to invest in gold exchange traded funds for small and mediumsized investors and extremely welcomed by market. However, most of the investors don’t understand gold exchange traded funds. Exchange-Traded Funds (ETFs) were first introduced in USA in 1993. About 60% of trading volumes on the American Stock Exchange are reported to be from ETFs. ETFs are referred to as passive schemes that fund managers resort to, to avoid risk and offer low-cost options to the investors. These funds rely on an arbitrage mechanism to maintain the prices at which they trade, in line with the net asset values of their underlying portfolios. Exchange Traded funds (ETFs) are open ended index funds that are listed and traded on exchanges like stock equity based on the price of metal. The first bonafide ETF was launched in US in 1993, a tradable depositary receipt for a portfolio of index stocks held in a unit investment trust. It was called the S&P Depositary Receipt, and it also tracked the S&P 500 Stock Index .The concept of Exchange-Traded Funds (ETFs) is very popular in foreign countries, but in India, it is still in the initial growth phase. As Exchange-Traded Funds 4
- 5. started growing in India since 2006, the investment industry required performance analysis of this newly available financial asset. Moreover, fund selection also requires investors to analyze returns, volatility and performance of the available funds. Performance of ETFs has been examined on the basis of their returns and risk characteristics. On an average in India, ETFs grew at 37% annually during 2006 -2011. These funds also generated excess returns of 3% p.a. as against CNX NIFTY, the Indian equity market’s bench mark. Gold ETFs provided 13% excess returns as compared to the returns on the equity market and attracted large investments in the post financial crisis years. In India, as on 31st May 2011, there are 25 large funds which represent the most recent gold funds as well as overseas fund of funds. The efficient funds were not found to be the large funds; however, they offered higher returns and have higher Sharpe ratios. According to the Association of Mutual Funds of India (AMFI) data, the Indian mutual fund (MF) industry has been holding Rs. 6.75 trillion worth of assets over the past decade. On an average, during 2006-2011, Indian ETFs comprised of only 1.4% of the total industry assets. In comparison, in the US, ETFs comprise about 9% of the MF industry. This trend often raises the query among the investors as to whether or not Exchange-Traded Funds (ETFs) will be able to perform well in India. In 2001, Benchmark was the first company to launch the first ETF in India - Nifty BeES, which was listed on the NSE for trade. In 2007, Benchmark also launched the first Gold Exchange-Traded Fund. The growth rate in ETFs was found to be higher than the industry growth rate during 2006 - 07. However, ETFs did not continue to grow at that pace in the post financial crisis period. While in 2006-07, the share of ETFs in the total industry was about 3%, it fell subsequently and the average is around 1.4%. Gold ETFs have gained greater significance as successful mean of investment in the last decade. The recent global financial crisis increased the demand for gold hedge. The major data of the world seven largest gold ETFs indicates that, the total holdings of the world's seven largest golden ETFs are 1383.8 tons. The gold ETF (exchange-traded index funds) provides a convenient way to the investors to intervene in the gold market. The purpose of this study was to analyze the performance of ETFs in financial market, particularly the Gold ETFs. The study is designed to serve as a tool for investors searching the opportunities in gold ETFs. 5
- 6. 1.1 STATEMENT OF THE PROBLEM Gold commodity exchange traded funds are a simple way to expose your investment strategy to the performance of gold, without actually owning any gold products. There are many types of gold ETFs. Often investors encounters difficulty to take apt investment decision in gold fund. It is seen that investors fail to select proper gold fund for their portfolio .This study aims to suggest suitable methods and evaluation for selecting proper gold fund for their portfolio. INDUSTRY PROFILE The purpose of a stock exchange is to facilitate the exchange of securities between buyers and sellers, thus providing a marketplace. it is important just like the networks for transport, electricity and telecommunications function properly so is it essential that, for example, payments can be transacted, capital can be saved and channeled to the most profitable investment projects and that both households and firms get help in handling financial uncertainty and risk as well as possibilities of spreading consumption over time. Financial markets constitute an important part of the total infrastructure for every society that has passed the stage of largely domestic economies The financial system performs three main tasks: first, it handles transfer of payments; second, it channels savings to investments with a good return for future consumption; and third, it spreads and reduces economic risks in relation to the players targeted returns. The stock market is one of the most important sources for companies to raise money. Experience has shown that the price of shares and other assets is an important part of the dynamics of economic growth. Rising share prices, for instance, tend to be associated with increased business investment and vice versa. Indian stock markets are one of the oldest in Asia. Its history dates back to nearly 200 years. Mainly there are two stock exchanges in India Bombay stock exchange (BSE) and National stock exchange (NSE). 6
- 7. 1. Bombay Stock Exchange: The Bombay Stock Exchange Limited popularly called BSE is the oldest stock exchange in Asia It is located at Dalal street Mumbai. Bombay stock exchange was established in 1875.There are around 5000 Indian companies listed in the stock exchange. As of July 2005, the market capitalisation of the BSE was about Rs.20 trillion i.e. US $ 466 billion. The BSE SENSEX is the short form of SENSitive indEX also called the BSE 30. It is a widely used market index in India and Asia. As of 2005, it is among the 5 biggest stock exchanges in the world in terms of transactions volume. Along with the NSE the companies listed on the BSE have a combined market capitalisation of US$ 125.5 billion.In 1990 the BSE crossed the 1000 mark for the first time. It crossed 2000, 3000 and 4000 figures in 1992. The up-beat mood of the market was suddenly lost with Harshad Mehta Scam. BSE Sensex The BSE SENSEX also known as the BSE 30 is a value-weighted index composed of 30 scrips, with the base April 1979 = 100. The set of companies which make up the index has been changed only a few times in the last 20 years. These companies account for around onefifth of the market capitalization of the BSE. Apart from BSE SENSEX, BSE uses other stock indices as well. BSE 500 BSEPSU BSEMIDCAP BSESMLCAP BSEBANKEX 2. National Stock Exchange (NSE): The National Stock Exchange of India (NSE) is one of the largest and most advanced stock markets in India. The NSE is the world's third largest stock exchange in terms of transactions. It is located in Mumbai. The National Stock Exchange of India was promoted by leading Financial Institutions on behalf of the Government of India. It was incorporated in November 1992 as a tax-paying company. In April 1993 it was recognized as a stock exchange under the Securities Contracts Regulation Act 1956. NSE commenced operations in the Wholesale 7
- 8. Debt Market (WDM) segment in June 1994. The Capital Market (Equities) segment of the NSE commenced operations in November 1994. NSE has remained in the forefront of modernization of India's capital and financial markets, and its pioneering efforts include: Being the first national, electronic limit order book (LOB) exchange to trade securities in India. Because of the success of NSE the existent market and new market structures have followed the "NSE" model. Setting up the first clearing corporation "National Securities Clearing Corporation Ltd." in India. NSCCL was a landmark in providing novation on all spot equity market and later derivatives market trades in India. Co-promoting and setting up of National Securities Depository Limited, first depository in India. Setting up of S&P CNX Nifty. NSE pioneered commencement of Internet Trading in February 2000, which leads to the wide popularisation of the NSE in the broker community. Being the first exchange to trade ETFs i.e. exchange traded funds in India. NSE brings an integrated stock market trading network across the nation. Investors can trade at the same price from anywhere in the country since inter-market operations are streamlined coupled with the countrywide access to the securities. Delays in communication, late payments and the malpractice’s prevailing in the traditional trading mechanism can be done away with greater operational efficiency and informational transparency in the stock market operations, with the support of total computerized network. Currently NSE has the following major segments of the capital market: Equity Futures and Options Retail Debt Market Wholesale Debt Market 8
- 9. Wholesale debt market operations are similar to money market operations, institutions and corporate bodies enter into high value transactions in financial instruments such as government securities, treasury bills, public sector unit bonds, commercial paper, certificate of deposit etc. Indices NSE also set up as index services firm known as India Index Services & Products Limited (IISL) and has launched several stock indices, including: S&P CNX Nifty CNX Nifty Junior CNX 100 S&P CNX 500 CNX Midcap 3. Other stock exchanges in India Ahmedabad Stock Exchange Bangalore Stock Exchange Bhubaneswar Stock Exchange Association Calcutta Stock Exchange Cochin Stock Exchange Coimbatore Stock Exchange Delhi Stock Exchange Association Gauhati Stock Exchange Hyderabad Stock Exchange Inter-connected Stock Exchange of India Jaipur Stock Exchange Ludhiana Stock Exchange Association Madhya Pradesh Stock Exchange Madras Stock Exchange 9
- 10. Mangalore Stock Exchange Mumbai Stock Exchange OTC Exchange of India Pune Stock Exchange Saurashtra-Kutch Stock Exchange Uttar Pradesh Stock Association Vadodara Stock Exchange 4. Stock market regulation. It was well recognized that protection of investors calls for the regulation of issues of securities and of markets where securities are traded. The securities market is sustained by the confidence of the investors; the confidence of the investors that their invested capital will not be subject to dishonest and unfair practices. An important objective of the regulation of the securities market is thus protection of the investors from dishonesty, fraud and unfair practices. Securities markets in India have a hoary past, but in recent years they have gained importance due to the rapid expansion in the quantum of funds raised and number of investors in the primary market, the increase in the number of stock exchanges and listed stocks, the speedy rise in capitalization and volume of trade and the entry of sophisticated investors such as foreign institutional investors, collective investment schemes like mutual funds and finance companies. The principal legislations governing directly or indirectly the security markets Are the Securities Contract (regulation) Act 1956 and the Securities Exchange Board of India Act 1992. 5. Securities and Exchange Board Of India (SEBI) SEBI was established under the Securities Exchange Board of India Act in 1998 to regulate and develop the growth of the Indian capital market. SEBI regulates the working of the stock exchanges and intermediaries such as stock brokers and merchant bankers, accords approval 10
- 11. for mutual funds and register foreign institutional investors who wish to trade in Indian scrip’s. The guiding principles of the regulation are defined to include: Equality of treatment and opportunity to all the shareholders. Transparency in acquisition of shares. Protection of rights for small and minority shareholders. Avoidance of use of price sensitive information concerning a public offer by all persons privy to confidential information for their own profit. Since its inception SEBI has been working targeting the securities and is attending to the fulfillment of its objectives with commendable zeal and dexterity. The improvements in the securities markets like capitalization requirements, margining, establishment of clearing corporations etc. reduced the risk of credit and also reduced the market. SEBI has introduced the comprehensive regulatory measures, prescribed registration norms, the eligibility criteria, the code of obligations and the code of conduct for different intermediaries like, bankers to issue, merchant bankers, brokers and sub-brokers, registrars, portfolio managers, credit rating agencies, underwriters and others. It has framed bye-laws, risk identification and risk management systems for Clearing houses of stock exchanges, surveillance system etc. which has made dealing in securities both safe and transparent to the end investor. Another significant event is the approval of trading in stock indices (like S&P CNX Nifty & Sensex) in 2000. A market Index is a convenient and effective product because of the following reasons: It acts as a barometer for market behavior; It is used to benchmark portfolio performance; It is used in derivative instruments like index futures and index options; It can be used for passive fund management as in case of Index Funds. Many players have entered the market for the distribution of financial products. These range from small local financial advisors to large distribution companies with presence all across the country. The companies that are in the financial services industry include IL&FS 11
- 12. Investsmart, Indiabulls, JM Financial Securities, Geojit Financial Services, JRG securities Ltd, Fortis Securities etc. Many of these have companies have come up with IPO’s in the last few years and some of these companies are entering to new businesses. The turnover of these companies is on an increasing trend since the capital market is on a buoyant phase. The companies are also going for the distribution of new products. Several banks have also begun the business of distribution of these products through their branches or have established separate divisions to handle this operation. At present Foreign Institutional Investors (FII) are investing in Indian stock market in a large way. The booming economy with high GDP growth is attracting FIIs to Indian market. All these are good indicators for the financial services industry. COMPANY PROFILE Capstocks is a professionally managed stock broking company having an unblemished and unparalleled service history of more than 23 years and a vibrant tradition of trust, loyalty and reliability. Capstocks was started by Rajendran.V, the present Managing Director of the company, in the year 1989. Capstocks is having both online and offline trading facilities. It is the first ISO 9001:2008 certified stock broking firm in India for all services in stock broking and allied activities. Capstocks has about 180 outlets in various states of India . Capstocks is a member of the National Stock Exchange of India (NSE), Bombay Stock Exchange (BSE), MCX Stock Exchange (MCX-SX), Depository Participant with the Central Depository Services (CDSL) and a SEBI-registered Portfolio Manager. Capstocks also offers commodity services through its subsidiaries Capstocks Finanacial Services Ltd which is a member of the Multi-Commodity Exchange of India (MCX) and Capstocks Commodities Pvt Ltd which is a member of National Commodity Derivative Exchange (NCDEX), National Multi-Commodity Exchange of India Ltd (NMCE) and National Spot Exchange of India Ltd (NSEL). 12
- 13. Management The Company's Management rests on: • Rajendran. V. (Chairman & Managing Director) Engineer by profession, with in-depth knowledge and experience in market analysis. • Leela Jeyakumar (Director) Post Graduate with over 18 years experience in stock broking and the in charge of company's Tamil Nadu operation since 1992. • Meera Sahib. B (Director) Post Graduate with LLB & CAIIB and 28 years of experience in officer / executive cadre in a major Public Sector Bank • Amjad Hydari (Vice President) Post Graduate with more than 14 years experience in various functions of the equity market brokerage. •Other Directors Srinivasan S.IAS. (Director) Former Labor Commissioner and District Collector. Presently, Chairman and Managing Director, ODEPEC. Prema Rajendran (Director) Graduate in Commerce with more than 12 years experience. Rajeev Pillai (Executive Director) Engineer By Profession with wide exposure to International business organisations and consulting firms. Currently heading the North & West India Operations of Capstocks with head quarter at Mumbai. Besides we have an excellent pool of trained & dedicated professional staff, three fourth of them are certified by NCFM, NISM, BCSM, BCDM Examinations. Services offered 1. Online trading Capstocks has a network of branches with online terminals of NSE and BSE in the Capital market and Derivative segments. Our clients are assured of prompt order execution through dedicated phones and expert dealers at our offices. 2. Internet trading Capstocks offers Internet trading through this site. You can trade through the Internet from the comforts of your office or home, anywhere in the world. Our dedicated IT systems ensure service up time and speed, making Internet broking through Capstocks hassle-free. 13
- 14. Using the 'easiest' facility provided by CDSL, our clients can transfer the shares sold by them online without delivery instruction slips. Additionally, digitally signed contract notes can be sent to clients through E-mail. 3. Depository Services Capstocks is a member of the Central Depository Services Limited (CDSL), offer depository services with minimum Annual Maintenance Charges and transaction charges. Account holders can view their holding position through the Internet. We also offer the " e asi est " facility provided by CDSL (electronic access to securities information and execution of secured transaction ) through which clients can give delivery instructions via the Internet. 4. Derivative Trading We offer trading in the futures and options segment of the National Stock Exchange(NSE). Through the present derivative trading an investor can take a short-term view on the market for upto a three months’ perspective by paying a small margin on the futures segment and a small premium in the options segment. In the case of options, if the trade goes in the opposite direction the maximum loss will be limited to the premium paid. 5. Knowledge Centre Knowledge Centre activities are intended to provide systematic and structured services mainly to new investors and also to young aspirant aiming for a career in financial markets. The centre has three functional areas: the publication Division, the Training centre, and wealth management advisory service which provide complete investment solutions to investors through knowledge based personalized service. 6. Equity Research Department We have a full-fledged Investment Research & Analysis Department to help our clients to make investment decisions. Our clients can get information on any share they hold or plan to purchase. We publish a monthly newsletter' CAPSTOCKS INFOLINE ' , which contains our views on the latest trends in the markets, scrip recommendation, tutorials, news items etc. We 14
- 15. also issue a daily newsletter, ' CAPS TREND ', which is available in our site . Besides we give intraday calls by SMS, chat, etc. You can avail yourself of this service by calling :+91471-2468160, 4013887 7. Portfolio Management services Capstocks is a SEBI-approved portfolio manager offering discretionary and non-discretionary schemes to its clients. Capstocks’ portfolio management team keeps track of the markets on a daily basis and is exposed to a lot of information and analytic tools which an investor would not normally have access to. Other technicalities pertaining to shares like dividends, rights, bonus, buy-back, Mergers and Acquisitions are also taken care of by us. Maximize your returns by opting for our PMS scheme. Please Call +91-471- 4013887,4013882 8. Commodity Trading You can trade in commodity futures like gold , silver, crude oil , rubber etc. and take advantage of the extended trading hours (10 am to 11 pm ) in commodities trading. Do, please Call +91-471- 4013891,9847917187. 9. Mutual Funds, Bonds etc. We also offer Mutual Funds and Bonds. You can select from a wide range of Mutual Funds and Bonds available in the markets today. You can get the service by Calling : +91-4714013885,4013886,98473 19187. 10. NRI CELL We have a well-organized NRI Cell functioning exclusively to meet the requirements of our clients residing outside India. We are committed to provide them timely assistance by placing their orders, giving them valuable suggestions concerning their investments etc. Also we help those NRI’s who desire to open accounts on repatriation basis. Facilities are offered to those clients who are interested in Internet trading by activating it, in co-ordination with the etrading department. 15
- 16. 11. Currency Trading Capstocks is a member of currency derivatives segment of National Stock Exchange (NSE) and MCX Stock Exchange (MCX-SX). Currency Derivatives are a new asset class which was earlier not permitted for trading to all Indian residents. Currently the trading is based on four underlying currencies viz., US Dollar, Euro, Pound sterling, Japanese Yen. Please Call +91471-4093343, 09961886876. 12. Pan Service Agent of UTI Capstocks & Securities (India) Pvt. Ltd. has become authorized PAN card service agent (PSA) of UTI. Now pan applications can be submitted to any of the following offices, in addition to Head office.( Sasthamangalam, Sreekaryam, Technopark, and Pattom, in Trivandrum) Kollam, Alappuzha, Thiruvalla, Ernakulam, Thrissur, Irinjalakkuda, Thodupuzha, Calicut, Chennai RO, Mangalore, Navi Mumbai, and Nagercoil RO. Capstocks offers this value added service to our privileged customers, existing as well as new customers at nominal processing charges. * Through subsidiary company Capstocks Financial Services Ltd ISO Certification Capstocks has become the first ISO 9001:2008 brokerage in India to get certification for all stock broking and related financial service activities including Cash Markets, Derivatives, Internet Trading, Depository Services, Portfolio Management Services, Equity Research and Analysis, NRI Client Cell and Mutual Funds. The certification was obtained from the renowned United Kingdom Accreditation Services (UKAS), based on the Assessment by Moody International Certification Group through ICL Certifications Ltd. The certificate was handed over at a function held in Trivandrum. Mr. Ashok Kumar Rout, Chief Operating Officer of the Bombay Stock Exchange Ltd., was the Guest of Honour on the occasion. Mr. Rajendran V, our Managing Director, received the certificate from Mr. Uwe Saelzle, Director of Moody International Certification Group, Germany, in the presence 16
- 17. of Mr. Sanjeev Chadha, CEO, ICL Certifications Ltd., handling the Indian operations of the Moody International Certification Group. Mr. Dilip Jacob Mathew, our Vice President, handled ISO 9001:2008 implementation as the Management Representative with assistance from Ms. Sangeetha, Sr. Executuve (QMS), and Mr. M. Pradeep Kumar, Management Systems Consultant and Trainer. A dedicated team of Managers and Executives, trained as Internal Quality Auditors in Capstocks, was involved in the Internal Assessments and improvement processes. Commenting on the certification, Rajendran V, our Managing Director said “We spent nearly 15 months to complete the ISO 9001:2008 certification process. There is a sea change in the organizational efficiency and day-to-day operations in our Company. The process flow and our organizational structure from top to bottom have been totally streamlined and the benefits will definitely be reflected in offering better services with the utmost satisfaction to our clients. As a result of ISO 9001:2008 implementation programme, Capstocks - having 75 branches covering India and else where - has been able to improve continually its systems, processes and procedures at the Head Office and its Branches with better review mechanisms. With the ISO 9001:2008 recognition under our belt, Quality of Documentation and Communication has improved. Capstocks will maintain the Quality Management System and also continually improve the quality of service through regular Management Reviews and Internal Quality Audits. As part of this project, emphasis is being given to imparting effective training and retraining for Capstocks Team Members and systematic analysis of activities. Capstocks Knowledge Centre Inaguration Capstocks has envisioned a series of programmes to spread awareness of the financial sector among its investors and the public, through the ‘Capstocks Knowledge Centre’ which was inaugurated by Shri. R.K. Nair, Executive Director, SEBI. Capstocks has been organizing awareness sessions on the financial sector – especially related to the stock market – for investors, students and everyone with an interest in the market. With the launch of knowledge Centre, we intend to provide systematic and structured service mainly to new investors and also to young aspirants aiming for a career in financial markets. This Centre which is presumed to be the first of its kind in India providing a comprehensive knowledge – based service to investors for all their investment needs shall have its headquarter at Trivandrum. 17
- 18. The booming Indian economy and the varied options in the investment scenario have definitely attracted people’s attention but most people do not have a basic understanding of the sector and hence, they are unable to take advantage of many investment and job opportunities. The Capstocks Knowledge Centre has three functional areas: the publication division, the training centre and the wealth management service. 1.2 RESEARCH METHODOLOGY Financial research can be a systematic and organized effort to investigate into a problem encountered in the investment scenario. It comprises a series of theoretical concepts designed and executed, with the goal of finding answers to the issues that are of concern to the manager and the work environment. The first step in the process is to identify the problem areas that exist in the selection of securities. Once the problem is clearly identified the next step is to gather information analyze the data, and determine the factors that are associated with the problem and solve it by taking necessary corrective actions. The entire process by which we attempt to solve the problem is called research. Thus research involves a series of well thought out and carefully executed actions that will enable the manager to know how organizational problems can be solved. Research thus encompasses the process of enquiry, investigation, examination and experimentation. These processes are to be carried out critically, objectively, and logically. 1.21 OBJECTIVES Primary objective To find out the performance of various gold fund. Secondary Objective To evaluate growth and decline of gold fund. To analyze risk associated with gold fund. To find out most promising gold fund. To study on interrelationship between stock return and market return of gold fund. 18
- 19. 1.2.2 METHODOLOGY OF THE STUDY The project is designed as analytical in nature to know and familiarize with gold fund and other shares to Indian investors and its related implications in the share market. Research methods and techniques that are found suitable are used for conducting this research. It helped in arriving at solutions by analyzing and relating available data with unknown aspects of the problem. 1.2.3 RESEARCH DESIGN Research design stands for the framework of research. The research design utilized in this study is analytical. For that various statistical tools as well as Microsoft excel tools are being used here. 1.2.4 STATISTICAL ANALYSIS TOOLS USED TREND RATIO Trend signifies tendency. Therefore, review and appraisal of tendency in accounting variables is simply called trend analysis. It can be calculated with the formula Current period x 100 Base period CORRELATION COEFFICIENT Co- efficient of correlation is an algebraic method of measuring the correlation. Under this method, we measure correlation by finding a value known as co-efficient of correlation using an appropriate formula Formula = r= n ∑xy - ∑x x∑ y ____________________________ √n∑x2- (∑x2) √n∑y2 – (∑y2) 19
- 20. STANDARD DEVIATION Standard deviation (represented by the symbol σ) shows how much variation or "dispersion" exists from the average (mean, or expected value). It can be calculate with the formula = x2 n x n 2 BETA Beta is a statistical tool which measures the systematic risk associated with a security. This can be done with the formula β= nxy - (x . y) nx2 – (x)2 SHARP INDEX The Sharp Ratio or Sharp Index is a measure of the excess return per unit of risk in an investment asset or a trading strategy. The Sharp Ratio is used to characterize how well the return of an asset compensates the investor for the risk taken. When comparing two asset each with the expected return Rf, the asset with the higher sharp ratio give more return for the same risk. Investors are often advised to pick investments with higher Sharp ratios. Sharp index = Rp – Rf 20 × 100
- 21. TREYNOR INDEX The TREYNOR Ratio is a measurement of the returns in excess of that which could have been earned on a riskless investment. It is also known as reward to volatility ratio. The ratio related excess return over the risk free rate to the additional risk taken. However, systematic risk invested of total risk is used. The higher the ratio the better the performance under analysis. Treynor index = Rp – Rf × 100 β MARKET VALUE Market value / Market price is economic price for which a good or service is offered in the market place. It is of interest, mainly in study micro economics. Market value and Market price are equal only under conditions of market efficiency, equilibrium and national expectations. 1.2.5 PERIOD OF THE STUDY The study is conducted for a period of 30 days commencing from 11 th February 2013 to 15th April 2013. Data collected is for a period of 1st January to 30th March. 1.2.6 DATA SOURCES For carrying out the study, both primary and secondary data are required. The methods of data collection are as follows: Primary Data Primary data are those data which are collected for the first time and this is happen to be original in character .Here primary data was collected through direct personal interview with research heads and other officials of Capstocks. 21
- 22. Secondary Data Secondary data involves the existing information available for the study. It comprises of : Details were obtained from company files ,records and documents Various published books, journals and news papers Web pages of NSE, BSE 1.3 SIGNIFICANCE OF STUDY The study intended for a period of one month from March 11 to April 15, 2013. This study will help to understand the performance of gold fund. Number of first-time investors look at gold as the only way to preserve their wealth in a period before inflation sets in. It's important for investors to familiarize themselves with the differences between products to ensure they are making appropriate investment decisions. Gold fund is a mutual fund or exchange-traded fund (ETF) that invests primarily in gold-producing companies or gold bullion. 1.4 LIMITATION OF THE STUDY Research is done on the historical data collected from NSE Due to time constraints other strategies. could not be studied Brokerage cost are not taken into consideration Taxes are not taken into consideration. 1.5 CHAPTERIZATION The report is made up of following chapters Chapter 1: Introduction Chapter 2: Literature review Chapter 3: Data collection and analysis Chapter 4: Findings & Recommendations Chapter 5: Conclusion 22
- 23. CHAPTER 2 LITERATURE REVIEW 2.1 ETFs’ Performance Across Countries The existing evidence in the literature on performance of ETFs is mixed. While there were many papers reporting negative performance of ETFs, there were others that presented strong positive evidence about the performance of ETFs. Adjei Frederick (2009) found no significant difference between the performances of the ETFs and the S&P 500 index. He found weak evidence of performance persistence on both the half-yearly and the yearly horizons. Johnson (2009) reported the existence of tracking errors between foreign ETFs and the underlying home index returns. Blitz David et al. (2010) investigated the performance of index mutual funds and the ETFs that are listed in Europe. They found that European index funds and ETFs underperform their benchmarks by 50 to 150 basis points per annum. William (2009) found the existence of tracking errors between foreign ETFs and theunderlying home index in US. Blitz David and Huij (2011) evaluated the performance of ETFs that provide passive exposure to global emerging markets (GEM) equities and found that GEM ETFs exhibit higher tracking error. Houweling (2011) found that treasury ETFs were able to track their benchmark but investment grade corporate bond ETFs and high yield corporate bond ETFs underperform their benchmarks. Charupat & Miu (2011) analyzed the performance of leverage ETFs, and concluded that price deviations are small among leverage ETFs and that price volatility is more, as a result of rebalancing, at the end of the day. Patrick (2011) found that in Hong Kong the magnitude of tracking errors is negatively related to the size but positively related to the expense ratio of the ETFs. He further commented that replicating the performance of underlying securities involves more risk, since they have a higher tracking error than in the US and Australia. 23
- 24. Chang and Krueger (2012) investigated the performance of Exchange-Traded Funds and Closed-End Funds over the 2002 to 2011 period. They studied investment results such as returns, risks and risk-adjusted returns and found that though ETFs have significantly lower expenses, their performance is statistically worse than those of close-ended funds. On the contrary, there was equal evidence of positive performance of ETFs. Ching-Chung et.al. (2005) indicated that the Taiwanese ETF and, the Taiwan Top 50 Tracker Fund (TTT) are price efficient and trading on them produces almost identical returns to the Taiwan stock market. Joel et al. (2006) compared the risk and return performances of ETFs available for foreign markets and closed-end country funds. They found higher mean returns and Sharpe ratios for ETFs, and concluded that a passive investment strategy through ETFs is observed to be superior to an active investment strategy using closely held country funds. Huang and Guedj (2009) investigated as to whether an Exchange-Traded Fund (ETF) is a more efficient indexing vehicle than an Open-Ended Mutual Fund (OEF). They noted that ETFs are better suited for narrower and less liquid underlying indexes, and also for investors with long investment horizons. Jack et al. (2009) indicated that the US ETFs are more likely to trade at a premium than at a discount, with comparatively large daily price fluctuations. Gerasimos (2011) found that ETFs trade at a premium from their Net Asset Value (NAV) and the pattern of their returns can be predicted. Meric et al. (2009) reported that from October 9, 2007 to March 9, 2009, the U.S. stock market experienced the worst bear market and lost about 56% of its value during this period. They compared the performances of 38 sector index funds using the Sharpe and Treynor portfolio performance measures and found that the healthcare and consumer staples sector index funds had the best performance and the financials and home construction sector index funds had the worst performance in the October 9, 2007-March 9, 2009 bear market run. Wong and Shum (2010) examined the performances of 15 worldwide ETFs across bearish and bullish markets over the period 1999 to 2007. They observed that ETFs always provide higher returns in a bullish market than in a bearish market. They noted from the Sharpe ratios that ETF returns are not positive and proportional to the market volatility. 24
- 25. Yuexiang et al. (2010) investigated the pricing efficiency of the Shanghai 50 ETF (SSE 50 ETF), the first Exchange-Traded Fund (ETF) in China. They demonstrated that ETF market prices and their Net Asset Values are co-integrated and there is a unidirectional causality from price to NAV. They also found that the fund’s prices did not closely follow the NAV during the second half of 2007, when the Chinese stock market experienced substantial volatility, reflecting sudden increased market risks as well as potential arbitrage opportunities during financial turbulences. Gerasimos (2011) found that the performance of ETFs is predictable and the return superiority is persistent in the short term level. This mixed evidence about performance of ETFs across developed as well as emerging economies warrants and motivated the present research about the performance of ETFs in India. 2.2 Mutual Fund Performance in India There are many research papers on the Indian mutual fund (MF) industry. Sivakumar et al. (2010) observed that private players were able to mobilize greater resources in the Indian MF industry than public institutions. Jaspal Singh (2004) evaluated the performance of various mutual funds and found that ICICI prudential floated and managed by a private AMC is the best performer in India. Madhumita et al. (2008) evaluated the performance of mutual funds on the basis of rate of returns as well as risk-adjusted methods, and found that the majority of equity funds outperformed the benchmark index. Most of these studies evaluated the growth and performance of equity funds, but there is no paper on Exchange-Traded Funds in India. A company that collected money from a group of people with common investment objectives to buy different securities is called mutual fund. The collected holding of these securities was known as its portfolio Mark (2007). According to Teri (2007) mutual fund is a professional investment company which managed collection of stocks, bonds, or other securities owned by a group of investor. Each mutual fund had a fund manager who purchased and sold the fund’s investment according to the fund goals. Fund managers were responsible to analyze the economic conditions, industry trends, government regulations and the impact on stocks before selecting the securities for investment. Mutual funds provided investment facility to the small investors who cannot afford to invest the large sums of money Teri (2007). Basically these small investors invested money into a common fund and handover the investment decision to fund manager. Many people often 25
- 26. regard the beginning of Foreign and Colonial Government Trust as the beginning of modern day mutual funds. But the beginning of mutual funds dates back to Seventeenth century when the first "pooling of money" for investments was done in 1774. Following the financial crisis of 1772-1773 a Dutch merchant Ketwich invited investors to come together to form an investment trust under the name of Eendragt Maakt Magt David (2007). The purpose of the trust was to provide diversification at low cost to the small investors. In order to spread risk, the fund invested in various countries such as Austria, Denmark, German States, Spain, Sweden, Russia etc. In 18th century Amsterdam Stock Exchange had only a small number of listed equities due to which the trust invested only in bonds. However after war with England many colonial bonds defaulted due to which there was sharp decline in the investments. As a result, share redemption was suspended in 1782 and later the interest payments were decreased too. The fund was no longer attractive for investors and vanished. These early mutual funds before heading to the United States took root in England and France in the 1890s. On the other hand “Massachusetts Investors' Trust of Boston” was the first open-end fund Formed in 1924. The growth of pooled investments was hampered by stock market crash of 1929 and the Great Depression but Securities Act of 1933 and Company Act of 1940 restored investor’s confidence and industry witnessed steady growth after that. Several measures are used in the literature on mutual fund performance evaluation but there is (still) a large controversy around them. Some of the important risk-adjusted techniques include the Sharpe (1966) measure, the Treynor (1965) measure and the Jensen (1968) measure. These measures were frequently called traditional measures of performance evaluation and were based on the idea that the combination of any portfolio with the risk-free asset is located in the expected return or beta space. The Jensen measure has been the most commonly used performance measure in academic and non-academic empirical studies. On the other hand Sharpe’s reward-to-variability ratio was also very popular and was frequently used by the researchers. Some of the empirical work on the performance of mutual funds was given below. Sharpe (1966) introduced the measure to evaluate the mutual funds’ risk-adjusted performance. The measure was known as reward-to-variability ratio (Currently Sharpe Ratio). With the help of this ratio he evaluated the return of 34 open-end mutual funds in the 26
- 27. period 1945-1963. The results showed the capital market was extremely efficient due to which majority of the sample had lower performance as compared to the Dow Jones Index. Sharpe (1966) found that from 1954 to 1963 only 11 funds outperformed the Dow-Jones Industrial Average (DJIA) while 23 funds were outperformed by the DJIA. Study concluded that the mutual funds were inferior investments during the period. Previously two- and three-moment analyses were used to analyze the mutual fund performance relative to market performance. But Joy and Porter (1974) applied first-, second, and third-degree stochastic dominance principles to investigate the same question. Study suggested that the proper test of mutual fund performance relative to the market (DJIA) is a test employing stochastic dominance principles. Such a test necessitates a pair wise comparison between each fund and the DJIA. Therefore Joy and Porter (1974) collected the performance data for the 34 funds analyzed by both Sharpe (1966) and Arditti (1971) for the ten-year period 1954-1963. Price and dividend data were also collected for the DJIA over the same period. Study supported the earlier Sharpe (1966) study and opposed the Arditti (1971) work and concluded that mutual fund performance was inferior to market performance over the period 1954-1963. In today’s financial markets exchange traded funds (ETFs) are considered a highly valuable mean of investment. The ETFs has emerged as most successful innovation and ETFs industry shown rapid growth in last decade, with a 5-year average annual growth rate of 33 percent (Schuster, 2008). Fuhr (2001) described that almost two or three ETFs are on the list of the top five most actively traded stocks in the AMEX. ETFs are an extremely successful form of basket securities, which enable investors to trade a portfolio easily and quickly in a single transaction. Further, exchange traded funds permit investors to obtain the benefits of portfolio diversification and track the performances of underlying indexes without incurring high transaction costs (Lin et al, 2006). S.Narayan Rao , et. al., evaluated performance of Indian mutual funds in a bear market throughrelative performance index, risk-return analysis, Treynor’s ratio, Sharpe’s ratio, Sharpe’smeasure , Jensen’s measure, and Fama’s measure. The study used 269 open-ended schemes (outof total schemes of 433) for computing relative performance index. Then after excluding fundswhose returns are less than risk-free returns, 58 schemes are finally used for further analysis. Theresults of performance measures suggest that most of mutual fund 27
- 28. schemes in the sample of 58were able to satisfy investor’s expectations by giving excess returns over expected returns basedon both premium for systematic risk and total risk. Bijan Roy, et. al., conducted an empiricalstudy on conditional performance of Indian mutual funds. This paper uses a technique calledconditional performance evaluation on a sample of eightynine Indian mutual fund schemes .This paper measures the performance of various mutual funds with both unconditional and conditionalform of CAPM, Treynor- Mazuy model and Henriksson-Merton model. The effect of incorporating lagged information variables into the evaluation of mutual fund managers’ performance is examined in the Indian context. The results suggest that the use of conditioninglagged information variables improves the performance of mutual fund schemes, causing alphasto shift towards right and reducing the number of negative timing coefficients. Mishra, et al.,(2002) measured mutual fund performance using lower partial moment. In this paper, measuresof evaluating portfolio performance based on lower partial moment are developed. Risk from thelower partial moment is measured by taking into account only those states in which return is below a prespecified “target rate” like risk-free rate. Kshama Fernandes(2003) evaluated indexfund implementation in India. In this paper, tracking error of index funds in India is measured.The consistency and level of tracking errors obtained by some well-run index fund suggests thatit is possible to attain low levels of tracking error under Indian conditions. At the same time,there do seem to be periods where certain index funds appear to depart from the discipline of indexation. K. Pendaraki et al. studied construction of mutual fund portfolios, developed a multi-criteria methodology and applied it to the Greek market of equity mutual funds. Themethodology is based on the combination of discrete and continuous multi-criteria decision aidmethods for mutual fund selection and composition. UTADIS multi-criteria decision aid methodis employed in order to develop mutual fund’s performance models. Goal programming model isemployed to determine proportion of selected mutual funds in the final portfolios. Exchange Traded funds (ETFs) are open ended index funds that are listed and traded on exchanges like stockequity based on the price of metal. Ferri (2007) defined ETFs as “ETFs are baskets of securities that are traded, like individual stocks, through a brokerage firm on a stock exchange.” The first bonafide ETF was launched in US in 1993, a tradable depositary receipt for a portfolio of index stocks held in a unit investment trust. It was called the S&P Depositary Receipt, and it also tracked the S&P 500 Stock Index (Lofton, 2007). However in China the first ETF was launched in 2004. Since then ETFs have become a key innovation in 28
- 29. the Chinese exchange based markets (Hsu et al, 2009). Presently, there are five ETF listings, and assets under management for the five ETFs are USD 5.2 billion (Hsu et al, 2009). ETF are mainly in Gold, Silver, Platinum and Palladium. However, the focus of this study was Gold ETFs. Gold ETFs have gained greater significance as successful mean of investment in the last decade. The recent global financial crisis increased the demand for gold hedge. The value of gold holdings with trading exchanges has continued to increase since last decade. The major data of the world seven largest gold ETFs indicates that, the total holdings of the world's seven largest golden ETFs are 1383.8 tons. At the same time in order to hedge the stock market turmoil, the housing market problems are constantly emerging, and other credit crunch in the area, due to which the demand for gold gradually increased. The gold ETF (exchange-traded index funds) provides a convenient way to the investors to intervene in the gold market. 2.3 Gold ETF Overview Gold ETFs are defined in several ways. According to Bang (2009) gold ETF is basically an open-ended mutual fund that invests in standard gold bullion as its underlying asset. It is also known as paper gold. These instruments are listed on the stock exchanges and, hence, can be bought and sold just like buying and selling of shares.The first gold exchange-traded fund was launched in March 2003 on the Australian Stock Exchange (Bloomenthal, 2008). In U.S. the Gold ETF trading began on the New York Stock Exchange (NYSE) in 2004. These ETFs are traded under the symbol “GLD”. Different people define and perceive GLDs differently. Some people perceive that they will own physical gold by investing in the shares of Gold ETFs. However, it’s not the right perception. The objective of GLDs is not to provide investors with the opportunity to own gold bullion by investing in the shares of gold ETF. Rather, gold ETFs are designed to track the price of gold. Gold ETF Index Fund is a kind of gold-based assets. It tracks the gold price and each share represents one-tenth of an ounce of gold. With transaction convenience, storage security, transaction costs and low liquidity, transparency of transactions and many other investment advantages, gold ETF has become widely accepted. 29
- 30. Jill Leyland Economic Advisers to World Gold Council said that the unlimited potential of gold ETF is of high interest for those countries who have not yet introduced such products. He further pointed out that, in addition to insurance funds, other agencies such as public funds, sovereign wealth funds, investment to gold ETF's also raise the demand for gold. Nedeljkovic (2005) described that Gold ETFs, compared to some other structured products, are very simple structures. He further, described that there is no credit risk and investment in Gold ETFs is accessible and simple. Gold ETFs are listed on a stock exchange, quoted in local currency, with no minimum investment. The other considerable characteristics of Gold ETFs are their cost effectiveness, security, and high liquidity (Nedeljkovic, 2005). Several studies have been conducted about ETFs, their trading characteristics and benefits (Gallagher and Segara, 2005; Jares and Lavin, 2004 and Kostovetsky, 2003). Milonas and Rompotis (2006) conducted a study on the performance and the trading characteristics of the ETFs. Gastineau (2001) described the origin, main types and the benefits of ETFs. Carty (2001) confers several characteristics of ETFs like flexibility, convenience, risk diversification, tax efficiency and cost advantages. 2.4 The Status of the Global Gold ETF Currently, ETF demand for gold has become the fastest growing area; its growth rate is higher than jewellery and industrial consumption. The demand for gold ETFs and similar products is rapidly increasing over the time. According to statistics, the first gold ETF since its inception in March 2003, approximately attracted 180 billion U.S. dollars investment, which is equivalent to 650 metric tons of gold, accounting for 10 percent of the world's total demand. During this period, the price of gold also rose to almost double. Before the introduction of the gold ETF there was no direct involvement in commodity markets to hedge the risk of the stock and bond markets. At that time the main investment was through the purchase of gold stocks and funds to hedge risk, but such ways that lacks transparency, liquidity, and also bear gold mine operations and the risk of mismanagement. Ross Norman (2010) an internationally known gold analyst at The Bullion Desk, said gold ETF market has greatly improved its availability in a short time. The first gold ETF listed on the Australian Stock Exchange (ASX) launched under the symbol “GOLD”, has made a very good introduction to the sales, just in June raised on 340 million ounces of gold, this also attracted the international community to the gold ETF. As the New York Stock Exchange's successful 30
- 31. listing Street TRACKS Gold Shares, gold ETF open a prelude to a rapid development. Since then, the United Kingdom, South Africa, Switzerland, India and other countries also have launched similar products; table 2 indicates the major gold ETFs traded in the world. Gold ETF trading gold on the widened channels, one hand improved the international market gold demand, and on the other also expands the market capacity. China is the world's largest gold producer and second largest consumer. Gold production in China is mainly concentrated in Shandong, Henan, Fujian, Liaoning, Hunan, Shaanxi and other places. At present the prices in China's gold market, are gradually align with the international gold market. In 2007 China's output of 276 tonnes of gold, made it the world’s largest for the first time following South Africa which produced 272 tonnes (Mathews, 2008). With the continuous improvement of people's living standard, China's gold consumption maintains sustained growth, in 2008-09. China is the world’s second-largest consumer of gold after India with last year’s consumption of 427.5 tonnes (Subramani, 2010). China’s gold reserves also show an increasing trend and reach to 1054 tonnes in 2009. However the gold share of national foreign exchange is still very small at 1.5 percent and US dollar and securities reserves are quite high. 31
- 32. References Adjei, F., (2009). Diversification, Performance, and Performance Persistence in ExchangeTraded Funds, International Review of Applied Financial Issues and Economics, 1(1). Anderson, R. I., Brockman C. M., Giannakos, C., & McLeod, R. W., (2004). A NonParametric Examination of Real Estate Mutual Fund Efficiency. International Journal of Business and Economics, 3(3), 225-38. Ching-Chung, L., Shih-Ju, C., & Hsinan, H., (2005). Pricing efficiency of exchange traded funds in Taiwan. Journal of Asset Management, 7(1), 60–68. Gerasimos, G., & Rompotis., (2011) Does premium impact Exchange-Traded Funds’ returns? Journal of Asset Management, 11, 298–308. Gerasimos, G., & Rompotis.,(2011). Predictable patterns in ETFs’ return and tracking error. Studies in Economics and Finance, 28(1). Ioannis, E., & Tsolas. (2011). Natural Resources Exchange Traded Funds: Performance Appraisal using DEA Modeling. Journal of Centrum Cathedra, 4(2), 250-259. Jaspal, S. (2004). Growth, Performance and Prospects of Mutual Funds in India. Finance India, 18(4), 1755-1760. Joel, T., Harper, A., Jeff, M., & Oliver, S. (2006). Performance comparison between exchange-traded funds and closed-end country funds. International Financial Markets, Institution and Money, 16(2), 104–122. Madhumita Chakraborty, P., Jain, K., & Vinay, K. (2008). Mutual funds performance: An evaluation of select growth funds in India. South Asian Journal of Management, 80(4), 80-92. 32
- 33. Sivakumar, K. P., Rajmohan, S., Sezhiyan, D. M., & Narasimhulu, S. (2010). Performance Evaluation of Mutual Fund Industry in India. Vidwat:The Indian Journal of Management, 3(1), 26-32. Gallagher, R. D. and Reuben S. (2005). The Performance and Trading Characteristics of Exchange-Traded Funds. Working paper, The University of New South Wales. Gastineau, G. (2001). Exchange-Traded Funds: An Introduction. Journal of Portfolio Management, 27, 88-96. Hsu, J., Li, F., Ma, Z., Song, H., and Y. Pang. (2009). The development of the ETF market in China.Institutional Investor Journals, 150-154. Jares, E. Timothy and Angeline M. Lavin. (2004). Japan and Hong Kong Exchange- Traded Funds (ETFs): Discounts, Returns, and Trading Strategies. Journal of Financial Service Research, 25(1), 57-69. Kostovetsky, L. (2003). Index Mutual Funds and Exchange-Traded Funds. Journal of Portfolio Management, 29, 80-92. Lin, C.C., Chan, S.J., and H. Hsu. (2006). Pricing efficiency of exchange traded funds in Taiwan. Journal of Asset Management, 7(1), 60–68. Lofton Todd. (2007). Enter the Exchange-Traded Fund. Exchange Traded Funds, John Wiley and Sons Inc. 5-6. Nedeljkovic, V. (2005). The Impact of ETFs on the Gold Market. The LBMA Precious Metals Conference 2005, Johannesburg, 127-130. Schuster A. J. (2008). ETFs: The Next 10 Years. Global Exchanges & ETFs Report, 34-35. . 33
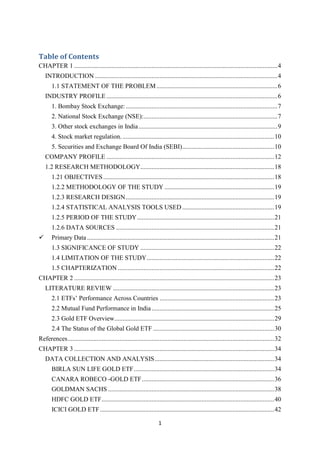
- 34. CHAPTER 3 DATA COLLECTION AND ANALYSIS Table 3.1 BIRLA SUN LIFE GOLD ETF STOCK PRICE GOLD ETF PRICE STOCK MARKET RETURN RETURN OPEN CLOSE OPEN CLOSE Y X 1-Jan-13 3045 3022 30860 30896 -0.75534 0.116656 -0.08811 0.013609 7-Jan-13 3022 3010.05 30896 30890 -0.39543 -0.01942 0.007679 0.000377 11-Jan-13 3010.05 3015 30890 30738 0.164449 -0.49207 -0.08092 0.242132 17-Jan-13 3015 3030 30738 30713 0.497512 -0.08133 -0.04046 0.006615 23-Jan-13 3030 2970 30713 30710 -1.9802 -0.00977 0.019342 9.54E-05 29-Jan-13 2970 2975 30710 30240 0.16835 -1.53045 -0.25765 2.342265 4-Feb-13 2975 3025 30240 30310 1.680672 0.231481 0.389045 0.053584 8-Feb-13 3025 2945.15 30310 30755 -2.63967 1.468162 -3.87546 2.155501 14-Feb-13 2945.15 2925.9 30755 30050 -0.65362 -2.29231 1.498293 5.254686 20-Feb-13 2925.9 2852.55 30050 29597 -2.50692 -1.50749 3.779152 2.272519 26-Feb-2013 2852.55 2856.1 29597 30055 0.12445 1.547454 0.192581 2.394614 4-Mar-13 2856.1 2909 30055 29632 1.852176 -1.40742 -2.60679 1.98083 8-Feb-13 2909 2867.25 29632 29269 -1.4352 -1.22503 1.75816 1.500691 14-Mar-2013 2867.25 2893.3 29269 29379 0.908536 0.375824 0.34145 0.141244 20-Mar-2013 2893.3 2870.1 29379 29716 -0.80185 1.147078 -0.91979 1.315788 28-Mar-2013 2870.1 0.08389 2875.5 29716 29477 0.188147 -0.80428 -0.15132 0.646867 SUM -5.58394 -4.4829 -0.17628 20.32142 SD Rp 1.329568 -0.349 VAR Rm BETA 34 X*Y X2 DATE 1.76775 -0.28018
- 35. 2.5 2 1.5 1 0.5 0 Y -0.5 X -1 -1.5 -2 -2.5 -3 Chart 3.1 Interpretation It can be seen from the above that the standard deviation (i.e. total risk associated with stock) is 1.329568, where as the beta value is -0.08389. Here it means that all risk associated with this stock can be eliminated with proper diversification of the portfolio. Here the beta is less than one and it shows that the less volatility of the price of the stock in comparison with the market returns. The average stock return is -0.349 and the average market return are 0.28018. Here it can be ascertained that there exist a comparatively high difference between systematic risk and unsystematic risk. 35
- 36. Table 3.2 CANARA ROBECO -GOLD ETF STOCK PRICE GOLD ETF PRICE STOCK MARKET RETURN RETURN OPEN CLOSE OPEN CLOSE Y X 1-Jan-13 3062 3050 30860 30896 -0.3919 0.116656 -0.04572 0.013609 7-Jan-13 3050 3060 30896 30890 0.327869 -0.01942 -0.00637 0.000377 11-Jan-13 3060 3040 30890 30738 -0.65359 -0.49207 0.321613 0.242132 17-Jan-13 3040 3000 30738 30713 -1.31579 -0.08133 0.107017 0.006615 23-Jan-13 3000 3044 30713 30710 1.466667 -0.00977 -0.01433 29-Jan-13 3044 3045 30710 30240 0.032852 -1.53045 -0.05028 2.342265 4-Feb-13 3045 3004 30240 30310 -1.34647 0.231481 -0.31168 0.053584 8-Feb-13 3004 2900 30310 30755 -3.46205 1.468162 -5.08285 2.155501 14-Feb-13 2900 2950 30755 30050 1.724138 -2.29231 -3.95226 5.254686 20-Feb-13 2950 3025 30050 29597 2.542373 -1.50749 -3.8326 26-Feb-2013 3025 3100 29597 30055 2.479339 1.547454 3.836663 2.394614 4-Mar-13 3100 2980 30055 29632 -3.87097 -1.40742 5.448076 8-Feb-13 2980 2958 29632 29269 -0.73826 -1.22503 0.904382 1.500691 14-Mar-2013 2958 2955 29269 29379 -0.10142 0.375824 -0.03812 0.141244 20-Mar-2013 2955 2967 29379 29716 0.406091 1.147078 0.465818 1.315788 28-Mar-2013 2967 2967 29716 29477 0 -0.80428 SUM -2.90112 -4.4829 SD 1.809835 VAR 3.275503 Rp -0.18132 Rm -0.28018 BETA 0.16068 36 X*Y X2 DATE 0 9.54E-05 2.272519 1.98083 0.646867 -0.17628 20.32142
- 37. 3 2 1 0 stock return -1 market return -2 -3 -4 -5 Chart 3.2 Interpretation It can be seen from the above that the standard deviation (i.e. total risk associated with stock) is 1.809835, where as the beta value is -0.16068. Here it means that all risk associated with this stock can be eliminated with proper diversification of the portfolio. Here the beta is less than one and it shows that the less volatility of the price of the stock in comparison with the market returns. The average stock return is -0.18132 and the average market return are 0.28018. 37
- 38. Table 3.3 GOLDMAN SACHS STOCK PRICE GOLD ETF PRICE STOCK MARKET RETURN RETURN OPEN CLOSE OPEN CLOSE Y X 1-Jan-13 2911.15 2907 30860 30896 -0.14256 0.116656 -0.01663 0.013609 7-Jan-13 2907 2894 30896 30890 -0.4472 -0.01942 0.008685 0.000377 11-Jan-13 2894 2910 30890 30738 0.552868 -0.49207 -0.27205 0.242132 17-Jan-13 2910 2930 30738 30713 0.687285 -0.08133 -0.0559 23-Jan-13 2930 2895.1 30713 30710 -1.19113 -0.00977 0.011635 9.54E-05 29-Jan-13 2895.1 2885 30710 30240 -0.34887 -1.53045 0.53392 2.342265 4-Feb-13 2885 2885 30240 30310 0 0.231481 0 0.053584 8-Feb-13 2885 2870 30310 30755 -0.51993 1.468162 -0.76334 2.155501 14-Feb-13 2870 2827 30755 30050 -1.49826 -2.29231 3.434472 5.254686 20-Feb-13 2827 2785.05 30050 29597 -1.48391 -1.50749 2.236969 2.272519 26-Feb-2013 2785.05 2791.5 29597 30055 0.231594 1.547454 0.358381 2.394614 4-Mar-13 2791.5 2789.4 30055 29632 -0.07523 -1.40742 0.105878 8-Feb-13 2789.4 2785 29632 29269 -0.15774 -1.22503 0.193236 1.500691 14-Mar-2013 2785 2824 29269 29379 1.400359 0.375824 0.526289 0.141244 20-Mar-2013 2824 2809.8 29379 29716 -0.50283 1.147078 -0.57679 1.315788 28-Mar-2013 2809.8 2806.9 29716 29477 -0.10321 -0.80428 0.08301 SUM -3.59874 -4.4829 -0.17628 20.32142 SD 0.763987 VAR 0.583676 Rp -0.22492 Rm -0.28018 BETA 0.251737 38 X*Y X2 DATE 0.006615 1.98083 0.646867
- 39. 2 1.5 1 0.5 0 -0.5 -1 -1.5 -2 -2.5 Chart 3.3 Interpretation It can be seen from the above that the standard deviation (i.e. total risk associated with stock) is 1.809835, where as the beta value is -0.16068. Here it means that all risk associated with this stock can be eliminated with proper diversification of the portfolio. Here the beta is less than one and it shows that the less volatility of the price of the stock in comparison with the market returns. The average stock return is -0.18132 and the average market return are 0.28018. 39
- 40. Table 3.4 HDFC GOLD ETF STOCK PRICE GOLD ETF PRICE STOCK MARKET RETURN RETURN OPEN CLOSE OPEN CLOSE Y X 1-Jan-13 3021.8 3050 30860 30896 0.933219 0.116656 0.108865 0.013609 7-Jan-13 3050 3007 30896 30890 -1.40984 -0.01942 0.027379 0.000377 11-Jan-13 3007 3000 30890 30738 -0.23279 -0.49207 0.114549 0.242132 17-Jan-13 3000 2930 30738 30713 -2.33333 -0.08133 0.189776 0.006615 23-Jan-13 2930 2895.1 30713 30710 -1.19113 -0.00977 0.011635 9.54E-05 29-Jan-13 2895.1 2885 30710 30240 -0.34887 -1.53045 0.53392 2.342265 4-Feb-13 2885 2885 30240 30310 0 0.231481 0 0.053584 8-Feb-13 2885 2870 30310 30755 -0.51993 1.468162 -0.76334 2.155501 14-Feb-13 2870 2827 30755 30050 -1.49826 -2.29231 3.434472 5.254686 20-Feb-13 2827 2785.05 30050 29597 -1.48391 -1.50749 2.236969 2.272519 26-Feb-2013 2785.05 2791.5 29597 30055 0.231594 1.547454 0.358381 2.394614 4-Mar-13 2791.5 2789.4 30055 29632 -0.07523 -1.40742 0.105878 8-Feb-13 2789.4 2785 29632 29269 -0.15774 -1.22503 0.193236 1.500691 14-Mar-2013 2785 2824 29269 29379 1.400359 0.375824 0.526289 0.141244 20-Mar-2013 2824 2809.8 29379 29716 -0.50283 1.147078 -0.57679 1.315788 28-Mar-2013 2809.8 2806.9 29716 29477 -0.10321 -0.80428 0.08301 SUM -7.29188 -4.4829 -0.17628 20.32142 SD 0.952197 VAR 0.906679 Rp -0.45574 Rm -0.28018 BETA 0.238189 40 X*Y X2 DATE 1.98083 0.646867
- 41. 2 1.5 1 0.5 26-Mar-13 19-Mar-13 12-Mar-13 5-Mar-13 26-Feb-13 19-Feb-13 12-Feb-13 5-Feb-13 29-Jan-13 22-Jan-13 15-Jan-13 -1 8-Jan-13 -0.5 1-Jan-13 0 stock return market return -1.5 -2 -2.5 -3 Chart 3. 4 Interpretation It can be seen from the above that the standard deviation (i.e. total risk associated with stock) is 0.952197, where as the beta value is 0.238189. Here it means that all risk associated with this stock can be eliminated with proper diversification of the portfolio. Here the beta is less than one and it shows that the less volatility of the price of the stock in comparison with the market returns. The average stock return is -0.45574 and the average market return are 0.28018. 41
- 42. Table 3.5 ICICI GOLD ETF STOCK PRICE GOLD ETF PRICE STOCK MARKET RETURN RETURN OPEN CLOSE OPEN CLOSE Y X 1-Jan-13 3014 3011 30860 30896 -0.09954 0.116656 -0.01161 0.013609 7-Jan-13 3011 3022 30896 30890 0.365327 -0.01942 -0.00709 0.000377 11-Jan-13 3022 2975 30890 30738 -1.55526 -0.49207 0.765295 0.242132 17-Jan-13 2975 3027 30738 30713 1.747899 -0.08133 -0.14216 0.006615 23-Jan-13 3027 3042 30713 30710 0.49554 -0.00977 -0.00484 29-Jan-13 3042 2940 30710 30240 -3.35306 -1.53045 5.131673 2.342265 4-Feb-13 2940 2956.65 30240 30310 0.566327 0.231481 0.131094 0.053584 8-Feb-13 2956.65 2949 30310 30755 -0.25874 1.468162 -0.37987 2.155501 14-Feb-13 2949 2907 30755 30050 -1.42421 -2.29231 3.264735 5.254686 20-Feb-13 2907 2875 30050 29597 -1.10079 -1.50749 1.659429 2.272519 26-Feb-2013 2875 2860.05 29597 30055 -0.52 1.547454 -0.80468 2.394614 4-Mar-13 2860.05 2856 30055 29632 -0.14161 -1.40742 0.199299 8-Feb-13 2856 2841 29632 29269 -0.52521 -1.22503 0.643397 1.500691 14-Mar-2013 2841 2874.95 29269 29379 1.195002 0.375824 0.449111 0.141244 20-Mar-2013 2874.95 2850 29379 29716 -0.86784 1.147078 -0.99548 1.315788 28-Mar-2013 2850 2850.05 29716 29477 0.001754 -0.80428 -0.00141 0.646867 SUM -5.4744 -4.4829 -0.17628 20.32142 SD 1.200225 VAR 1.440541 Rp -0.34215 Rm -0.28018 BETA 0.438651 42 X*Y X2 DATE 9.54E-05 1.98083
- 43. 3 2 1 26-Mar-13 19-Mar-13 12-Mar-13 5-Mar-13 26-Feb-13 19-Feb-13 12-Feb-13 5-Feb-13 29-Jan-13 22-Jan-13 -2 15-Jan-13 8-Jan-13 -1 1-Jan-13 0 market return strock return -3 -4 -5 -6 Chart 3.5 Interpretation As from the above it can be seen that the standard deviation (i.e. total risk associated with stock) of ICICI GOLD ETF is 1.200225, where as the beta value is 0.438651. Here it means that all risk associated with this stock can be eliminated with proper diversification of the portfolio. Here the beta is less than one and it shows that the less volatility of the price of the stock in comparison with the market returns. The average stock return is --0.34215 and the average market return are -0.28018. It can be seen that there exist comparatively higher difference between systematic and non systematic risk 43
- 44. Table 3.6 IDBI GOLD ETF STOCK PRICE GOLD ETF PRICE STOCK MARKET RETURN RETURN OPEN CLOSE OPEN CLOSE Y X 1-Jan-13 3010 3000 30860 30896 -0.33223 0.116656 -0.03876 0.013609 7-Jan-13 3000 3023 30896 30890 0.766667 -0.01942 -0.01489 0.000377 11-Jan-13 3023 3045.1 30890 30738 0.731062 -0.49207 -0.35973 0.242132 17-Jan-13 3045.1 3050 30738 30713 0.160914 -0.08133 -0.01309 0.006615 23-Jan-13 3050 3030 30713 30710 -0.65574 -0.00977 0.006405 9.54E-05 29-Jan-13 3030 2994.95 30710 30240 -1.15677 -1.53045 1.770368 2.342265 4-Feb-13 2994.95 3038.7 30240 30310 1.460792 0.231481 0.338146 0.053584 8-Feb-13 3038.7 3000 30310 30755 -1.27357 1.468162 -1.86981 2.155501 14-Feb-13 3000 2972 30755 30050 -0.93333 -2.29231 2.13949 5.254686 20-Feb-13 2972 2910.05 30050 29597 -2.08445 -1.50749 3.14229 2.272519 26-Feb-2013 2910.05 2915 29597 30055 0.1701 1.547454 0.263222 2.394614 4-Mar-13 2915 2910 30055 29632 -0.17153 -1.40742 0.24141 8-Feb-13 2910 2926 29632 29269 0.549828 -1.22503 -0.67355 1.500691 14-Mar-2013 2926 2942 29269 29379 0.546822 0.375824 0.205509 0.141244 20-Mar-2013 2942 2960 29379 29716 0.611829 1.147078 0.701815 1.315788 28-Mar-2013 2960 2954.95 29716 29477 -0.17061 -0.80428 0.137217 0.646867 SUM -1.78021 -4.4829 -0.17628 20.32142 SD 0.926053 VAR 0.857574 Rp -0.11126 Rm -0.28018 BETA 0.287288 44 X*Y X2 DATE 1.98083
- 45. 2 1.5 1 0.5 0 Y -0.5 X -1 -1.5 -2 -2.5 Chart 3.6 Interpretation As from the above it can be seen that the standard deviation (i.e. total risk associated with stock) of IDBI GOLD ETF is 0.926053, where as the beta value is only 0.287288. Here it means that all risk associated with this stock can be eliminated with proper diversification of the portfolio. Here also the beta value is less than one and it shows that the less volatility of the price of the stock. The average stock return is -0.11126 and the average market return are -0.28018 45
- 46. Table 3.7 QUANTUM GOLD FUND STOCK PRICE GOLD ETF PRICE DATE OPEN 1-Jan-13 1460.15 1460.6 30860 7-Jan-13 1460.6 1450 11-Jan-13 1450 17-Jan-13 X 30896 0.030819 0.116656 0.003595 0.013609 30896 30890 -0.72573 -0.01942 0.014094 0.000377 1456 30890 30738 0.413793 -0.49207 -0.20361 0.242132 1456 1464 30738 30713 0.549451 -0.08133 -0.04469 0.006615 23-Jan-13 1464 1446 30713 30710 -1.22951 -0.00977 0.01201 29-Jan-13 1446 1444.85 30710 30240 -0.07953 -1.53045 0.121716 2.342265 4-Feb-13 1444.85 30240 30310 0.287227 0.231481 0.066488 0.053584 8-Feb-13 1449 1430.15 30310 30755 -1.3009 1.468162 -1.90993 2.155501 14-Feb-13 1430.15 30755 30050 -1.05933 -2.29231 2.428312 5.254686 20-Feb-13 1415 1388.05 30050 29597 -1.90459 -1.50749 2.871151 2.272519 26-Feb-2013 1388.05 1405.5 29597 30055 1.257159 1.547454 1.945396 2.394614 4-Mar-13 1405.5 1398 30055 29632 -0.53362 -1.40742 0.751024 8-Feb-13 1398 1390 29632 29269 -0.57225 -1.22503 0.701017 1.500691 14-Mar-2013 1390 1488 29269 29379 7.05036 0.375824 2.649696 0.141244 20-Mar-2013 1488 1404 29379 29716 -5.64516 1.147078 -6.47544 1.315788 28-Mar-2013 1404 1406.5 29716 29477 0.178063 -0.80428 -0.14321 0.646867 SUM -3.28374 -4.4829 -0.17628 20.32142 SD 2.478832 VAR 6.144607 Rp -0.20523 Rm -0.28018 1449 1415 0.097956 46 X*Y X2 Y BETA CLOSE OPEN CLOSE STOCK MARKET RETURN RETURN 9.54E-05 1.98083
- 47. 8 6 4 2 stock return 0 market return -2 -4 -6 -8 Chart 3.7 Interpretation As from the above it can be seen that the standard deviation (i.e. total risk associated with stock) of QUANTUM GOLD ETF is 2.478832, where as the beta value is only 0.097956. Here it means that all risk associated with this stock can be eliminated with proper diversification of the portfolio. Here also the beta value is less than one and it shows that the less volatility of the price of the stock. The average stock return is -0.20523 and the average market return are -0.28018. It can be seen that there exist comparatively higher difference between systematic and non systematic risk. 47
- 48. Table 3.8 KOTAK GOLD ETF STOCK PRICE DATE OPEN GOLD ETF PRICE CLOSE OPEN STOCK MARKET RETURN RETURN CLOSE Y X X*Y X2 1-Jan-13 2926.05 2949.7 30860 30896 0.808257 0.116656 0.094288 0.013609 7-Jan-13 2949.7 2920 30896 30890 -1.00688 -0.01942 0.019554 0.000377 11-Jan-13 2920 2918 30890 30738 -0.06849 -0.49207 0.033703 0.242132 17-Jan-13 2918 2921.05 30738 30713 0.104524 -0.08133 -0.0085 0.006615 23-Jan-13 2921.05 2910.1 30713 30710 -0.37487 -0.00977 0.003662 9.54E-05 29-Jan-13 2910.1 2881.3 30710 30240 -0.98966 -1.53045 1.514616 2.342265 4-Feb-13 2881.3 2899 30240 30310 0.614306 0.231481 0.1422 0.053584 8-Feb-13 2899 2879 30310 30755 -0.68989 1.468162 -1.01288 2.155501 14-Feb-13 2879 2811 30755 30050 -2.36193 -2.29231 5.414279 5.254686 20-Feb-13 2811 2800 30050 29597 -0.39132 -1.50749 0.58991 2.272519 26-Feb-2013 2800 2791.5 29597 30055 -0.30357 1.547454 -0.46976 2.394614 2791.5 2780.15 30055 29632 -0.40659 -1.40742 0.572245 2765 29632 29269 -0.54493 -1.22503 0.66756 1.500691 14-Mar-2013 2765 2806.05 29269 29379 1.484629 0.375824 0.55796 0.141244 20-Mar-2013 2806.05 2772.05 29379 29716 -1.21167 1.147078 -1.38988 1.315788 28-Mar-2013 2772.05 29716 29477 0.463556 -0.80428 -0.37283 0.646867 SUM -4.87453 -4.4829 -0.17628 20.32142 SD 0.907169 VAR 0.822955 Rp -0.30466 Rm -0.28018 4-Mar-13 8-Feb-13 BETA 2780.15 0.261751 2784.9 48 1.98083
- 49. 2 1 0 -1 stock return market return -2 -3 -4 -5 Chart 3.8 Interpretation As from the above it can be seen that the standard deviation (i.e. total risk associated with stock) of KOTAK GOLD ETF is 0.907169, where as the beta value is only 0.097956. Here it means that all risk associated with this stock can be eliminated with proper diversification of the portfolio. Here also the beta value is less than one and it shows that the less volatility of the price of the stock. The average stock return is -0.20523 and the average market return are -0.28018. It can be seen that there exist comparatively higher difference between systematic and non systematic risk. 49
- 50. Table 3.9 RELIANCE GOLD FUND STOCK PRICE GOLD ETF PRICE STOCK MARKET RETURN RETURN DATE OPEN CLOSE OPEN CLOSE Y X X*Y X2 1-Jan-13 2869.8 2867 30860 30896 -0.09757 0.116656 -0.01138 0.013609 7-Jan-13 2867 2820.1 30896 30890 -1.63586 -0.01942 0.031768 0.000377 11-Jan-13 2820.1 2816 30890 30738 -0.14538 -0.49207 0.071539 0.242132 17-Jan-13 2816 2820 30738 30713 0.142045 -0.08133 -0.01155 23-Jan-13 2820 2782.9 30713 30710 -1.3156 -0.00977 0.012851 9.54E-05 29-Jan-13 2782.9 2798.5 30710 30240 0.560566 -1.53045 -0.85792 4-Feb-13 2798.5 2804 30240 30310 0.196534 0.231481 0.045494 0.053584 8-Feb-13 2804 2794.8 30310 30755 -0.3281 1.468162 -0.48171 14-Feb-13 2794.8 2764 30755 30050 -1.10205 -2.29231 2.526233 5.254686 20-Feb-13 2764 2657 30050 29597 -3.8712 -1.50749 5.835787 2.272519 26-Feb-2013 2657 2701.15 29597 30055 1.661648 1.547454 2.571325 2.394614 4-Mar-13 2701.15 2694.5 30055 29632 -0.24619 -1.40742 0.346495 1.98083 8-Feb-13 2694.5 2699.5 29632 29269 0.185563 -1.22503 -0.22732 1.500691 14-Mar-2013 2699.5 2719.9 29269 29379 0.755695 0.375824 0.284009 0.141244 20-Mar-2013 2719.9 2705 29379 29716 -0.54781 1.147078 -0.62839 1.315788 28-Mar-2013 2705 2706 29716 29477 0.036969 -0.80428 -0.02973 0.646867 SUM -5.75075 -4.4829 -0.17628 20.32142 SD 1.232358 VAR 1.518707 Rp -0.35942 Rm -0.28018 BETA 0.412593 50 0.006615 2.342265 2.155501
- 51. 2 1.5 1 0.5 26-Mar-13 19-Mar-13 12-Mar-13 5-Mar-13 26-Feb-13 19-Feb-13 12-Feb-13 5-Feb-13 29-Jan-13 22-Jan-13 -1 15-Jan-13 8-Jan-13 -0.5 1-Jan-13 0 stock return market return -1.5 -2 -2.5 -3 Chart 3.9 Interpretation As from the above it can be seen that the standard deviation (i.e. total risk associated with stock) of RELIANCE GOLD ETF is 1.232358, where as the beta value is only 0.412593. Here it means that all risk associated with this stock can be eliminated with proper diversification of the portfolio. Here also the beta value is less than one and it shows that the less volatility of the price of the stock. The average stock return is -0.35942and the average market return are -0.28018. 51
- 52. Table 3.10 SBI GOLD FUND STOCK PRICE DATE GOLD ETF PRICE OPEN OPEN CLOSE STOCK MARKET RETURN RETURN CLOSE Y X X*Y X2 1-Jan-13 2985.2 2980 30860 30896 -0.17419 0.116656 7-Jan-13 2980 2972.5 30896 30890 -0.25168 -0.01942 0.004888 0.000377 11-Jan-13 2972.5 2985 30890 30738 0.420521 -0.49207 -0.20693 0.242132 17-Jan-13 2985 2998.9 30738 30713 0.465662 -0.08133 -0.03787 0.006615 23-Jan-13 2998.9 2975 30713 30710 -0.79696 -0.00977 0.007785 9.54E-05 29-Jan-13 2975 2988 30710 30240 0.436975 -1.53045 -0.66877 2.342265 4-Feb-13 2988 2971 30240 30310 -0.56894 0.231481 -0.1317 0.053584 8-Feb-13 2971 2947.9 30310 30755 -0.77752 1.468162 -1.14152 2.155501 14-Feb-13 2947.9 2901 30755 30050 -1.59096 -2.29231 3.646981 5.254686 20-Feb-13 2901 2875 30050 29597 -0.89624 -1.50749 1.351075 2.272519 26-Feb-2013 2875 2856 29597 30055 -0.66087 1.547454 -1.02267 2.394614 4-Mar-13 2856 2868 30055 29632 0.420168 -1.40742 -0.59135 8-Feb-13 2868 2862 29632 29269 -0.20921 -1.22503 0.256282 1.500691 2862 2881.05 29269 29379 0.665618 0.375824 0.250156 0.141244 2850 29379 29716 -1.07773 1.147078 -1.23624 1.315788 2850 2888.85 29716 29477 1.363158 -0.80428 -1.09636 0.646867 -3.2322 -4.4829 -0.17628 20.32142 14-Mar-2013 20-Mar-2013 2881.05 28-Mar-2013 SUM BETA 0.08089 -0.02032 0.013609 SD 0.776443 VAR 0.602864 Rp -0.20201 Rm -0.28018 52 1.98083
- 53. 2 1.5 1 0.5 26-Mar-13 19-Mar-13 12-Mar-13 -1 5-Mar-13 26-Feb-13 19-Feb-13 12-Feb-13 5-Feb-13 29-Jan-13 22-Jan-13 15-Jan-13 8-Jan-13 -0.5 1-Jan-13 0 stock return market return -1.5 -2 -2.5 Chart 3.10 Interpretation As from the above it can be seen that the standard deviation (i.e. total risk associated with stock) of SBI GOLD ETF is 0.776443, where as the beta value is only 0.08089. Here it means that all risk associated with this stock can be eliminated with proper diversification of the portfolio. Here also the beta value is less than one and it shows that the less volatility of the price of the stock. The average stock return is -0.20201 and the average market return are -0.28018. 53
- 54. CORRELATION CO-EFFICIENT Correlation co-efficient is an algebraic method of measuring correlation. Under this method, we measure correlation by finding a value known as the co-efficient of correlation using an appropriate formula. Correlation co-efficient is a numerical value. It shows the degree or the extent of correlation between two variables. 54
- 55. CORRELATION CO-EFFICIENT OF STOCK RETURN AND MARKET RETURN BIRLA SUN LIFE GOLD ETF Table 3.11 MARKET RETURN (X) 0.116656 XY X2 Y2 1-Jan-13 STOCK RETURN (Y) -0.75534 -0.08811 0.570539 0.013609 7-Jan-13 -0.39543 -0.01942 0.007679 0.156365 0.000377 11-Jan-13 0.164449 -0.49207 -0.08092 0.027043 0.242133 17-Jan-13 0.497512 -0.08133 -0.04046 0.247518 0.006615 23-Jan-13 -1.9802 -0.00977 0.019347 3.921192 9.55E-05 29-Jan-13 0.16835 -1.53045 -0.25765 0.028342 2.342277 4-Feb-13 1.680672 0.231481 0.389044 2.824658 0.053583 8-Feb-13 -2.63967 1.468162 -3.87546 6.967858 2.1555 14-Feb-13 -0.65362 -2.29231 1.4983 0.427219 5.254685 20-Feb-13 -2.50692 -1.50749 3.779157 6.284648 2.272526 26-Feb-2013 0.12445 1.547454 0.192581 0.015488 2.394614 4-Mar-13 1.852176 -1.40742 -2.60679 3.430556 1.980831 8-Feb-13 -1.4352 -1.22503 1.758163 2.059799 1.500699 14-Mar-2013 0.908536 0.375824 0.34145 0.825438 0.141244 20-Mar-2013 -0.80185 1.147078 -0.91978 0.642963 1.315788 28-Mar-2013 0.188147 -0.80428 -0.15132 0.035399 0.646866 Total -5.58394 -4.48292 -0.03479 28.46503 20.32144 DATE r= n ∑xy - ∑x x∑ y ______________________ √n∑x^2- (∑x^2) √n∑y^2 –(∑y^2) = -0.07113 Interpretation It can be seen from the above that there exist a negative correlation between stock return and market return of BIRLA SUN LIFE GOLD ETF and the co efficient of correlation is 0.07113. Correlation is said to be negative when the change in variables are in opposite direction. Here it means that the stock return and market return of BIRLA SUN LIFE GOLD ETF is in opposite direction. 55
- 56. GOLDMAN SACHS Table 3.12 DATE 1-Jan-13 STOCK RETURN(Y) -0.14256 MARKET RETURN(X) 0.116656 XY -0.01663 Y2 0.020323 X2 0.013609 7-Jan-13 -0.4472 -0.01942 0.008685 0.199988 0.000377 11-Jan-13 0.552868 -0.49207 -0.27205 0.305663 0.242133 17-Jan-13 0.687285 -0.08133 -0.0559 0.472361 0.006615 23-Jan-13 -1.19113 -0.00977 0.011637 1.418791 9.55E-05 29-Jan-13 4-Feb-13 -1.53045 0.231481 1.468162 0.533928 0 0.12171 0 2.342277 0.053583 8-Feb-13 -0.34887 0 -0.51993 -0.76334 0.270327 2.1555 14-Feb-13 -1.49826 -2.29231 3.434476 2.244783 5.254685 20-Feb-13 -1.48391 -1.50749 2.236979 2.201989 2.272526 26-Feb-2013 0.231594 1.547454 0.358381 0.053636 2.394614 4-Mar-13 -0.07523 -1.40742 0.10588 0.00566 1.980831 8-Feb-13 -0.15774 -1.22503 0.193236 0.024882 1.500699 14-Mar-2013 1.400359 0.375824 0.526289 1.961005 0.141244 20-Mar-2013 -0.50283 1.147078 -0.57679 0.252838 1.315788 28-Mar-2013 -0.10321 -0.80428 0.08301 0.010652 0.646866 Total -3.598764 -4.482915 5.807798 9.564608 20.32144 r= n ∑xy - ∑x x∑ y ______________________ √n∑x^2- (∑x^2) √n∑y^2 –(∑y^2) = 0.688361814 Interpretation It can be seen from the above that there exist a positive correlation between stock return and market return of GOLDMAN SACHS and the co efficient of correlation is 0.688361814. Correlation is said to be positive when the change in variables are in same direction. Here it means that the stock return and market return of GOLDMAN SACHS is in the same direction. 56
- 57. CANARA ROBECO -GOLD ETF Table 3.13 MARKET RETURN 0.116656 XY Y2 X2 1-Jan-13 STOCK RETURN -0.3919 -0.04572 0.153586 0.013609 7-Jan-13 0.327869 -0.01942 -0.00637 0.107498 0.000377 11-Jan-13 -0.65359 -0.49207 0.321612 0.42718 0.242133 17-Jan-13 -1.31579 -0.08133 0.107013 1.731303 0.006615 23-Jan-13 1.466667 -0.00977 -0.01433 2.151112 9.55E-05 29-Jan-13 0.032852 -1.53045 -0.05028 0.001079 2.342277 4-Feb-13 -1.34647 0.231481 -0.31168 1.812981 0.053583 8-Feb-13 -3.46205 1.468162 -5.08285 11.98579 2.1555 14-Feb-13 1.724138 -2.29231 -3.95226 2.972652 5.254685 20-Feb-13 2.542373 -1.50749 -3.8326 6.46366 2.272526 26-Feb-2013 2.479339 1.547454 3.836663 6.147122 2.394614 4-Mar-13 -3.87097 -1.40742 5.448081 14.98441 1.980831 8-Feb-13 -0.73826 -1.22503 0.904391 0.545028 1.500699 14-Mar-2013 -0.10142 0.375824 -0.03812 0.010286 0.141244 20-Mar-2013 0.406091 1.147078 0.465818 0.16491 1.315788 28-Mar-2013 0 -0.80428 0 0 0 Total -2.901121 -4.48292 -2.25062 49.6586 19.67458 DATE r= n ∑xy - ∑x x∑ y ______________________ √n∑x^2- (∑x^2) √n∑y^2 –(∑y^2) = -0.100 Interpretation It can be seen from the above that there exist a negative correlation between stock return and market return of CANARA ROBECO -GOLD ETF and the co efficient of correlation is 0.100. Correlation is said to be negative when the change in variables are in opposite direction. Here it means that the stock return and market return of CANARA ROBECO GOLD ETF is in opposite direction. 57
- 58. HDFC GOLD ETF Table 3.14 MARKET RETURN 0.116656 XY Y2 X2 1-Jan-13 STOCK RETURN 0.933219 0.108866 0.870898 0.013609 7-Jan-13 -1.40984 -0.01942 0.027379 1.987649 0.000377 11-Jan-13 -0.23279 -0.49207 0.114549 0.054191 0.242133 17-Jan-13 -2.33333 -0.08133 0.18977 5.444429 0.006615 23-Jan-13 -1.19113 -0.00977 0.011637 1.418791 9.55E-05 29-Jan-13 -0.34887 -1.53045 0.533928 0.12171 2.342277 4-Feb-13 0 0.231481 0 0 0.053583 8-Feb-13 -0.51993 1.468162 -0.76334 0.270327 2.1555 14-Feb-13 -1.49826 -2.29231 3.434476 2.244783 5.254685 20-Feb-13 -1.48391 -1.50749 2.236979 2.201989 2.272526 26-Feb-2013 0.231594 1.547454 0.358381 0.053636 2.394614 4-Mar-13 -0.07523 -1.40742 0.10588 0.00566 1.980831 8-Feb-13 -0.15774 -1.22503 0.193236 0.024882 1.500699 14-Mar-2013 1.400359 0.375824 0.526289 1.961005 0.141244 20-Mar-2013 -0.50283 1.147078 -0.57679 0.252838 1.315788 28-Mar-2013 -0.10321 -0.80428 0.08301 0.010652 0.646866 Total -7.291898 -4.482915 6.584254 16.92344 20.32144 DATE r= n ∑xy - ∑x x∑ y ______________________ √n∑x^2- (∑x^2) √n∑y^2 –(∑y^2) = 0.282016342 Interpretation It can be seen from the above that there exist a negative correlation between stock return and market return of DFC GOLD ETF and the co efficient of correlation is0.282016342. Correlation is said to be positive when the change in variables are in same direction. Here it means that the stock return and market return of DFC GOLD ETF is in the same direction. 58
- 59. ICICI GOLD ETF Table 3.15 STOCK DATE RETURN 1-Jan-13 -0.09954 7-Jan-13 0.365327 MARKET RETURN 0.116656 -0.01161 0.009908 0.013609 -0.01942 -0.00709 0.133464 0.000377 XY Y2 X2 11-Jan-13 -1.55526 -0.49207 0.765297 2.418834 0.242133 17-Jan-13 1.747899 -0.08133 -0.14216 3.055151 0.006615 23-Jan-13 0.49554 -0.00977 -0.00484 0.24556 9.55E-05 29-Jan-13 -3.35306 -1.53045 5.131691 11.24301 2.342277 4-Feb-13 0.566327 0.231481 0.131094 S0.320726 0.053583 8-Feb-13 -0.25874 1.468162 -0.37987 0.066946 2.1555 14-Feb-13 -1.42421 -2.29231 3.264731 2.028374 5.254685 20-Feb-13 -1.10079 -1.50749 1.65943 1.211739 2.272526 -0.52 1.547454 -0.80468 0.2704 2.394614 4-Mar-13 -0.14161 -1.40742 0.199305 0.020053 1.980831 8-Feb-13 -0.52521 -1.22503 0.643398 0.275846 1.500699 14-Mar-2013 1.195002 0.375824 0.44911 1.42803 0.141244 20-Mar-2013 -0.86784 1.147078 -0.99548 0.753146 1.315788 28-Mar-2013 0.001754 -0.80428 -0.00141 3.08E-06 0.646866 -5.57395 -4.48292 9.896916 23.160464 20.32144 26-Feb-2013 Total r= n ∑xy - ∑x x∑ y ______________________ √n∑x^2- (∑x^2) √n∑y^2 –(∑y^2) = 0.412035535 Interpretation It can be seen from the above that there exist a positive correlation between stock return and market return of ICICI GOLD ETF and the co efficient of correlation is 0.412035535. Correlation is said to be positive when the change in variables are in same direction. Here it means that the stock return and market return of ICIC GOLD ETF is in the same direction. 59
- 60. IDBI GOLD ETF Table 3.16 MARKET RETURN 0.116656 XY Y2 X2 1-Jan-13 STOCK RETURN -0.33223 -0.03876 0.110377 0.013609 7-Jan-13 0.766667 -0.01942 -0.01489 0.587778 0.000377 11-Jan-13 0.731062 -0.49207 -0.35973 0.534452 0.242133 17-Jan-13 0.160914 -0.08133 -0.01309 0.025893 0.006615 23-Jan-13 -0.65574 -0.00977 0.006407 0.429995 9.55E-05 29-Jan-13 -1.15677 -1.53045 1.770379 1.338117 2.342277 4-Feb-13 1.460792 0.231481 0.338146 2.133913 0.053583 8-Feb-13 -1.27357 1.468162 -1.86981 1.621981 2.1555 14-Feb-13 -0.93333 -2.29231 2.139482 0.871105 5.254685 20-Feb-13 -2.08445 -1.50749 3.142288 4.344932 2.272526 26-Feb-2013 0.1701 1.547454 0.263222 0.028934 2.394614 4-Mar-13 -0.17153 -1.40742 0.241415 0.029423 1.980831 8-Feb-13 0.549828 -1.22503 -0.67356 0.302311 1.500699 14-Mar-2013 0.546822 0.375824 0.205509 0.299014 0.141244 20-Mar-2013 0.611829 1.147078 0.701816 0.374335 1.315788 28-Mar-2013 -0.17061 -0.80428 0.137218 0.029108 0.646866 Total -1.78022 -4.48292 5.976042 13.06167 20.32144 DATE r= n ∑xy - ∑x x∑ y ______________________ √n∑x^2- (∑x^2) √n∑y^2 –(∑y^2) = 0.3497515 Interpretation It can be seen from the above that there exist a positive correlation between stock return and market return of IDBI GOLD ETF and the co efficient of correlation is 0.3497515. Correlation is said to be positive when the change in variables are in same direction. Here it means that the stock return and market return of IDBI GOLD ETF is in the same direction. 60
- 61. QUANTUM GOLD FUND Table 3.17 MARKET RETURN 0.116656 XY Y2 X2 1-Jan-13 STOCK RETURN 0.030819 0.003595 0.00095 0.013609 7-Jan-13 -0.72573 -0.01942 0.014094 0.526684 0.000377 11-Jan-13 0.413793 -0.49207 -0.20362 0.171225 0.242133 17-Jan-13 0.549451 -0.08133 -0.04469 0.301896 0.006615 23-Jan-13 -1.22951 -0.00977 0.012012 1.511695 9.55E-05 29-Jan-13 -0.07953 -1.53045 0.121717 0.006325 2.342277 4-Feb-13 0.287227 0.231481 0.066488 0.082499 0.053583 8-Feb-13 -1.3009 1.468162 -1.90993 1.692341 2.1555 14-Feb-13 -1.05933 -2.29231 2.428313 1.12218 5.254685 20-Feb-13 -1.90459 -1.50749 2.87115 3.627463 2.272526 26-Feb-2013 1.547454 -1.40742 1.945396 1.580449 2.394614 4-Mar-13 1.257159 -0.53362 0.751027 0.28475 1.980831 8-Feb-13 -0.57225 -1.22503 0.701023 0.32747 1.500699 14-Mar-2013 7.05036 0.375824 2.649694 49.70758 0.141244 20-Mar-2013 -5.64516 1.147078 -6.47544 31.86783 1.315788 28-Mar-2013 0.178063 -0.80428 -0.14321 0.031706 0.646866 Total -3.46181 -3.67864 2.787619 92.84304 20.32144 DATE r= n ∑xy - ∑x x∑ y ______________________ √n∑x^2- (∑x^2) √n∑y^2 –(∑y^2) = 0.04455154 Interpretation It can be seen from the above that there exist a positive correlation between stock return and market return of QUANTUM GOLD FUND and the co efficient of correlation is 0.04455154. Correlation is said to be positive when the change in variables are in same direction. Here it means that the stock return and market return of QUANTUM GOLD FUND is in the same direction. 61