SlideShare una empresa de Scribd logo
1 de 28
Descargar para leer sin conexión
Modeling the 2012
  U.S. Presidential Election
    Exploring the Forecasting Methods
Of Nate Silver and the Five-Thirty-Eight Blog
      Prepared for the 3/1/13 RTP Analysts Luncheon Meetup
                         By Bruce Conner
              Consolidated Behaviors and Attitudes


                                     1                 Consolidated Behaviors and Attitudes
Purposes of This Discussion
• Walk through the elements of Nate Silver’s methods in
  predicting the 2012 Presidential election
• “Kick around” some outstanding questions about those
  methods
• Explore whether participating analysts are using similar
  methods in their day-to-day work – and how they are using
  them?
• Sources listed in a “rough bibliography” at the back of this
  presentation


                                 2            Consolidated Behaviors and Attitudes
Background: Nate Silver
• Developed PECOTA, a highly-successful “sabremetric”
  model used for forecasting the performance and career
  development of Major League players
• In 2008:
   – Correctly predicted 49 out of 50 states (missed on Indiana)
   – Correctly predicted all U.S. Senate elections
   – Made better predictions for some of the primaries than major
     polls, using a demographic prediction model
• In 2010, less good predictions in U.S. House races
• In 2012:
   – Correctly predicted all 50 states and the District of Columbia


                                    3             Consolidated Behaviors and Attitudes
Nate’s Approach to
 Forecasting the Elections (1)
• Forecast Each State
    – As we learned in 2000, the election is decided in the Electoral
      College:
    – Nate decomposes the election into the 50 states and the District
      of Columbia, and forecasts popular vote in each separately
    – National projections of popular vote are simply the aggregate of
      the state popular votes
    – This approach is a type of hierarchical modeling
         • Who is using hierarchical modeling techniques – and how are you
           using them?

• Leverage Multiple Data/Predictor Sources
    – Polls within each state
    – Voter registration and demographics
    – Economic indicators
    – “Borrowed information” from other (similar) states
    – National polling (used only for inferring trends in the individual
      states)
    – Etc.


                                   4                  Consolidated Behaviors and Attitudes
Nate’s Approach to
       Forecasting the Elections (2)
• Calibration of Each Poll (Offsetting “House Effects”)
   – Measure -- and offset -- systematic bias of each pollster
   – This is done by a regression for each pollster of all their
     national polls against a weighted average of the national polls,
     as well as a regression of their polls in the various states
     against a weighted average of the polls in each state. Nate also
     lowered weight of polls that seem to be consistent outliers


                                    5              Consolidated Behaviors and Attitudes
Nate’s Approach to
  Forecasting the Elections (3)
• An Economic Index is Used as an “Additional Poll.” It is
  based on:
    – The four factors used to date recessions
         •   Job growth (nonfarm payrolls)
         •   Personal income
         •   Industrial production
         •   Consumption
    – Inflation (CPI)
    – Change in S&P 500 Index
    – Consensus forecast of gross domestic product growth over the next two
      economic quarters, as taken from the median of The Wall Street
      Journal’s monthly forecasting panel
• The economic index is used as a predictor of trend in future polls
  – as a “gravitational factor” that is likely to influence polls in the
  coming periods (with a lag effect). It is gradually removed
  (deweighted) from the model as the election approaches.


                                       6           Consolidated Behaviors and Attitudes
Nate’s Approach to
       Forecasting the Elections (4)
• Adjustment to state-level polls based on trend
   – National polls and state polls show trends over time
   – Particularly when some states do not have recent polls (or recent polls by
     a particular pollster), it is often reasonable to infer that if those polls
     would have been repeated today, they would be affected by trends
   – The method to determine trends is a regression with (1) dummy variables
     for each week and (2) dummy variables for each pollster in each state.
   – A LOESS regression is used to smooth the trend.
   – A “trend” correction is then applied to the older polls to reflect the effects
     of the trend since the poll was taken
   – An example of “Bayesian thinking”


                                          7                  Consolidated Behaviors and Attitudes
Nate’s Approach to
  Forecasting the Elections (5)
• A multiple regression of demographics,
  registration, and similar factors is treated as an
  additional poll
   – Voter registration, race, gender, age, income, etc. as
     predictors of how a state will vote


                               8              Consolidated Behaviors and Attitudes
Nate’s Approach to
  Forecasting the Elections (6)
• Weighted Averaging of Polls
   – The predictions from the demographic regression and
     from the economic index are treated as additional polls
   – Weight of the economic index is reduced as election
     approaches, until it disappears in the final forecast
   – Weighting of Polls Against Each Other Is Based On
       • Sample size
       • Recency (weighting is done using a “half life” formula –
         because polls closer to the election are more accurate)
       • Ratings of pollsters (see following slides)


                                9                 Consolidated Behaviors and Attitudes
Nate’s Approach to
  Forecasting the Elections (7)
• Pollster Ratings* Reflect Accuracy of Each Pollster
  in Predicting Actual Election Results
   – Raw ratings scores are done based on a multiple
     regression
   – Each data point is a published poll taken by a pollster in
     one of:
       • A presidential, gubinatorial, senatorial, congressional, or
         “generic house” race
       • A full range of elections/primaries/caucuses
       • Within 21 days of an election, primary, or caucus
       • For elections starting with the 1998 election cycle
   – The rating of each pollster is based on all of the polls
     attributed to that pollster – across the years and in the
     different types of elections
   – The dependent variable is the size of the error in
     predicting the gap between the top two candidates
                                     *For more detail on pollster ratings methods, see
                                     additiona l slides near end of this presentation
                                10                     Consolidated Behaviors and Attitudes
Nate’s Approach to
  Forecasting the Elections (8)
• Pollster Ratings (Continued)
   – Some properties of the raw rating regression:
       • Pollsters are “rewarded” for accurately predicting results
         (minimizing error) further away from the election
       • Pollsters are also “rewarded” for “degree of difficulty” of
         predictions
            – It’s harder to accurately predict state and local elections than
              national popular vote in a presidential election, and to predict
              primaries than “generals” – as demonstrated in the following
              average percent error bar chart


                                   11                  Consolidated Behaviors and Attitudes
Nate’s Approach to
 Forecasting the Elections (9)
• Nearest Neighbor
   – Particularly useful for states that have low levels of
     polling
       • This tends to be true for states with lower population and
         for states “not in play”
   – Nate Silver is a big fan of Bayesian approaches and Bayesian
     thinking – could he have used such approaches, instead of
     Nearest Neighbor, to “borrow” information from similar states?


                                12               Consolidated Behaviors and Attitudes
Nate’s Approach to
 Forecasting the Elections (10)
• Modeling Uncertainty: based on a number of factors,
  each state forecast includes both a point forecast and an
  “uncertainty distribution” (a normal curve????).
  Uncertainty is influenced by:
    – Number of (reliable) polls
    – Sample sizes
    – Number of undecided voters
    – Consistency of the polls being averaged (size of standard
      deviation)
    – Time until election
        • Has Nate modeled levels of uncertainty in various kinds of
          elections at various removes from the election? How is this
          analysis done?
    – NOTE: Nate provides both a “Now Forecast” (“If the election
      were held today …”) and a true forecast. These completely
      converge as election nears


                                 13               Consolidated Behaviors and Attitudes
Nate’s Approach to
 Forecasting the Elections (11)
• Monte Carlo Simulation: on a regular basis (eventually every
  night), 10,000 simulations of the election are run
    – Results for each state in each simulation is arrived at separately,
      providing both the “expected” (mean) result and the uncertainty (a
      normal curve???)
    – Some approach is used to take account that states are not
      independent of each other (e.g., Minnesota and Wisconsin tend to
      move in tandem) – nearest neighbor? Trending?
    – For each simulation, a winner is picked – and electoral votes
      assigned accordingly
    – For each simulation, electoral votes are totaled and a winner picked
    – The thousands of simulations provide a distribution of probable
      electoral college outcomes and a distribution of popular vote
      outcomes (by state and national)


                                  14               Consolidated Behaviors and Attitudes
Nate’s Approach to
 Forecasting the Elections (12)
• Major event adjustments
   – Based on previous elections, certain predictable events are expected
     to have a somewhat predictable effect over the course of the
     campaign cycle
        • In 2012, both candidates were “expected” to get a “convention bounce” of a
          certain magnitude
        • As challenger, Romney was also “expected “ to get a bounce of a certain
          magnitude from the 1st debate.
        • Bounces from previous elections tend to be “noisy” but do show average effects
   – The effect of the bounces s expected (predicted) to decay in
     predictable way
   – Nate Silver:
        • Factored in expected bounces and decays in making forecasts of final results
        • Recognized increased uncertainty during periods when bounces were most
          recent
        • Temporarily penalized or rewarded candidates who under- or over-performed
          the expected bounces


                                       15                   Consolidated Behaviors and Attitudes
Projected (Expected)
Convention Bounces


          16     Consolidated Behaviors and Attitudes
Additional Issues (Related to Polling)
Not Addressed in This Presentation
  • Differing Sampling Approaches of Polls
  • Differing Likely Voter Models of Polls
  • Differing Survey Media of Polls
     – Web only?
     – Include cell phones in sample?
  • Differing Weighting Schemes of Polls
     – To correct for demographic bias
     – To offset biases of particular survey media


                                17             Consolidated Behaviors and Attitudes
How Did Nate Do?
  Obama Won!


        18    Consolidated Behaviors and Attitudes
How Did Nate Do?
Obama Got 332 Electoral Votes: Exactly the Mode (Most
    Likely Outcome) of His Distribution Projection


                              19          Consolidated Behaviors and Attitudes
How Did Nate Do?
       Popular Vote: An Error of 1.3%
• Silver predicted a 2.5% gap – final result was a 3.8% gap


                                   20           Consolidated Behaviors and Attitudes
How Did Nate Do?
• He correctly called all 51 states – and called Florida as the only
  “tossup” – with Obama having a 50.3% chance of victory


                                    21            Consolidated Behaviors and Attitudes
Forecast Errors of the States
•   2 of 51 states were
    outside of the
    expected margin of
    error (we would have
    expected 1 state)
•   On average, Nate
    forecast the states
    0.2% too Republican
    (skewed slightly
    Republican)
•   Skewness = -0.6
•   Kurtosis = 0.75


                           “Too Democratic”           “Too Republican”


                                              22   Consolidated Behaviors and Attitudes
Errors in Key (Swing) States and
           States With Largest Errors
                   Swing States
           State                  Pct Too Republican
Colorado                                  2.2
Florida                                   0.6
Iowa                                      2.4
Michigan                                  1.4
Nevada                                    2.1              States With Greatest Errors
New Hampshire                             2.2
                                                             State         Pct Too Republican
North Carolina                           (0.5)
                                                        West Virginia            (10.6)
Ohio                                      1.7
                                                        Mississippi                9.1
Pennsylviania                            (0.8)
                                                        Hawaii                     9.0
Virginia                                  1.0
                                                        Alaska                     7.6
                                                        Montana                   (5.1)
                                                        North Dakota              (5.1)
                                                        Utah                      (5.1)
                                                        New Jersey                 5.0
                                                        Arizona                   (4.6)


                                                   23                   Consolidated Behaviors and Attitudes
Nate’s Approach to
     Forecasting the Elections
• Drilling Down Into Pollster Ratings (1)
   – Raw Scores Are Produced By a Multiple Regression
   – Variables in the regression include:
       • Dummy variables representing each pollster (the “B” of these
         dummy variables is the raw score for the pollster)
       • The square root of the number of days between the median polling
         date and the election (separate variables for primaries and general
         elections – because primaries are harder to predict)
       • Sample size (this variable is only marginally significant)
       • Dummy variables to represent the type of election and the cycle
         (e.g., a single variable represents a 2000 senatorial election)
       • A separate dummy variable to indicate primary vs. caucus
       • A set of dummy variables indicating particular races – for those
         races that have “robust” amounts of polling
            – Non-robust races lack these dummy variables, and are therefore
              compared against each other


                                     24                   Consolidated Behaviors and Attitudes
Nate’s Approach to
     Forecasting the Elections
• Drilling Down Into Pollster Ratings (2)
   – Regression data points are weighted based on:
       • How many surveys the pollster did for each particular election
       • How recent the election was (e.g., in 2010, 2008 elections were
         weighted twice as much as 1998 elections)
   – Raw rating scores are “regressed against the mean” to
     produce a final pollster rating
       • For the 2012 cycle, two raw regressions were done – one for the
         election cycles through 2008, and another for the 2010 election cycle.
       • The purpose was to understand how well the earlier regression
         predicted the 2010 regression for each pollster – and to “discount”
         each rating to account for how much of the rating was the result of
         “signal” and how much “noise” (don’t fully understand this)
       • The resulting formula provided a “reversion parameter” that
         calculated how much the raw score should be discounted, based on
         the following formula:
              reversionparameter = 1 - (0.06 * sqrt(number of surveys))


                                   25                 Consolidated Behaviors and Attitudes
Nate’s Approach to
     Forecasting the Elections
• Drilling Down Into Pollster Rations (3):
    – Example of regression against the mean of raw rating
      scores:
        • A particular pollster has a raw score of -0.50 (i.e., on a
          weighted average, their polls produce a 0.5% reduction in
          error compared to the average for all pollsters)
        • The same pollster has 25 polls in the sample
        • reversionparameter = 1 - (0.06 * sqrt(number of surveys))
          = 1 – (0.06 * sqrt(25))
          = 0.7
        • Final rating score = 0.50 * (1-0.7) = 0.15
    – In the regression against the A dummy variable
      representing whether the pollster has made one of two
      commitments to methodological transparency (a predictor
      of accuracy)


                                 26               Consolidated Behaviors and Attitudes
Principal Sources (1)
•   http://fivethirtyeight.blogs.nytimes.com/2012/06/07/election-forecast-obama-begins-with-
    tenuous-advantage/
•   http://fivethirtyeight.blogs.nytimes.com/2012/06/25/the-problems-with-forecasting-and-
    how-to-improve/
•   http://fivethirtyeight.blogs.nytimes.com/2012/07/05/measuring-the-effect-of-the-
    economy-on-elections/
•   http://fivethirtyeight.blogs.nytimes.com/2012/08/29/measuring-a-convention-bounce/
•   http://www.boston.com/sports/blogs/statsdriven/2012/11/nobodys_perfect_nate_silver_a
    n.html
•   http://fivethirtyeight.blogs.nytimes.com/2012/11/10/which-polls-fared-best-and-worst-in-
    the-2012-presidential-race/
•   http://jwrteaching.blogspot.com/2012/11/election-results-fivethirtyeight-and.html
•   http://www.guardian.co.uk/science/grrlscientist/2012/nov/08/nate-sliver-predict-us-
    election


                                                    27                  Consolidated Behaviors and Attitudes
Principal Sources (2)
•   http://venturebeat.com/2012/11/07/data-science/
•   http://en.wikipedia.org/wiki/Bayes_factor
•   http://fivethirtyeight.blogs.nytimes.com/2012/06/22/calculating-house-effects-of-polling-
    firms/
•   http://fivethirtyeight.blogs.nytimes.com/2012/10/18/gallup-vs-the-world/
•   http://fivethirtyeight.blogs.nytimes.com/2012/11/10/which-polls-fared-best-and-worst-in-
    the-2012-presidential-race/#more-37396
•   http://www.fivethirtyeight.com/2010/06/pollster-ratings-v40-methodology.html
•   http://fivethirtyeight.blogs.nytimes.com/fivethirtyeights-2012-forecast/
•   http://www.fivethirtyeight.com/2008/03/frequently-asked-questions-last-revised.html
•   http://en.wikipedia.org/wiki/FiveThirtyEight
•   http://www.fivethirtyeight.com/2008/06/we-know-more-than-we-think-big-change-2.html
•   mitch.watnik.com/symposium/silver%20nate.ppt


                                                     28                   Consolidated Behaviors and Attitudes

Más contenido relacionado

Similar a Modeling 2012 US Election

[DSC Europe 23] Alen Kisic - How can do Facebook data and machine learning al...
[DSC Europe 23] Alen Kisic - How can do Facebook data and machine learning al...[DSC Europe 23] Alen Kisic - How can do Facebook data and machine learning al...
[DSC Europe 23] Alen Kisic - How can do Facebook data and machine learning al...DataScienceConferenc1
 
Extrapolation of data from key population surveys and programs
Extrapolation of data from key population surveys and programsExtrapolation of data from key population surveys and programs
Extrapolation of data from key population surveys and programsMEASURE Evaluation
 
Who should be nominated to run in the 2012 U.S. presidential election?
Who should be nominated to run in the 2012 U.S. presidential election?Who should be nominated to run in the 2012 U.S. presidential election?
Who should be nominated to run in the 2012 U.S. presidential election?agraefe
 
OverviewIn this module, you will finalize the completion of .docx
OverviewIn this module, you will finalize the completion of .docxOverviewIn this module, you will finalize the completion of .docx
OverviewIn this module, you will finalize the completion of .docxaman341480
 
How opinion polls work
 How opinion polls work How opinion polls work
How opinion polls workInternewsKE
 
National Economic Voting in U.S.
National Economic Voting in U.S.National Economic Voting in U.S.
National Economic Voting in U.S.Jyung-Ho Yang
 
Bolden.saturday
Bolden.saturdayBolden.saturday
Bolden.saturdaynado-web
 
Effect of Religiosity & Ethnocentrism on Consumer buying pattern
Effect of Religiosity & Ethnocentrism on Consumer buying patternEffect of Religiosity & Ethnocentrism on Consumer buying pattern
Effect of Religiosity & Ethnocentrism on Consumer buying patternSoumyadeep Chowdhury
 
BS 1 and 2 30th Oct.pptx
BS 1 and 2 30th Oct.pptxBS 1 and 2 30th Oct.pptx
BS 1 and 2 30th Oct.pptxTanMak1
 
Day 10 - Dynamics of Voting
Day 10 - Dynamics of VotingDay 10 - Dynamics of Voting
Day 10 - Dynamics of VotingLee Hannah
 
Foreign Policy and Level of Analysis Problem
Foreign Policy and Level of Analysis ProblemForeign Policy and Level of Analysis Problem
Foreign Policy and Level of Analysis ProblemAbdul Basit Adeel
 
Gender indicators and sex disaggregated data
Gender indicators and sex disaggregated dataGender indicators and sex disaggregated data
Gender indicators and sex disaggregated datanavaneetarath
 
Gender indicators and sex disaggregated data
Gender indicators and sex disaggregated dataGender indicators and sex disaggregated data
Gender indicators and sex disaggregated datanavaneetarath
 
Gender indicators and sex disaggregated data
Gender indicators and sex disaggregated dataGender indicators and sex disaggregated data
Gender indicators and sex disaggregated datanavaneetarath
 
2018 Minnesota State Election Prediction
2018 Minnesota State Election Prediction2018 Minnesota State Election Prediction
2018 Minnesota State Election Prediction蕙綸 郭
 

Similar a Modeling 2012 US Election (20)

[DSC Europe 23] Alen Kisic - How can do Facebook data and machine learning al...
[DSC Europe 23] Alen Kisic - How can do Facebook data and machine learning al...[DSC Europe 23] Alen Kisic - How can do Facebook data and machine learning al...
[DSC Europe 23] Alen Kisic - How can do Facebook data and machine learning al...
 
Extrapolation of data from key population surveys and programs
Extrapolation of data from key population surveys and programsExtrapolation of data from key population surveys and programs
Extrapolation of data from key population surveys and programs
 
Who should be nominated to run in the 2012 U.S. presidential election?
Who should be nominated to run in the 2012 U.S. presidential election?Who should be nominated to run in the 2012 U.S. presidential election?
Who should be nominated to run in the 2012 U.S. presidential election?
 
OverviewIn this module, you will finalize the completion of .docx
OverviewIn this module, you will finalize the completion of .docxOverviewIn this module, you will finalize the completion of .docx
OverviewIn this module, you will finalize the completion of .docx
 
How opinion polls work
 How opinion polls work How opinion polls work
How opinion polls work
 
National Economic Voting in U.S.
National Economic Voting in U.S.National Economic Voting in U.S.
National Economic Voting in U.S.
 
sec Presentation.pdf
sec Presentation.pdfsec Presentation.pdf
sec Presentation.pdf
 
Complete Study
Complete StudyComplete Study
Complete Study
 
Ch06 maxfield pp ts
Ch06 maxfield pp tsCh06 maxfield pp ts
Ch06 maxfield pp ts
 
Bolden.saturday
Bolden.saturdayBolden.saturday
Bolden.saturday
 
Effect of Religiosity & Ethnocentrism on Consumer buying pattern
Effect of Religiosity & Ethnocentrism on Consumer buying patternEffect of Religiosity & Ethnocentrism on Consumer buying pattern
Effect of Religiosity & Ethnocentrism on Consumer buying pattern
 
BS 1 and 2 30th Oct.pptx
BS 1 and 2 30th Oct.pptxBS 1 and 2 30th Oct.pptx
BS 1 and 2 30th Oct.pptx
 
Day 10 - Dynamics of Voting
Day 10 - Dynamics of VotingDay 10 - Dynamics of Voting
Day 10 - Dynamics of Voting
 
statistics.pdf
statistics.pdfstatistics.pdf
statistics.pdf
 
Foreign Policy and Level of Analysis Problem
Foreign Policy and Level of Analysis ProblemForeign Policy and Level of Analysis Problem
Foreign Policy and Level of Analysis Problem
 
Gender indicators and sex disaggregated data
Gender indicators and sex disaggregated dataGender indicators and sex disaggregated data
Gender indicators and sex disaggregated data
 
Gender indicators and sex disaggregated data
Gender indicators and sex disaggregated dataGender indicators and sex disaggregated data
Gender indicators and sex disaggregated data
 
Gender indicators and sex disaggregated data
Gender indicators and sex disaggregated dataGender indicators and sex disaggregated data
Gender indicators and sex disaggregated data
 
2018 Minnesota State Election Prediction
2018 Minnesota State Election Prediction2018 Minnesota State Election Prediction
2018 Minnesota State Election Prediction
 
Lr 1 Intro.pdf
Lr 1 Intro.pdfLr 1 Intro.pdf
Lr 1 Intro.pdf
 

Modeling 2012 US Election

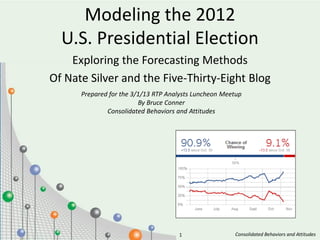
  • 1. Modeling the 2012 U.S. Presidential Election Exploring the Forecasting Methods Of Nate Silver and the Five-Thirty-Eight Blog Prepared for the 3/1/13 RTP Analysts Luncheon Meetup By Bruce Conner Consolidated Behaviors and Attitudes 1 Consolidated Behaviors and Attitudes
  • 2. Purposes of This Discussion • Walk through the elements of Nate Silver’s methods in predicting the 2012 Presidential election • “Kick around” some outstanding questions about those methods • Explore whether participating analysts are using similar methods in their day-to-day work – and how they are using them? • Sources listed in a “rough bibliography” at the back of this presentation 2 Consolidated Behaviors and Attitudes
  • 3. Background: Nate Silver • Developed PECOTA, a highly-successful “sabremetric” model used for forecasting the performance and career development of Major League players • In 2008: – Correctly predicted 49 out of 50 states (missed on Indiana) – Correctly predicted all U.S. Senate elections – Made better predictions for some of the primaries than major polls, using a demographic prediction model • In 2010, less good predictions in U.S. House races • In 2012: – Correctly predicted all 50 states and the District of Columbia 3 Consolidated Behaviors and Attitudes
  • 4. Nate’s Approach to Forecasting the Elections (1) • Forecast Each State – As we learned in 2000, the election is decided in the Electoral College: – Nate decomposes the election into the 50 states and the District of Columbia, and forecasts popular vote in each separately – National projections of popular vote are simply the aggregate of the state popular votes – This approach is a type of hierarchical modeling • Who is using hierarchical modeling techniques – and how are you using them? • Leverage Multiple Data/Predictor Sources – Polls within each state – Voter registration and demographics – Economic indicators – “Borrowed information” from other (similar) states – National polling (used only for inferring trends in the individual states) – Etc. 4 Consolidated Behaviors and Attitudes
  • 5. Nate’s Approach to Forecasting the Elections (2) • Calibration of Each Poll (Offsetting “House Effects”) – Measure -- and offset -- systematic bias of each pollster – This is done by a regression for each pollster of all their national polls against a weighted average of the national polls, as well as a regression of their polls in the various states against a weighted average of the polls in each state. Nate also lowered weight of polls that seem to be consistent outliers 5 Consolidated Behaviors and Attitudes
  • 6. Nate’s Approach to Forecasting the Elections (3) • An Economic Index is Used as an “Additional Poll.” It is based on: – The four factors used to date recessions • Job growth (nonfarm payrolls) • Personal income • Industrial production • Consumption – Inflation (CPI) – Change in S&P 500 Index – Consensus forecast of gross domestic product growth over the next two economic quarters, as taken from the median of The Wall Street Journal’s monthly forecasting panel • The economic index is used as a predictor of trend in future polls – as a “gravitational factor” that is likely to influence polls in the coming periods (with a lag effect). It is gradually removed (deweighted) from the model as the election approaches. 6 Consolidated Behaviors and Attitudes
  • 7. Nate’s Approach to Forecasting the Elections (4) • Adjustment to state-level polls based on trend – National polls and state polls show trends over time – Particularly when some states do not have recent polls (or recent polls by a particular pollster), it is often reasonable to infer that if those polls would have been repeated today, they would be affected by trends – The method to determine trends is a regression with (1) dummy variables for each week and (2) dummy variables for each pollster in each state. – A LOESS regression is used to smooth the trend. – A “trend” correction is then applied to the older polls to reflect the effects of the trend since the poll was taken – An example of “Bayesian thinking” 7 Consolidated Behaviors and Attitudes
  • 8. Nate’s Approach to Forecasting the Elections (5) • A multiple regression of demographics, registration, and similar factors is treated as an additional poll – Voter registration, race, gender, age, income, etc. as predictors of how a state will vote 8 Consolidated Behaviors and Attitudes
  • 9. Nate’s Approach to Forecasting the Elections (6) • Weighted Averaging of Polls – The predictions from the demographic regression and from the economic index are treated as additional polls – Weight of the economic index is reduced as election approaches, until it disappears in the final forecast – Weighting of Polls Against Each Other Is Based On • Sample size • Recency (weighting is done using a “half life” formula – because polls closer to the election are more accurate) • Ratings of pollsters (see following slides) 9 Consolidated Behaviors and Attitudes
  • 10. Nate’s Approach to Forecasting the Elections (7) • Pollster Ratings* Reflect Accuracy of Each Pollster in Predicting Actual Election Results – Raw ratings scores are done based on a multiple regression – Each data point is a published poll taken by a pollster in one of: • A presidential, gubinatorial, senatorial, congressional, or “generic house” race • A full range of elections/primaries/caucuses • Within 21 days of an election, primary, or caucus • For elections starting with the 1998 election cycle – The rating of each pollster is based on all of the polls attributed to that pollster – across the years and in the different types of elections – The dependent variable is the size of the error in predicting the gap between the top two candidates *For more detail on pollster ratings methods, see additiona l slides near end of this presentation 10 Consolidated Behaviors and Attitudes
  • 11. Nate’s Approach to Forecasting the Elections (8) • Pollster Ratings (Continued) – Some properties of the raw rating regression: • Pollsters are “rewarded” for accurately predicting results (minimizing error) further away from the election • Pollsters are also “rewarded” for “degree of difficulty” of predictions – It’s harder to accurately predict state and local elections than national popular vote in a presidential election, and to predict primaries than “generals” – as demonstrated in the following average percent error bar chart 11 Consolidated Behaviors and Attitudes
  • 12. Nate’s Approach to Forecasting the Elections (9) • Nearest Neighbor – Particularly useful for states that have low levels of polling • This tends to be true for states with lower population and for states “not in play” – Nate Silver is a big fan of Bayesian approaches and Bayesian thinking – could he have used such approaches, instead of Nearest Neighbor, to “borrow” information from similar states? 12 Consolidated Behaviors and Attitudes
  • 13. Nate’s Approach to Forecasting the Elections (10) • Modeling Uncertainty: based on a number of factors, each state forecast includes both a point forecast and an “uncertainty distribution” (a normal curve????). Uncertainty is influenced by: – Number of (reliable) polls – Sample sizes – Number of undecided voters – Consistency of the polls being averaged (size of standard deviation) – Time until election • Has Nate modeled levels of uncertainty in various kinds of elections at various removes from the election? How is this analysis done? – NOTE: Nate provides both a “Now Forecast” (“If the election were held today …”) and a true forecast. These completely converge as election nears 13 Consolidated Behaviors and Attitudes
  • 14. Nate’s Approach to Forecasting the Elections (11) • Monte Carlo Simulation: on a regular basis (eventually every night), 10,000 simulations of the election are run – Results for each state in each simulation is arrived at separately, providing both the “expected” (mean) result and the uncertainty (a normal curve???) – Some approach is used to take account that states are not independent of each other (e.g., Minnesota and Wisconsin tend to move in tandem) – nearest neighbor? Trending? – For each simulation, a winner is picked – and electoral votes assigned accordingly – For each simulation, electoral votes are totaled and a winner picked – The thousands of simulations provide a distribution of probable electoral college outcomes and a distribution of popular vote outcomes (by state and national) 14 Consolidated Behaviors and Attitudes
  • 15. Nate’s Approach to Forecasting the Elections (12) • Major event adjustments – Based on previous elections, certain predictable events are expected to have a somewhat predictable effect over the course of the campaign cycle • In 2012, both candidates were “expected” to get a “convention bounce” of a certain magnitude • As challenger, Romney was also “expected “ to get a bounce of a certain magnitude from the 1st debate. • Bounces from previous elections tend to be “noisy” but do show average effects – The effect of the bounces s expected (predicted) to decay in predictable way – Nate Silver: • Factored in expected bounces and decays in making forecasts of final results • Recognized increased uncertainty during periods when bounces were most recent • Temporarily penalized or rewarded candidates who under- or over-performed the expected bounces 15 Consolidated Behaviors and Attitudes
  • 16. Projected (Expected) Convention Bounces 16 Consolidated Behaviors and Attitudes
  • 17. Additional Issues (Related to Polling) Not Addressed in This Presentation • Differing Sampling Approaches of Polls • Differing Likely Voter Models of Polls • Differing Survey Media of Polls – Web only? – Include cell phones in sample? • Differing Weighting Schemes of Polls – To correct for demographic bias – To offset biases of particular survey media 17 Consolidated Behaviors and Attitudes
  • 18. How Did Nate Do? Obama Won! 18 Consolidated Behaviors and Attitudes
  • 19. How Did Nate Do? Obama Got 332 Electoral Votes: Exactly the Mode (Most Likely Outcome) of His Distribution Projection 19 Consolidated Behaviors and Attitudes
  • 20. How Did Nate Do? Popular Vote: An Error of 1.3% • Silver predicted a 2.5% gap – final result was a 3.8% gap 20 Consolidated Behaviors and Attitudes
  • 21. How Did Nate Do? • He correctly called all 51 states – and called Florida as the only “tossup” – with Obama having a 50.3% chance of victory 21 Consolidated Behaviors and Attitudes
  • 22. Forecast Errors of the States • 2 of 51 states were outside of the expected margin of error (we would have expected 1 state) • On average, Nate forecast the states 0.2% too Republican (skewed slightly Republican) • Skewness = -0.6 • Kurtosis = 0.75 “Too Democratic” “Too Republican” 22 Consolidated Behaviors and Attitudes
  • 23. Errors in Key (Swing) States and States With Largest Errors Swing States State Pct Too Republican Colorado 2.2 Florida 0.6 Iowa 2.4 Michigan 1.4 Nevada 2.1 States With Greatest Errors New Hampshire 2.2 State Pct Too Republican North Carolina (0.5) West Virginia (10.6) Ohio 1.7 Mississippi 9.1 Pennsylviania (0.8) Hawaii 9.0 Virginia 1.0 Alaska 7.6 Montana (5.1) North Dakota (5.1) Utah (5.1) New Jersey 5.0 Arizona (4.6) 23 Consolidated Behaviors and Attitudes
  • 24. Nate’s Approach to Forecasting the Elections • Drilling Down Into Pollster Ratings (1) – Raw Scores Are Produced By a Multiple Regression – Variables in the regression include: • Dummy variables representing each pollster (the “B” of these dummy variables is the raw score for the pollster) • The square root of the number of days between the median polling date and the election (separate variables for primaries and general elections – because primaries are harder to predict) • Sample size (this variable is only marginally significant) • Dummy variables to represent the type of election and the cycle (e.g., a single variable represents a 2000 senatorial election) • A separate dummy variable to indicate primary vs. caucus • A set of dummy variables indicating particular races – for those races that have “robust” amounts of polling – Non-robust races lack these dummy variables, and are therefore compared against each other 24 Consolidated Behaviors and Attitudes
  • 25. Nate’s Approach to Forecasting the Elections • Drilling Down Into Pollster Ratings (2) – Regression data points are weighted based on: • How many surveys the pollster did for each particular election • How recent the election was (e.g., in 2010, 2008 elections were weighted twice as much as 1998 elections) – Raw rating scores are “regressed against the mean” to produce a final pollster rating • For the 2012 cycle, two raw regressions were done – one for the election cycles through 2008, and another for the 2010 election cycle. • The purpose was to understand how well the earlier regression predicted the 2010 regression for each pollster – and to “discount” each rating to account for how much of the rating was the result of “signal” and how much “noise” (don’t fully understand this) • The resulting formula provided a “reversion parameter” that calculated how much the raw score should be discounted, based on the following formula: reversionparameter = 1 - (0.06 * sqrt(number of surveys)) 25 Consolidated Behaviors and Attitudes
  • 26. Nate’s Approach to Forecasting the Elections • Drilling Down Into Pollster Rations (3): – Example of regression against the mean of raw rating scores: • A particular pollster has a raw score of -0.50 (i.e., on a weighted average, their polls produce a 0.5% reduction in error compared to the average for all pollsters) • The same pollster has 25 polls in the sample • reversionparameter = 1 - (0.06 * sqrt(number of surveys)) = 1 – (0.06 * sqrt(25)) = 0.7 • Final rating score = 0.50 * (1-0.7) = 0.15 – In the regression against the A dummy variable representing whether the pollster has made one of two commitments to methodological transparency (a predictor of accuracy) 26 Consolidated Behaviors and Attitudes
  • 27. Principal Sources (1) • http://fivethirtyeight.blogs.nytimes.com/2012/06/07/election-forecast-obama-begins-with- tenuous-advantage/ • http://fivethirtyeight.blogs.nytimes.com/2012/06/25/the-problems-with-forecasting-and- how-to-improve/ • http://fivethirtyeight.blogs.nytimes.com/2012/07/05/measuring-the-effect-of-the- economy-on-elections/ • http://fivethirtyeight.blogs.nytimes.com/2012/08/29/measuring-a-convention-bounce/ • http://www.boston.com/sports/blogs/statsdriven/2012/11/nobodys_perfect_nate_silver_a n.html • http://fivethirtyeight.blogs.nytimes.com/2012/11/10/which-polls-fared-best-and-worst-in- the-2012-presidential-race/ • http://jwrteaching.blogspot.com/2012/11/election-results-fivethirtyeight-and.html • http://www.guardian.co.uk/science/grrlscientist/2012/nov/08/nate-sliver-predict-us- election 27 Consolidated Behaviors and Attitudes
  • 28. Principal Sources (2) • http://venturebeat.com/2012/11/07/data-science/ • http://en.wikipedia.org/wiki/Bayes_factor • http://fivethirtyeight.blogs.nytimes.com/2012/06/22/calculating-house-effects-of-polling- firms/ • http://fivethirtyeight.blogs.nytimes.com/2012/10/18/gallup-vs-the-world/ • http://fivethirtyeight.blogs.nytimes.com/2012/11/10/which-polls-fared-best-and-worst-in- the-2012-presidential-race/#more-37396 • http://www.fivethirtyeight.com/2010/06/pollster-ratings-v40-methodology.html • http://fivethirtyeight.blogs.nytimes.com/fivethirtyeights-2012-forecast/ • http://www.fivethirtyeight.com/2008/03/frequently-asked-questions-last-revised.html • http://en.wikipedia.org/wiki/FiveThirtyEight • http://www.fivethirtyeight.com/2008/06/we-know-more-than-we-think-big-change-2.html • mitch.watnik.com/symposium/silver%20nate.ppt 28 Consolidated Behaviors and Attitudes