1. An International
Destination for Business
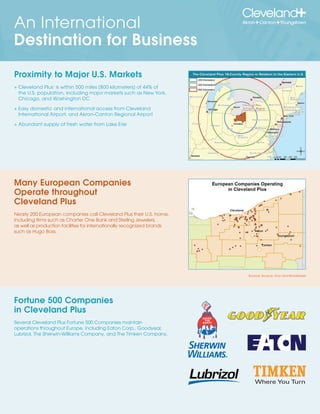
Proximity to Major U.S. Markets
+ Cleveland Plus is within 500 miles (800 kilometers) of 44% of
®
the U.S. population, including major markets such as New York,
Chicago, and Washington DC
+ Easy domestic and international access from Cleveland
International Airport, and Akron-Canton Regional Airport
+ Abundant supply of fresh water from Lake Erie
Many European Companies
Operate throughout
Cleveland Plus
Nearly 200 European companies call Cleveland Plus their U.S. home,
including firms such as Charter One Bank and Sterling Jewelers,
as well as production facilities for internationally recognized brands
such as Hugo Boss.
Source: Source: Dun and Bradstreet
Fortune 500 Companies
in Cleveland Plus
Several Cleveland Plus Fortune 500 Companies maintain
operations throughout Europe, including Eaton Corp., Goodyear,
Lubrizol, The Sherwin-Williams Company, and The Timken Company.
2. Wage Comparison: Cleveland Plus vs. Other Metro Areas
(All Wages in EUROS)
Mean Hourly Wage Mean Hourly Wage Mean Hourly Wage Mean Hourly Wage
Occupation SOC Code in Cleveland Plus in Washington D.C. in Chicago in New York
Chief Executives 11-1011 54.02 59.76 56.16 65.73
Lawyers 23-1011 34.30 47.57 45.75 48.64
Computer Programmers 15-1021 21.47 27.34 25.85 25.91
Customer Service Representatives 43-4051 10.61 11.46 11.89 11.92
Machinists 51-4041 11.83 15.50 12.44 13.12
Truck Drivers 53-3032 12.99 13.09 14.67 14.69
Source : Bureau of Labor Statistics (BLS)
Cleveland Plus Offers Unequaled 2008 Per Capita Personal Income by MSA
( Adjusted for Cost of Living)
Quality of Life
Cleveland Plus
+ When adjusting income for cost of living, the Cleveland Plus
Boston
region offers much more in total compensation for your Euro
Washington DC
+ At nearly 30,000 Euros, per capita income in Cleveland Plus Orlando
gets you much more for your money than many other Chicago
U.S. markets Miami
New York
Los Angeles
This graph depicts the per capita personal income as adjusted for the
San Francisco
cost of living. The highest adjusted income is at the top of the graph.
Cities that have a below average cost of living are adjusted upward
10,000 20,000 30,000 40,000 50,000
by adding the orange bar to the teal. Cities with above average cost
of living are adjusted downward by reducing the size of the teal bar. All Values in EUROS
Net Income Gain Net Income Loss
Source: BLS, C2ER
Quality Space at Commercial Lease Rates
Cleveland Plus vs. Other Metro Areas
Competitive Prices
+ Much lower cost per square meter than other proximate Class A
markets, such as Chicago, New York and Washington DC
+ Class A Space includes the most modern and convenient
space, while Class B and C space offer affordable Class B
alternatives while still maintaining many amenities
Class C
0 50 100 150 200 250 300 350 400 450 500
Cost per square meter in EUROS Cleveland Plus Washington D.C. Chicago New York
Source: Co Star
clevelandplusbusiness.com