Belize - Trade Profile UWI's Shridath Ramphal Centre
•
1 recomendación•409 vistas

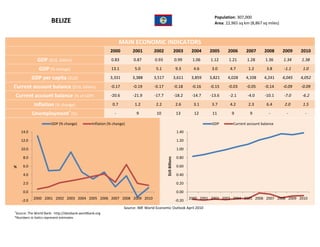
Belize has a population of 307,000 and an area of 22,965 square km. Its main economic indicators from 2000-2010 show GDP growth averaging around 4% annually, with GDP per capita around $4,000. Its current account balance is negative, averaging around -$0.1 billion or -7% of GDP. Inflation has averaged around 3% and unemployment around 10%. Exports are led by seafood, sugar, and fuel, mainly to the US, UK, and Central America. Imports are led by fuel, electronics, and vehicles, mainly from the US, Netherlands, and Central America. Services exports are led by travel, while transportation and travel dominate imports.

Recomendados
Recomendados
Más contenido relacionado
La actualidad más candente
La actualidad más candente (17)
Similar a Belize - Trade Profile UWI's Shridath Ramphal Centre
Similar a Belize - Trade Profile UWI's Shridath Ramphal Centre (20)
Más de Office of Trade Negotiations (OTN), CARICOM Secretariat
Más de Office of Trade Negotiations (OTN), CARICOM Secretariat (20)
Belize - Trade Profile UWI's Shridath Ramphal Centre
- 1. Population: 307,000 BELIZE Area: 22,965 sq km (8,867 sq miles) MAIN ECONOMIC INDICATORS 2000 2001 2002 2003 2004 2005 2006 2007 2008 2009 2010 GDP ($US, billion) 0.83 0.87 0.93 0.99 1.06 1.12 1.21 1.28 1.36 1.34 1.38 GDP (% change) 13.1 5.0 5.1 9.3 4.6 3.0 4.7 1.2 3.8 -1.1 1.0 GDP per capita ($US) 3,331 3,388 3,517 3,611 3,859 3,821 4,028 4,108 4,241 4,045 4,052 Current account balance ($US, billion) -0.17 -0.19 -0.17 -0.18 -0.16 -0.15 -0.03 -0.05 -0.14 -0.09 -0.09 Current account balance (% of GDP) -20.6 -21.9 -17.7 -18.2 -14.7 -13.6 -2.1 -4.0 -10.1 -7.0 -6.2 Inflation (% change) 0.7 1.2 2.2 2.6 3.1 3.7 4.2 2.3 6.4 2.0 1.5 Unemployment+ (%) - 9 10 13 12 11 9 9 - - - GDP (% change) Inflation (% change) GDP Current account balance 14.0 1.40 12.0 1.20 10.0 1.00 8.0 0.80 $US Billions % 6.0 0.60 4.0 0.40 2.0 0.20 0.0 0.00 2000 2001 2002 2003 2004 2005 2006 2007 2008 2009 2010 2000 2001 2002 2003 2004 2005 2006 2007 2008 2009 2010 -2.0 -0.20 Source: IMF World Economic Outlook April 2010 + Source: The World Bank - http://databank.worldbank.org *Numbers in italics represent estimates
- 2. Population: 307,000 BELIZE Area: 22,965 sq km (8,867 sq miles) MAIN TRADE INDICATORS – GOODS 2004 2005 2006 2007 2008 Trade Balance ($US thousands) -303,052 -231,064 -385,914 -417,708 -541,486 Total Exported Value ($US thousands) 210,972 207,520 274,429 266,634 295,058 Total Imported Value ($US thousands) 514,024 438,584 660,343 684,342 836,544 Top 10 Markets by % of Total Exported Value (2008) Top 10 Markets by % of Total Imported Value (2008) United States of America 45% United States of America 34% United Kingdom 20% Netherland Antilles 11.9% Costa Rica 17% Mexico 9.4% Netherlands 3% Panama 8.9% Trinidad and Tobago 3% China 8.1% Portugal 2% Guatemala 7% Mexico 2% Netherlands 2% Japan 2% Honduras 2% Jamaica 1% El Salvador 2% Belgium 1% Venezuela 2% Fish, Top 5 Exports by % of Total Exported Value (2008) Vehicles Top 5 Imports by % of Total Imported Value (2008) crustaceans, other than molluscs, Sugars and railway, Electrical, aquatic sugar tramway, 5% electronic invertebrates confectionery, equipment, 7% nes, 8% Mineral fuels, 13% Commodities not elsewhere oils, distillation specified, 22% Nuclear products, etc, reactors, 40% Edible fruit, boilers, nuts, peel of machinery, etc, Vegetable, fruit, citrus fruit, Mineral fuels, 8% nut, etc food melons, 15% oils, distillation preparations, products, etc, 19% 16% Source: International Trade Centre – www.trademap.org
- 3. Population: 307,000 BELIZE Area: 22,965 sq km (8,867 sq miles) MAIN TRADE INDICATORS – SERVICES 2004 2005 2006 2007 2008 Trade Balance ($US thousands) 88,220 142,990 210,720 229,920 219,470 Total Exported Value ($US thousands) 235,310 301,780 362,880 398,080 388,800 Total Imported Value ($US thousands) 147,090 158,790 152,160 168,160 169,330 Top Exports by % of Total Exported Value (2008) Top Imports by % of Total Imported Value (2008) Travel Transportation 41% 72% Travel 24% Other business services 10% Insurance services 13% Government services 8% Other business services 12% Government services 5% Transportation 6% Financial services 2% Communications services 3% Communications services 2% Computer & information services 1% Financial services 1% Royalties & license fees 0.4% Insurance services 0.04% Personal, cultural & recreational services 0.3% Source: International Trade Centre – www.trademap.org