

Recomendados
Más contenido relacionado
La actualidad más candente
La actualidad más candente (20)
Destacado
Destacado (8)
Similar a Wva milestone
Similar a Wva milestone (20)
Más de Clean Water
Más de Clean Water (20)
Último
Último (20)
Wva milestone
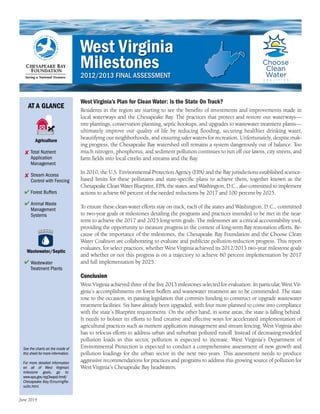
- 1. West Virginia’s Plan for Clean Water: Is the State On Track? Residents in the region are starting to see the benefits of investments and improvements made in local waterways and the Chesapeake Bay. The practices that protect and restore our waterways— tree plantings, conservation planning, septic hookups, and upgrades to wastewater treatment plants— ultimately improve our quality of life by reducing flooding, securing healthier drinking water, beautifying our neighborhoods, and ensuring safer waters for recreation. Unfortunately, despite mak- ing progress, the Chesapeake Bay watershed still remains a system dangerously out of balance. Too much nitrogen, phosphorus, and sediment pollution continues to run off our lawns, city streets, and farm fields into local creeks and streams and the Bay. In 2010, the U.S. Environmental Protection Agency (EPA) and the Bay jurisdictions established science- based limits for these pollutants and state-specific plans to achieve them, together known as the Chesapeake Clean Water Blueprint. EPA, the states, and Washington, D.C., also committed to implement actions to achieve 60 percent of the needed reductions by 2017 and 100 percent by 2025. To ensure these clean-water efforts stay on track, each of the states and Washington, D.C., committed to two-year goals or milestones detailing the programs and practices intended to be met in the near- term to achieve the 2017 and 2025 long-term goals. The milestones are a critical accountability tool, providing the opportunity to measure progress in the context of long-term Bay restoration efforts. Be- cause of the importance of the milestones, the Chesapeake Bay Foundation and the Choose Clean Water Coalition are collaborating to evaluate and publicize pollution-reduction progress. This report evaluates, for select practices, whether West Virginia achieved its 2012/2013 two-year milestone goals and whether or not this progress is on a trajectory to achieve 60 percent implementation by 2017 and full implementation by 2025. Conclusion West Virginia achieved three of the five 2013 milestones selected for evaluation. In particular, West Vir- ginia’s accomplishments on forest buffers and wastewater treatment are to be commended. The state rose to the occasion, in passing legislation that commits funding to construct or upgrade wastewater treatment facilities. Six have already been upgraded, with four more planned to come into compliance with the state’s Blueprint requirements. On the other hand, in some areas, the state is falling behind. It needs to bolster its efforts to find creative and effective ways for accelerated implementation of agricultural practices such as nutrient application management and stream fencing. West Virginia also has to refocus efforts to address urban and suburban polluted runoff. Instead of decreasing modeled pollution loads in this sector, pollution is expected to increase. West Virginia’s Department of Environmental Protection is expected to conduct a comprehensive assessment of new growth and pollution loadings for the urban sector in the next two years. This assessment needs to produce aggressive recommendations for practices and programs to address this growing source of pollution for West Virginia’s Chesapeake Bay headwaters. June 2014 AT A GLANCE Agriculture Total Nutrient Application Management Stream Access Control with Fencing Forest Buffers Animal Waste Management Systems Wastewater/Septic Wastewater Treatment Plants See the charts on the inside of this sheet for more information. For more detailed information on all of West Virginia’s milestone goals, go to: www.epa.gov/reg3wapd/tmdl/ Chesapeake Bay/EnsuringRe- sults.html. 2012/2013 FINAL ASSESSMENT West Virginia Milestones 6 Herndon Avenue | Annapolis, Maryland 21403 888/SAVEBAY | cbf.org How this Report was Compiled We selected a subset of implemented practices within three pollution source categories—agricultural runoff, urban/suburban sources, and wastewater treatment—based on their potential to provide substantial nitrogen, phosphorus, and sediment pollution reductions and offer important lessons for implementation mov- ing forward. For each practice, progress (% achievement) was eval- uated by looking at incremental progress between the base year, 2011, and 2013, compared to the 2013 milestone goal. Progress during this milestone period was also compared to the long-term (2017 and 2025) implementation benchmarks that the states and Washington, D.C., committed to in their Watershed Implemen- tation Plans. Data were provided by the U.S. Environmental Protection Agency’s Chesapeake Bay Program Office. 706 Giddings Avenue Suite 1-B | Annapolis, Maryland 21401 443/759-3400 | choosecleanwater.org Pollution Reduction in West Virginia at a Glance West Virginia achieved its overall pollution-reduction goals for 2013. Much of this success is due to progress in wastewater treatment through completed facility upgrades. Some agricul- tural practices are showing modest improvement, but need to increase in pace to achieve long-term goals. Polluted runoff from urban and suburban sources is one of the areas of growing nitrogen pollution. Investment in more ambitious practices and programming for polluted-runoff management is needed to re- verse this trend. 0 500 1,000 1,500 2,000 3,000 2025201720132011 2025 GOAL AGRICULTURE 2,500 2017 GOAL POLLUTED RUNOFF WASTEWATER/SEPTIC Modeled Nitrogen Loads and Long Term Goals in West Virginia by Sector (thousands of pounds) Source: Chesapeake Bay Program Watershed Model 5.3.2 0 100 200 300 400 600 2025201720132011 2025 GOAL POLLUTED RUNOFFWASTEWATER AGRICULTURE 500 2017 GOAL Modeled Phosphorus Loads and Long Term Goals in West Virginia by Sector (thousands of pounds) Success Story In addition to the Conservation Reserve Enhancement Program, a contributor to the success in exceeding the forest buffer milestone is the West Virginia Project CommuniTree (CTree). CTree promotes tree planting and education on public land through volunteerism in the Potomac Headwaters of West Virginia.The program also focuses on enhancing and promoting awareness of watershed and stream-side needs such as polluted-runoff mitigation, water- quality issues, buffer-zone planting, and reducing soil erosion. The project is funded by the USDA Forest Service and West Virginia Chesapeake Bay Program to engage stakeholders in the process of mak- ing priority decisions within their respective communities. It also offers a strong educational message along with a physical planting component. CTree is a model public-private partnership led by Cacapon Institute, West Virginia Division of Forestry,West Virginia Conservation Agency, and the West Virginia Department of Environmental Protection.As members of the West Virginia Chesapeake Tributary Team, they are driving on-the- ground actions throughout the Potomac headwaters.
- 2. 0 20,000 40,000 80,000 2011 2015 2019 2021 2023 60,000 2013 2017 G 2025 G MILESTONEPROGRESS 0 2,000 4,000 8,000 2011 2015 2019 2021 2023 6,000 2013 2017 2025 MILESTONEPROGRESS 0 5,000 10,000 20,000 2011 2015 2019 2021 2023 15,000 2013 2017 G 2025 G Assessment of West Virginia’s Progress on Selected Pollution-Reduction Practices for 2013 Total Nutrient Application Management acres West Virginia fell short of meeting the 2013 milestone goal for this practice. However, the 2013 milestone goal was set before the state had completed cleaning up historical nutrient management data, re- sulting in a goal set inadvertently high. Farm acres with nutrient application management need to continue to increase each year to achieve the 2017 goal. 0 30,000 60,000 150,000 2011 2015 2019 2021 2023 120,000 2013 2017 2025 90,000 18,913 (2-YEAR INCREMENTAL PROGRESS) 81,367 (2-YEAR INCREMENTAL MILESTONE) = 23% Progress Relative to Long-Term Goals (acres) Stream Access Control with Fencing acres Falling short,this program still shows success,with help from Farm Bill programs, the state Agriculture Enhancement Program, and innovative partnerships with non-governmental groups like Trout Unlimited. West Virginia is relying heavily on this practice to achieve its nitrogen and phosphorus pollution-reduction goals, so implementation efforts must be sustained. 1,194 (2-YEAR INCREMENTAL PROGRESS) 1,457 (2-YEAR INCREMENTAL MILESTONE) = 82% Progress Relative to Long-Term Goals (acres) Forest Buffers acres The success of this practice is largely due to the Farm Bill Conserva- tion Reserve Enhancement Program, which incentivizes conservation uses of land.This is a highly successful voluntary program.To achieve long-term (2017 and 2025) implementation goals for forest buffers, however, will require the implementation rate to roughly double in coming years. 391 (2-YEAR INCREMENTAL PROGRESS) 380 (2-YEAR INCREMENTAL MILESTONE) = 103% Progress Relative to Long-Term Goals (acres) Animal Waste Management Systems animal units WestVirginiaexceededits2013goalforthispracticewithasteadyincrease in implementation in the past couple of years.This practice is important to effectivelyreducenitrogenandphosphorouspollution.Implementationofthe West Virginia Confined Animal Feeding Operations Program has encouraged better manure storage practices that have helped accelerate implementation. 12,004 (2-YEAR INCREMENTAL PROGRESS) 435 (2-YEAR INCREMENTAL MILESTONE) = 2,760% Progress Relative to Long-Term Goals (animal units) Wastewater Treatment Plants # of permits issued meeting Blueprint requirements West Virginia accomplished its milestone goal for wastewater treat- ment through upgrades to six facilities. New construction and up- grades are made possible through a funding bill passed by the West Virginia Legislature. 0 15 20 2011 2015 2019 2021 20232013 G 2017 G 2025 G 10 5 6 (2-YEAR INCREMENTAL PROGRESS) 6 (2-YEAR INCREMENTAL MILESTONE) = 100% Progress Relative to Long-Term Goals (# of permits) Agriculture Wastewater/Septic P 2-YEAR INCREMENTAL PROGRESS M 2-YEAR INCREMENTAL MILESTONE MILESTONE MILESTONE P M P M P M P M P M P M P M P M P M P M PROGRESS PROGRESS MILESTONE PROGRESS
- 3. 0 20,000 40,000 80,000 2011 2015 2019 2021 2023 60,000 2013 2017 G 2025 G MILESTONEPROGRESS 0 2,000 4,000 8,000 2011 2015 2019 2021 2023 6,000 2013 2017 2025 MILESTONEPROGRESS 0 5,000 10,000 20,000 2011 2015 2019 2021 2023 15,000 2013 2017 G 2025 G Assessment of West Virginia’s Progress on Selected Pollution-Reduction Practices for 2013 Total Nutrient Application Management acres West Virginia fell short of meeting the 2013 milestone goal for this practice. However, the 2013 milestone goal was set before the state had completed cleaning up historical nutrient management data, re- sulting in a goal set inadvertently high. Farm acres with nutrient application management need to continue to increase each year to achieve the 2017 goal. 0 30,000 60,000 150,000 2011 2015 2019 2021 2023 120,000 2013 2017 2025 90,000 18,913 (2-YEAR INCREMENTAL PROGRESS) 81,367 (2-YEAR INCREMENTAL MILESTONE) = 23% Progress Relative to Long-Term Goals (acres) Stream Access Control with Fencing acres Falling short,this program still shows success,with help from Farm Bill programs, the state Agriculture Enhancement Program, and innovative partnerships with non-governmental groups like Trout Unlimited. West Virginia is relying heavily on this practice to achieve its nitrogen and phosphorus pollution-reduction goals, so implementation efforts must be sustained. 1,194 (2-YEAR INCREMENTAL PROGRESS) 1,457 (2-YEAR INCREMENTAL MILESTONE) = 82% Progress Relative to Long-Term Goals (acres) Forest Buffers acres The success of this practice is largely due to the Farm Bill Conserva- tion Reserve Enhancement Program, which incentivizes conservation uses of land.This is a highly successful voluntary program.To achieve long-term (2017 and 2025) implementation goals for forest buffers, however, will require the implementation rate to roughly double in coming years. 391 (2-YEAR INCREMENTAL PROGRESS) 380 (2-YEAR INCREMENTAL MILESTONE) = 103% Progress Relative to Long-Term Goals (acres) Animal Waste Management Systems animal units WestVirginiaexceededits2013goalforthispracticewithasteadyincrease in implementation in the past couple of years.This practice is important to effectivelyreducenitrogenandphosphorouspollution.Implementationofthe West Virginia Confined Animal Feeding Operations Program has encouraged better manure storage practices that have helped accelerate implementation. 12,004 (2-YEAR INCREMENTAL PROGRESS) 435 (2-YEAR INCREMENTAL MILESTONE) = 2,760% Progress Relative to Long-Term Goals (animal units) Wastewater Treatment Plants # of permits issued meeting Blueprint requirements West Virginia accomplished its milestone goal for wastewater treat- ment through upgrades to six facilities. New construction and up- grades are made possible through a funding bill passed by the West Virginia Legislature. 0 15 20 2011 2015 2019 2021 20232013 G 2017 G 2025 G 10 5 6 (2-YEAR INCREMENTAL PROGRESS) 6 (2-YEAR INCREMENTAL MILESTONE) = 100% Progress Relative to Long-Term Goals (# of permits) Agriculture Wastewater/Septic P 2-YEAR INCREMENTAL PROGRESS M 2-YEAR INCREMENTAL MILESTONE MILESTONE MILESTONE P M P M P M P M P M P M P M P M P M P M PROGRESS PROGRESS MILESTONE PROGRESS
- 4. West Virginia’s Plan for Clean Water: Is the State On Track? Residents in the region are starting to see the benefits of investments and improvements made in local waterways and the Chesapeake Bay. The practices that protect and restore our waterways— tree plantings, conservation planning, septic hookups, and upgrades to wastewater treatment plants— ultimately improve our quality of life by reducing flooding, securing healthier drinking water, beautifying our neighborhoods, and ensuring safer waters for recreation. Unfortunately, despite mak- ing progress, the Chesapeake Bay watershed still remains a system dangerously out of balance. Too much nitrogen, phosphorus, and sediment pollution continues to run off our lawns, city streets, and farm fields into local creeks and streams and the Bay. In 2010, the U.S. Environmental Protection Agency (EPA) and the Bay jurisdictions established science- based limits for these pollutants and state-specific plans to achieve them, together known as the Chesapeake Clean Water Blueprint. EPA, the states, and Washington, D.C., also committed to implement actions to achieve 60 percent of the needed reductions by 2017 and 100 percent by 2025. To ensure these clean-water efforts stay on track, each of the states and Washington, D.C., committed to two-year goals or milestones detailing the programs and practices intended to be met in the near- term to achieve the 2017 and 2025 long-term goals. The milestones are a critical accountability tool, providing the opportunity to measure progress in the context of long-term Bay restoration efforts. Be- cause of the importance of the milestones, the Chesapeake Bay Foundation and the Choose Clean Water Coalition are collaborating to evaluate and publicize pollution-reduction progress. This report evaluates, for select practices, whether West Virginia achieved its 2012/2013 two-year milestone goals and whether or not this progress is on a trajectory to achieve 60 percent implementation by 2017 and full implementation by 2025. Conclusion West Virginia achieved three of the five 2013 milestones selected for evaluation. In particular, West Vir- ginia’s accomplishments on forest buffers and wastewater treatment are to be commended. The state rose to the occasion, in passing legislation that commits funding to construct or upgrade wastewater treatment facilities. Six have already been upgraded, with four more planned to come into compliance with the state’s Blueprint requirements. On the other hand, in some areas, the state is falling behind. It needs to bolster its efforts to find creative and effective ways for accelerated implementation of agricultural practices such as nutrient application management and stream fencing. West Virginia also has to refocus efforts to address urban and suburban polluted runoff. Instead of decreasing modeled pollution loads in this sector, pollution is expected to increase. West Virginia’s Department of Environmental Protection is expected to conduct a comprehensive assessment of new growth and pollution loadings for the urban sector in the next two years. This assessment needs to produce aggressive recommendations for practices and programs to address this growing source of pollution for West Virginia’s Chesapeake Bay headwaters. June 2014 AT A GLANCE Agriculture Total Nutrient Application Management Stream Access Control with Fencing Forest Buffers Animal Waste Management Systems Wastewater/Septic Wastewater Treatment Plants See the charts on the inside of this sheet for more information. For more detailed information on all of West Virginia’s milestone goals, go to: www.epa.gov/reg3wapd/tmdl/ Chesapeake Bay/EnsuringRe- sults.html. 2012/2013 FINAL ASSESSMENT West Virginia Milestones 6 Herndon Avenue | Annapolis, Maryland 21403 888/SAVEBAY | cbf.org How this Report was Compiled We selected a subset of implemented practices within three pollution source categories—agricultural runoff, urban/suburban sources, and wastewater treatment—based on their potential to provide substantial nitrogen, phosphorus, and sediment pollution reductions and offer important lessons for implementation mov- ing forward. For each practice, progress (% achievement) was eval- uated by looking at incremental progress between the base year, 2011, and 2013, compared to the 2013 milestone goal. Progress during this milestone period was also compared to the long-term (2017 and 2025) implementation benchmarks that the states and Washington, D.C., committed to in their Watershed Implemen- tation Plans. Data were provided by the U.S. Environmental Protection Agency’s Chesapeake Bay Program Office. 706 Giddings Avenue Suite 1-B | Annapolis, Maryland 21401 443/759-3400 | choosecleanwater.org Pollution Reduction in West Virginia at a Glance West Virginia achieved its overall pollution-reduction goals for 2013. Much of this success is due to progress in wastewater treatment through completed facility upgrades. Some agricul- tural practices are showing modest improvement, but need to increase in pace to achieve long-term goals. Polluted runoff from urban and suburban sources is one of the areas of growing nitrogen pollution. Investment in more ambitious practices and programming for polluted-runoff management is needed to re- verse this trend. 0 500 1,000 1,500 2,000 3,000 2025201720132011 2025 GOAL AGRICULTURE 2,500 2017 GOAL POLLUTED RUNOFF WASTEWATER/SEPTIC Modeled Nitrogen Loads and Long Term Goals in West Virginia by Sector (thousands of pounds) Source: Chesapeake Bay Program Watershed Model 5.3.2 0 100 200 300 400 600 2025201720132011 2025 GOAL POLLUTED RUNOFFWASTEWATER AGRICULTURE 500 2017 GOAL Modeled Phosphorus Loads and Long Term Goals in West Virginia by Sector (thousands of pounds) Success Story In addition to the Conservation Reserve Enhancement Program, a contributor to the success in exceeding the forest buffer milestone is the West Virginia Project CommuniTree (CTree). CTree promotes tree planting and education on public land through volunteerism in the Potomac Headwaters of West Virginia.The program also focuses on enhancing and promoting awareness of watershed and stream-side needs such as polluted-runoff mitigation, water- quality issues, buffer-zone planting, and reducing soil erosion. The project is funded by the USDA Forest Service and West Virginia Chesapeake Bay Program to engage stakeholders in the process of mak- ing priority decisions within their respective communities. It also offers a strong educational message along with a physical planting component. CTree is a model public-private partnership led by Cacapon Institute, West Virginia Division of Forestry,West Virginia Conservation Agency, and the West Virginia Department of Environmental Protection.As members of the West Virginia Chesapeake Tributary Team, they are driving on-the- ground actions throughout the Potomac headwaters.