Más contenido relacionado
Market Metrics 5 14
- 1. J.D. Power and Associates does not guarantee the accuracy, adequacy, or completeness of any information contained in this publication and is not responsible for any
errors or omissions or for the results obtained from use of such information. Advertising claims cannot be based on informati on published in this publication. Reproduction
of any material contained in this publication, including photocopying in part or in whole, is prohibited without the express written permission of J.D. Power and Associates.
Any material quoted from this publication must be attributed to J.D. Power and Associates.
©2014 J.D. Power and Associates, The McGraw-Hill Companies, Inc. All Rights Reserved.
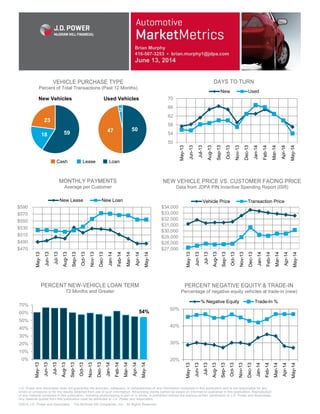
Brian Murphy
416-507-3253 ▪ brian.murphy1@jdpa.com
June 13, 2014
5918
23
5047
3
New Vehicles Used Vehicles
Cash Lease Loan
50
54
58
62
66
70
May-13
Jun-13
Jul-13
Aug-13
Sep-13
Oct-13
Nov-13
Dec-13
Jan-14
Feb-14
Mar-14
Apr-14
May-14
New Used
$470
$490
$510
$530
$550
$570
$590
May-13
Jun-13
Jul-13
Aug-13
Sep-13
Oct-13
Nov-13
Dec-13
Jan-14
Feb-14
Mar-14
Apr-14
May-14
New Lease New Loan
VEHICLE PURCHASE TYPE
Percent of Total Transactions (Past 12 Months)
DAYS TO TURN
MONTHLY PAYMENTS
Average per Customer
PERCENT NEW-VEHICLE LOAN TERM
72 Months and Greater
54%
0%
10%
20%
30%
40%
50%
60%
70%
May-13
Jun-13
Jul-13
Aug-13
Sep-13
Oct-13
Nov-13
Dec-13
Jan-14
Feb-14
Mar-14
Apr-14
May-14
NEW VEHICLE PRICE VS. CUSTOMER FACING PRICE
Data from JDPA PIN Incentive Spending Report (ISR)
20%
30%
40%
50%
May-13
Jun-13
Jul-13
Aug-13
Sep-13
Oct-13
Nov-13
Dec-13
Jan-14
Feb-14
Mar-14
Apr-14
May-14
% Negative Equity Trade-In %
PERCENT NEGATIVE EQUITY & TRADE-IN
Percentage of negative equity vehicles at trade-in (new)
$27,000
$28,000
$29,000
$30,000
$31,000
$32,000
$33,000
$34,000
May-13
Jun-13
Jul-13
Aug-13
Sep-13
Oct-13
Nov-13
Dec-13
Jan-14
Feb-14
Mar-14
Apr-14
May-14
Vehicle Price Transaction Price