

Recomendados
Recomendados
Más contenido relacionado
La actualidad más candente
La actualidad más candente (20)
Destacado
Destacado (17)
Similar a Deutsche EuroShop | Nine-month report 2013
Similar a Deutsche EuroShop | Nine-month report 2013 (19)
Más de Deutsche EuroShop AG
Más de Deutsche EuroShop AG (20)
Último
Último (20)
Deutsche EuroShop | Nine-month report 2013
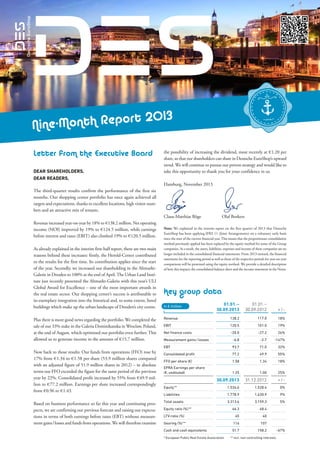
- 1. 13 o n t h Rep o r t 2 0 N ine-M Letter from the Executive Board Dear Shareholders, Dear Readers, the possibility of increasing the dividend, most recently at € 1.20 per share, so that our shareholders can share in Deutsche EuroShop’s upward trend. We will continue to pursue our proven strategy and would like to take this opportunity to thank you for your confidence in us. Hamburg, November 2013 The third-quarter results confirm the performance of the first six months. Our shopping center portfolio has once again achieved all targets and expectations, thanks to excellent locations, high visitor numbers and an attractive mix of tenants. Claus-Matthias Böge Revenue increased year-on-year by 18% to € 138.2 million. Net operating income (NOI) improved by 19% to € 124.5 million, while earnings before interest and taxes (EBIT) also climbed 19% to € 120.5 million. As already explained in the interim first-half report, there are two main reasons behind these increases: firstly, the Herold-Center contributed to the results for the first time. Its contribution applies since the start of the year. Secondly, we increased our shareholding in the AltmarktGalerie in Dresden to 100% at the end of April. The Urban Land Institute just recently presented the Altmarkt-Galerie with this year’s ULI Global Award for Excellence – one of the most important awards in the real estate sector. Our shopping center’s success is attributable to its exemplary integration into the historical and, to some extent, listed buildings which make up the urban landscape of Dresden’s city centre. Plus there is more good news regarding the portfolio: We completed the sale of our 33% stake in the Galeria Dominikanska in Wroclaw, Poland, at the end of August, which optimised our portfolio even further. This allowed us to generate income in the amount of € 15.7 million. Olaf Borkers Note: We explained in the interim report on the first quarter of 2013 that Deutsche E uroShop has been applying IFRS 11 (Joint Arrangements) on a voluntary early basis since the start of the current financial year. This means that the proportionate consolidation method previously applied has been replaced by the equity method for some of the Group companies. As a result, the assets, liabilities, expenses and income of these companies are no longer included in the consolidated financial statements. From 2013 onward, the financial statements for the reporting period as well as those of the respective periods for year-on-year comparisons will be presented using the equity method. We provide a detailed description of how this impacts the consolidated balance sheet and the income statement in the Notes. Key group data 01.01. – 30.09.2013 01.01. – 30.09.2012 + / - Revenue 138.2 117.0 18% EBIT 120.5 101.0 19% Net finance costs in € million Based on business performance so far this year and continuing prospects, we are confirming our previous forecast and raising our expectations in terms of both earnings before taxes (EBT) without measurement gains / losses and funds from operations. We will therefore examine -27.2 26% -6.8 -2.7 -147% EBT Now back to those results: Our funds from operations (FFO) rose by 17% from € 1.34 to € 1.58 per share (53.9 million shares compared with an adjusted figure of 51.9 million shares in 2012) – in absolute terms our FFO exceeded the figure for the same period of the previous year by 22%. Consolidated profit increased by 55% from € 49.9 million to € 77.2 million. Earnings per share increased correspondingly from € 0.96 to € 1.43. -20.0 Measurement gains / losses 93.7 71.0 32% Consolidated profit 77.2 49.9 55% FFO per share (€) 1.58 1.34 18% EPRA Earnings per share (€, undiluted) 1.25 1.00 25% 30.09.2013 31.12.2012 + / - Equity ** 1,534.6 1,528.4 0% Liabilities 1,778.9 1,630.9 9% Total assets 3,313.6 3,159.3 5% 46.3 48.4 45 40 Equity ratio (%) ** LTV-ratio (%) Gearing (%) ** 116 107 Cash and cash equivalents 51.7 158.2 * European Public Real Estate Association ** incl. non controlling interests -67%
- 2. Nine-month report 2013 Business and Economic Conditions {2} Group structure and operating activities Activities Deutsche EuroShop is the only public company in Germany to invest solely in shopping centers in prime locations. As at the reporting date, it had investments in 19 shopping centers in Germany, Austria, Poland and Hungary. The Group generates its reported revenue from rental income on the space which it lets in the shopping centers. Group’s legal structure Due to its lean personnel structure, the Deutsche EuroShop Group is centrally organised. The parent company, Deutsche EuroShop AG, is responsible for corporate strategy, portfolio and risk management, financing and communication. The Company’s registered office is in Hamburg. Deutsche EuroShop is an Aktiengesellschaft (stock corporation) under German law. The individual shopping centers are managed as separate companies and, depending on the share of nominal capital or voting rights, are either fully consolidated or accounted for at equity. The share capital amounts to € 53,945,536.00 and is composed of 53,945,536 no-par value registered shares. The notional value of each share is € 1.00. Macroeconomic and sector-specific conditions The eurozone’s economy is slowly recovering from its recession. Germany has weathered the crisis well so far and is still considered to be the growth driver within the currency area. While Germany’s gross domestic product stagnated in the first quarter of 2013 in comparison to the same quarter of the previous year, it rose by 0.7% in the period from April to June. Experts anticipate an increase of 0.5% for the third quarter. Germany continues to benefit from sound foreign trade and stable demand on the domestic front. In the first nine months of the year, German retail sales were 1.7% higher in nominal terms and 0.2% higher in real terms than in the same period of the previous year. Robust job market development bolstered this trend: 2.8 million people were out of work in October which corresponded to an unemployment rate of 6.5%. The economic conditions for private consumption remain favourable: the situation on the job market is positive and prices are stable. As a result, private consumer spending should continue to provide a solid basis for domestic demand over the rest of the year. DES Nine-month report 2013 Results of Operations, Financial Position and Net Assets Results of Operations Revenue increased by 18% Revenue amounted to € 138.2 million as at 30 September 2013. This is nearly 18% higher than in the same period of the previous year (€ 117.0 million). Following the increase in the shareholding in the Altmarkt-Galerie Dresden on 1 May 2013, the property is now fully consolidated and the center’s revenue is included in the financial statements for the reporting period for five months. The Herold-Center is also included in 2013 for the first time. Revenue from our shopping center portfolio rose by 1.0% (like-for-like) year-on-year. Operating and administrative costs for property: 9.9% of revenue Center operating costs were € 13.6 million in the reporting period, compared with € 12.5 million in the same period of the previous year. Costs therefore stood at 9.8% of revenue (previous year: 10.7%). Other operating expenses of € 4.7 million The other operating expenses of € 4.7 million were slightly higher than those of the previous year (€ 4.5 million) due to one-off costs incurred in connection with the withdrawal from DB 12 Immobilienfonds. EBIT up 19% Earnings before interest and taxes (EBIT) increased by around 19% or € 19.5 million from € 101.0 million to € 120.5 million. Net finance costs up due to one-off effect from the disposal of a shareholding Net finance costs include income of € 15.7 million from the sale of a stake in Ilwro Sp.zo.o. in Poland. Adjusted for this effect, net finance costs were down from € 8.5 million to € -35.8 million. Interest expenses were € 3.7 million higher than during the same period of the previous year which can be attributed to the convertible bond issued at the end of the previous year as well as the initial consolidation of the Altmarkt-Galerie Dresden for which interest savings were exceeded by the refinancing costs. In addition, the profit share for third-party shareholders rose by around € 1.1 million. Moreover, income from companies included using the equity method fell by € 4.6 million since 1 May 2013, mainly as a result of the consolidation of the Altmarkt-Galerie Dresden. Measurement gains / losses The measurement loss amounted to € 6.8 million and included investment costs incurred by our portfolio properties as well as an excess of identified net assets acquired over cost of acquisition in accordance with IFRS 3 from the first full consolidation of the Altmarkt-Galerie Dresden.
- 3. Nine-month report 2013 {3} Adjusted EBT excluding measurement gains / losses up 17% Earnings before taxes (EBT) climbed 31%, from € 71.0 million to € 93.7 million. Adjusted for the effect on results from the disposal of the Polish shareholding (€ 15.7 million) and measurement gains / losses, EBT rose from € 73.8 million to € 86.1 million (+17%). Included in these figures were measurement losses of € 6.8 million from fully-consolidated shareholdings and € 1.4 million for shareholdings accounted for using the equity method. Income taxes down on previous year Taxes on income and earnings declined as a result of last year’s restructuring. Overall, the tax ratio fell from 30% to 21%. Tax expense amounted to € 16.5 million. € 1.9 million of this (previous year: € 4.0 million) was attributable to taxes to be paid and € 14.6 million (previous year: € 17.0 million) to deferred taxes. Consolidated profit up 55% due to special effect Consolidated profit amounted to € 77.2 million, 55% higher yearon-year. Stripped of the income earned through the disposal of the Polish shareholding, year-on-year profit would have been 23% higher. Earnings per share (basic) amounted to € 1.43, compared with € 0.96 in the previous year. EPRA earnings per share rose 25% from € 1.00 per share to € 1.25. Earnings per share 01.01. – 30.09.2013 01.01. – 30.09.2012 in € thousands Consolidated profit Measurement gains / losses Measurement gains / losses for equity-accounted companies per share in € in € thousands per share in € 77,211 1.43 49,938 0.96 6,784 0.13 2,741 0.05 1,391 0.03 95 0.00 -15,746 -0.29 0 0.00 Deferred taxes -1,944 -0.04 -793 -0.02 EPRA * earnings 67,696 1.25 51,981 1.00 Proceeds from sales Weighted no. of shares in thousands * European Public Real Estate Association 53,945 51,935 Funds from operations (FFO) up 17% FFO rose from € 69.8 million to € 85.0 million, or from € 1.34 to € 1.58 per share (+17%). 01.01. – 30.09.2013 01.01. – 30.09.2012 77,211 49,938 Measurement gains / losses 6,784 2,741 Measurement gains / losses for equity-accounted companies 1,391 95 -15,746 0 834 0 Deferred taxes 14,619 17,031 FFO 85,093 69,805 1.58 1.34 in € thousands Consolidated profit Proceeds from sales Bond conversion expense per share (€) Financial Position and Net Assets Net assets and liquidity The Deutsche EuroShop Group’s total assets increased by € 154.3 million compared with the year-end figure in 2012 to € 3,313.6 million. Non-current assets increased by € 262.6 million. This is particularly attributable to the first full consolidation of the Altmarkt-Galerie Dresden. Receivables and other current assets decreased by € 1.9 million. At € 51.7 million, cash and cash equivalents were € 106.5 million lower than on 31 December 2012 (€ 158.2 million), which can largely be attributed to the acquisition of the 33% stake in the Altmarkt-Galerie Dresden and the dividend payment in June. Equity ratio of 46.3% As a result of the dividend paid in June (€ 64.7 million) the equity ratio (incl. shares held by third-party shareholders) decreased by 2.1 percentage points. It amounted to 46.3% on the reporting date compared to 48.4% on 31 December 2012. Liabilities As at 30 September 2013, financial liabilities stood at € 1,509.0 million and were thus € 151.3 million higher than at the end of 2012. The increase can also be mainly attributed to the first full consolidation of the Altmarkt-Galerie Dresden. Non-current deferred tax liabilities increased by € 16.5 million to € 197.0 million due to additional provisions. Redemption entitlements for third-party shareholders rose by around € 0.8 million. Other liabilities and provisions were reduced by € 19.7 million, primarily due to tax payments made. DES Nine-month report 2013
- 4. Nine-month report 2013 The Shopping Center Share {4} Deutsche EuroShop shares ended 2012 at a closing price of € 31.64. 2013 initially brought a slight decline however they later stabilised within a corridor of between € 31.00 and € 31.80. Following a gain in mid-April, DES shares rose to prices in excess of € 33.00 over the course of May. They reached € 34.48 on 20 May 2013, their high for the period and also a new all-time high for our shares. This was followed by a downward trend which culminated in a price of € 29.45 on 24 June, the lowest level for the period. The price stabilised between € 30.00 and € 32.70 by the end of the reporting period and was at € 32.03 on 30 September 2013. Taking into account the dividend of € 1.20 per share paid on 21 June 2013, this corresponds to a performance of 5.0% in the first nine months of the year. During this same period, the MDAX rose by 26.2% and the EPRA index of European real estate companies increased by 6.4%. Deutsche EuroShop’s market capitalisation stood at € 1.73 billion at the end of the third quarter. Deutsche EuroShop vs. MDAX and EPRA Awards for our reports Deutsche EuroShop’s Annual Report 2012, prepared under the motto “Hamburg3”, won additional awards including bronze in the European Public Real Estate Association’s “EPRA 2013 Annual Report Survey” as well as one honorary and one silver award from the “2013 International ARC Awards” competition for the world’s best annual reports. If you are interested in receiving a printed copy of our annual report, please send an e-mail to info@deutsche-euroshop.de. Coverage A total of 25 financial analysts from various institutions assess Deutsche EuroShop’s business performance. They publish reports with investment recommendations concerning the Company on a regular basis. The majority of analysts' opinions is currently neutral (16), with seven adopting a positive position and two issuing negative opinions (as at 4 November 2013). A list of analysts and current reports can be found on our website at www.deutsche-euroshop.de/ir Comparison, January to October 2013 (indexed, base of 100, in %) Jan Feb Mar Apr May Jun Jul Aug Sep Oct Nov 135 135 Analysts Number 130 20 20 125 125 1515 120 115 115 10 10 110 105105 55 100 95 95 00 Deutsche EuroShop MDAX Sell EPRA 135 Investors Day and conferences 125 On 22 and 23 August we organised our biannual “Deutsche EuroShop Real Estate Summer” event for analysts and institutional investors – this time in Klagenfurt. The programme included not only a tour of 115 City-Arkaden and the competitive environment but also various specialist presentations on topics such as the “Measurement of shopping center properties” or the “Future of retailing”. 105 We also held various individual and group meetings at conferences in Munich and New York. 95 20 15 10 5 0 DES Nine-month report 2013 Below average Hold Above average Buy
- 5. Nine-month report 2013 Key share data {5} Sector / industry group Financial services / Real estate Share capital on 30 September 2013 €53,945,536.00 Economic conditions Number of shares on 30 September 2013 (no-par value registered shares) 53,945,536 Dividend 2012 (21 June 2013) €1.20 Share price on 28 December 2011 €31.64 Share price on 30 September 2013 €32.03 Low / high in the period under review €29.45 / €34.48 Market capitalisation on 30 September 2013 €1.73 billion Prime Standard OTC trading Indices Frankfurt und Xetra Berlin-Bremen, Dusseldorf, Hamburg, Hanover, Munich and Stuttgart MDAX, EPRA, GPR 250, EPIX 30, MSCI Small Cap, EURO STOXX, STOXX Europe 600, HASPAX, F.A.Z.-Index ISIN Ticker symbol Report on Opportunities and Outlook The federal government, the European Commission, the OECD, the IMF, the Experts’ Council, the German Bundesbank and all major financial institutions expect Germany’s gross domestic product (GDP) to rise by 0.5% in 2013. Positive stimuli are expected to come from private consumer spending, in particular, which will probably continue its positive development in light of the consistently good situation on the job market. Experts anticipate that the number of unemployed could rise slightly by 50,000 to 2,949 million, which would correspond to an unemployment rate of 6.9% (2012: 6.8%). According to the opinion of the German Council of Economic Experts, the inflation rate is likely to settle at 1.7% this year after averaging 2.0% in 2012. DE 000748 020 4 DEQ, Reuters: DEQGn.DE Report on Events after the Balance Sheet Date No further significant events occurred between the balance sheet date of 30 September 2013 and the date of preparation of the financial statements. Risk Report There have been no significant changes since the beginning of the financial year with regard to the risks associated with future business development. We do not believe the Company faces any risks capable of jeopardising its continued existence. The information provided in the risk report of the consolidated financial statements as at 31 December 2012 is therefore still applicable. In light of this, we expect Deutsche EuroShop’s business to once again perform positively and according to plan this year. Expected Results of Operations and Financial Position Forecast to be increased In light of sales and positive earnings before interest and taxes, we stand by the forecasts we made in May for financial year 2013. As a result of income earned through the disposal of our Polish shareholding, however, we are raising our expectations in terms of earnings before taxes and measurement gains / losses considerably. We are also slightly increasing our forecast for funds from operations which does not include proceeds from sales. In this respect, we anticipate: ¤¤ evenue of between € 186 million and € 189 million and r ¤¤ arnings before interest and taxes (EBIT) of between e € 162 million and € 165 million ¤¤ arnings before taxes (EBT) without measurement e gains / losses of between € 130 million and € 132 million (previously: € 113 – € 116 million) and ¤¤ unds from operations (FFO) per share of between € 2.06 f and € 2.09 (previously: between € 1.99 and € 2.03). Dividend policy We intend to maintain our long-term dividend policy and once again to distribute a dividend of at least € 1.20 per share to our shareholders for financial year 2013. DES Nine-month report 2013
- 6. Nine-month report 2013 {6} s h ee t o lida ted ba la nce Cons Assets in € thousands 30.09.2013 readjusted 31.12.2012 readjusted 01.01.2012 readjusted ASSETS Non-current assets Intangible assets Property, plant and equipment Investment properties Non-current financial assets Investments accounted for using the equity method Other non-current assets 11 16 20 432 112 137 2,882,840 2,490,763 2,596,131 34,465 30,293 27,815 336,681 470,483 326,699 205 312 459 3,254,634 2,991,979 2,951,261 Trade receivables 2,573 3,199 4,912 Other current assets 4,685 5,946 14,207 Non-current assets Current assets Cash and cash equivalents 51,669 158,194 57,613 Current assets 58,927 167,339 76,732 3,313,561 3,159,318 3,027,993 30.09.2013 readjusted 31.12.2012 readjusted 01.01.2012 readjusted 53,945 53,945 51,631 Total assets Equity and liabilities in € thousands EQUITY AND LIABILITIES Equity and reserves Issued capital Capital reserves 961,970 961,987 890,482 Retained earnings 311,407 305,982 250,928 1,327,322 1,321,914 1,193,041 Total equity Non-current liabilities Financial liabilities 1,395,015 1,167,864 1,185,613 Deferred tax liabilities 197,039 180,525 210,587 Right to redeem of limited partners 207,295 206,510 280,078 43,576 42,684 32,288 1,842,925 1,597,583 1,708,566 Other liabilities Non-current liabilities Current liabilities Financial liabilities 113,999 189,865 97,962 Trade payables 2,013 2,048 2,389 Tax liabilities 8,188 24,569 5,913 Other provisions 8,447 12,372 8,281 Other liabilities 10,667 10,967 11,841 Current liabilities Total equity and liabilities DES Nine-month report 2013 143,314 239,821 126,386 3,313,561 3,159,318 3,027,993
- 7. Nine-month report 2013 {7} m en t ed income sta te Conso lida t 01.07. – 30.09.2013 readjusted 01.07. – 30.09.2012 readjusted 01.01. – 30.09.2013 readjusted 01.01. – 30.09.2012 readjusted Revenue 49,348 39,209 138,192 116,973 Property operating costs -2,406 -2,008 -6,448 -6,646 in € thousands Property management costs -2,580 -1,898 -7,200 -5,827 Net operating income (NOI) 44,362 35,303 124,544 104,500 Other operating income 50 240 611 932 Other operating expenses -1,113 -1,533 -4,654 -4,446 Earnings before interest and taxes (EBIT) 43,299 34,010 120,501 100,986 Interest income Interest expense Profit / loss attributable to limited partners Income from the disposal of financial assets Income from investments Share of the profit or loss of associates and joint ventures accounted for using the equity method Net finance costs Measurement gains / losses 63 54 296 317 -15,236 -13,182 -42,650 -38,950 -4,052 -3,434 -11,870 -10,749 26 0 26 0 16,635 0 16,635 0 5,094 7,473 17,522 22,134 2,530 -9,089 -20,041 -27,248 -4,322 -1,097 -6,784 -2,741 41,507 23,824 93,676 70,997 of which excess of identified net assets acquired over cost of acquisition in accordance with IFRS 3: € 603 thousand (previous year: -€ 308 thousand) Earnings before tax (EBT) Income tax expense -6,072 -6,464 -16,465 -21,059 Consolidated profit 35,435 17,360 77,211 49,938 Earnings per share (€), basic 0.66 0.33 1.43 0.96 Earnings per share (€), diluted 0.63 0.33 1.38 0.96 Consolidated statement of comprehensive income in € thousands Consolidated profit Changes in cash flow hedge Deferred taxes on changes in value offset directly against equity Change due to IAS 39 measurement of investments 01.07. – 30.09.2013 01.07. – 30.09.2012 01.01. – 30.09.2013 01.01. – 30.09.2012 35,435 17,360 77,211 49,938 682 -4,655 6,799 -11,415 -145 1,505 -1,573 3,343 3,553 0 3,553 0 Disposal due to IAS 39 measurement of investments -15,746 0 -15,746 0 Total earnings recognised directly in equity -11,656 -3,150 -6,967 -8,072 Total profit 23,779 14,210 70,244 41,866 23,779 14,210 70,244 41,866 Share of Group shareholders DES Nine-month report 2013
- 8. Nine-month report 2013 {8} t em en t d cash flow sta Conso lida te in € thousands 01.01. – 30.09.2013 01.01. – 30.09.2012 Profit after tax 77,211 49,938 -603 308 Expenses / income from the application of IFRS 3 Income from the disposal of shareholdings -15,745 0 Profit / loss attributable to limited partners 11,505 10,665 Depreciation of property, plant and equipment Other non-cash income and expenses Profit / loss for the period of equity-accounted companies 39 29 1,029 -151 -600 -1,799 Deferred taxes 14,618 17,031 Operating cash flow 87,454 76,021 3,259 1,495 -21,184 978 Changes in receivables Changes in current provisions Changes in liabilities -1,705 -401 Cash flow from operating activities 67,824 78,093 -71,980 -6,500 -620 1,152 Payments to acquire property, plant and equipment / investment properties Inflows / outflows to / from the financial assets Cash flow from investing activities -72,600 -5,348 Outflow from the repayment of financial liabilities -36,851 12,924 Payments to limited partners -9,506 -8,615 -64,735 -56,795 Cash flow from financing activities -111,092 -52,486 Net change in cash and cash equivalents -115,868 20,259 158,194 54,487 9,343 0 51,669 74,746 Payments to Group shareholders Cash and cash equivalents at beginning of period Changes in the financial resources fund due to consolidation changes Cash and cash equivalents at end of period DES Nine-month report 2013
- 9. Nine-month report 2013 {9} u it y o f c ha n ges in eq St a t e m e n t in € thousands 01.01.2012 Number of shares outstanding 51,631,400 Share capital Capital reserves Other retained earnings Statutory reserve Total 51,631 890,482 248,928 2,000 1,193,041 Total earnings recognised directly in equity -8,072 -8,072 Consolidated profit 49,938 49,938 Total profit 41,866 41,866 -56,795 -56,795 Dividend payments 30.09.2012 51,631,400 51,631 890,482 233,999 2,000 1,178,112 01.01.2013 53,945,536 53,945 961,987 303,982 2,000 1,321,914 0 -6,967 Total earnings recognised directly in equity Consolidated profit 77,211 Total profit 0 0 Dividend payments DES Nine-month report 2013 70,244 77,211 0 70,244 -64,735 53,945,536 53,945 -64,735 -17 Other changes 30.09.2013 -6,967 -84 -101 961,970 309,407 2,000 1,327,322
- 10. Nine-month report 2013 Disclosures consolidated balance sheet – Switch to equity accounting { 10 } Reporting principles Assets in € thousands These interim financial statements of the Deutsche EuroShop Group as at 30 September 2013 have been prepared in accordance with International Financial Reporting Standards (IFRS). The accounting policies applied correspond to those used in the last consolidated financial statements as at the end of the financial year. A detailed description of the methods applied was published in the notes to the consolidated financial statements for 2012. Changes made to the accounting policies after 1 January 2013 are explained in the following. Changes in Accounting Policies Switch to the equity method as of 1 January 2013 Joint ventures in which Deutsche EuroShop AG has a majority of the voting rights together with third parties were previously proportionately included as joint ventures in the consolidated financial statements in accordance with the option granted by IAS 31. Proportional consolidation is now discontinued given the adoption of the new IFRS 11. In future, joint ventures will always be accounted for using the equity method. Adoption of this standard is compulsory as of 1 January 2014. In our 2011 annual report, we had already announced the early adoption of IFRS 11 as of 2013. The transition from proportional to equity accounting has an impact on the structure of our consolidated financial statements. Under the equity method, assets, liabilities, expenses and income are no longer recognised proportionally in the corresponding balance sheet or income statement items. The balance sheet only shows equity interest as a carrying amount and the profit share is recorded as investment income in the income statement (financial result). This affects the following companies: ¤¤ ltmarkt-Galerie Dresden KG, Hamburg A (until 30 April 2013) ¤¤ KZ Eins Errichtungs- und Betriebs Ges.m.b.H. Co OG, E Vienna ¤¤ Einkaufs-Center Arkaden Pécs KG, Hamburg DES Nine-month report 2013 01.01.2012 readjusted Non-current assets Property, plant and equipment Investment properties Non-current financial assets Investments accounted for using the equity method Other non-current assets Non-current assets 20 0 20 137 0 137 3,106,832 -844,221 2,262,611 27,815 0 27,815 4,514 470,834 475,348 459 0 459 3,139,777 -373,387 2,766,390 5,606 -1,248 4,358 15,334 -1,513 13,821 Current assets Trade receivables Other current assets Cash and cash equivalents 64,408 -9,921 54,487 Current assets 85,348 -12,682 72,666 3,225,125 -386,069 2,839,056 01.01.2012 preadjusted 01.01.2012 Adjustment 01.01.2012 readjusted 51,631 0 51,631 890,482 0 890,482 Total assets EQUITY AND LIABILITIES in € thousands EQUITY AND LIABILITIES Equity and reserves Issued capital Capital reserves Retained earnings Total equity 250,928 0 250,928 1,193,041 0 1,193,041 Non-current liabilities Financial liabilities 1,335,986 -259,712 1,076,274 Deferred tax liabilities 210,587 0 210,587 Right to redeem of limited partners 280,078 -77,285 202,793 38,451 -6,163 32,288 1,865,102 -343,160 1,521,942 Other liabilities Non-current liabilities Current liabilities Financial liabilities 136,163 -39,598 96,565 Trade payables 2,835 -472 2,363 Tax liabilities 5,935 -22 5,913 Other provisions 8,859 -690 8,169 Other liabilities 13,190 -2,127 11,063 166,982 -42,909 124,073 3,225,125 -386,069 2,839,056 Current liabilities ¤¤ Allee-Center Magdeburg KG, Hamburg ¤¤ CAK City Arkaden Klagenfurt KG, Hamburg 01.01.2012 Adjustment ASSETS Intangible assets The management report and the abridged financial statements were not audited in accordance with section 317 of the Handelsgesetzbuch (HGB – German Commercial Code), nor were they reviewed by a person qualified to carry out audits. In the opinion of the Executive Board, the report contains all of the necessary adjustments required to give a true and fair view of the results of operations as at the date of the interim report. The performance for the first nine months up to 30 September 2013 is not necessarily an indication of future performance. 01.01.2012 preadjusted Total equity and liabilities
- 11. Nine-month report 2013 Assets in € thousands 31.12.2012 preadjusted 31.12.2012 Adjustment 31.12.2012 readjusted Consolidated income statement – Switch to equity accounting 01.01. – 30.09.2012 preadjusted 01.01. – 30.09.2012 readjusted 157,114 116,973 Property operating costs -8,037 -6,646 Property management costs -8,004 -5,827 141,073 104,500 1,036 932 -4,775 -4,446 137,334 100,986 1 0 Assets Non-current assets Intangible assets Property, plant and equipment Investment properties Non-current financial assets Investments accounted for using the equity method Other non-current assets Non-current assets 16 0 16 112 0 112 3,330,289 -839,526 2,490,763 30,293 0 30,293 4,109 466,374 470,483 316 -4 312 3,365,135 -373,156 2,991,979 in € thousands Revenue Net operating income (NOI) Other operating income Other operating expenses Earnings before interest and taxes (EBIT) Current assets Trade receivables 4,738 -1,539 3,199 Income from investments Other current assets 7,115 -1,169 5,946 Interest income Other financial investments 4,355 -4,355 0 Cash and cash equivalents 167,511 -9,317 158,194 Current assets 183,719 -16,380 167,339 3,548,854 -389,536 3,159,318 Total assets 360 317 Interest expense -49,731 -38,950 Profit / loss attributable to limited partners -14,078 -10,749 0 22,134 -63,448 -27,248 -2,836 -2,741 Share of the profit or loss of associates and joint ventures accounted for using the equity method Net finance costs Equity and liabilities in € thousands 31.12.2012 preadjusted 31.12.2012 Adjustment 31.12.2012 readjusted Equity and reserves Capital reserves Retained earnings Total equity 53,945 0 53,945 961,987 0 961,987 305,982 0 0 1,321,914 Non-current liabilities Financial liabilities 1,463,097 -295,233 1,167,864 Deferred tax liabilities 180,525 0 180,525 Right to redeem of limited partners 284,176 -77,666 206,510 51,242 -8,558 42,684 1,979,040 -381,457 1,597,583 194,137 -4,272 189,865 2,331 -283 2,048 Tax liabilities 24,572 -3 24,569 Other provisions 12,749 -377 12,372 Other liabilities 14,111 -3,144 10,967 247,900 -8,079 239,821 3,548,854 -389,536 3,159,318 Other liabilities Non-current liabilities Current liabilities Financial liabilities Trade payables Current liabilities Earnings before tax (EBT) 70,997 -21,112 -21,059 49,938 49,938 Earnings per share (€), basic 0.96 0.96 Earnings per share (€), diluted 0.96 0.96 305,982 1,321,914 71,050 Income tax expense Consolidated profit EQUITY AND LIABILITIES Issued capital Measurement gains / losses In addition, a voting agreement was in place with a co-shareholder of Immobilien Kommanditgesellschaft FEZ Harburg and Stadt-Galerie Passau KG until 31 December 2012 which granted Deutsche EuroShop AG controlling interest of these companies. These voting agreements were terminated by mutual agreement as per 31 December 2012. As a result, Deutsche EuroShop AG no longer has the necessary majority voting interest. The two companies, in which Deutsche EuroShop AG holds a 50% and 75% stake, respectively, were previously fully consolidated. They also switched over to the equity method as of 1 January 2013, with the result that the following asset and liability items from the consolidated balance sheet as of 31 December 2012 are no longer shown: in € million Investment properties 1,114 Cash and cash equivalents 2,812 Provisions Total equity and liabilities Financial liabilities Other liabilities Minority interests DES Nine-month report 2013 333,370 Receivables and other assets 124 109,872 581 77,666
- 12. Nine-month report 2013 { 12 } Withdrawal of Deutsche EuroShop AG from DB 12 Immobilienfonds As of 31 December 2012, Deutsche EuroShop AG withdrew as limited partner from DB Immobilienfonds 12 Main-Taunus-Zentrum KG (DB 12 KG). As compensation, Deutsche EuroShop AG received its limited partnership interest in the Main-Taunus-Zentrum KG, which had previously been held directly via DB 12 KG, plus a proportionate share of cash and cash equivalents in the amount of € 1.4 million. DB 12 KG had previously been fully consolidated. The company was deconsolidated on 1 January 2013, with the result that the following asset and liability items from the consolidated balance sheet as of 31 December 2012 are no longer shown: Shareholding in Altmarkt-Galerie Dresden KG increased to 100% With effect from 30 April 2013, Deutsche EuroShop AG acquired 33% of the Altmarkt-Galerie Dresden KG, thus taking its shareholding to 100%. The purchase price was € 70.2 million. The property company is fully consolidated from 1 May 2013. Initial consolidation resulted in an excess of identified net assets acquired over the cost of acquisition of € 603,000 which was recognised under measurement gains / losses. Carrying amount Fair value Purchase price -2,973 Provisions and liabilities 155 Deconsolidation amount -2,818 70,216 70,216 Fair value net assets prior to effective control in € thousands Cash and cash equivalents in € thousands 109,745 109,745 Full amount of consideration 179,961 179,961 390,785 390,785 10,778 10,778 Net assets acquired: Property assets Cash and cash equivalents This event did not have an impact on earnings. It increases the Company’s direct shareholding in Main-Taunus-Zentrum KG from 5.74% to 52.01%. Receivables and other assets 1,342 1,342 Loan liabilities 187,107 187,107 Deferred taxes 21,428 21,428 Provisions Excess of identified net assets acquired over cost of acquisition DES Nine-month report 2013 885 885 12,921 12,921 180,564 Other liabilities 180,564 -603 -603
- 13. Nine-month report 2013 SEGMENT REPORTING { 13 } in € thousands As a holding company, Deutsche EuroShop AG holds equity interests in shopping centers in the European Union. The investees are pure realestate shelf companies without staff of their own. Operational management is contracted out to external service providers under agency agreements, meaning that the companies’ activities are exclusively restricted to asset management. The companies are operated individually. In view of the geographical segmentation, no further information pursuant to IFRS 8.33 is given. Breakdown by geographical segment in € thousands Revenue (previous year’s figures) in € thousands Domestic InternaRecontional ciliation 127,365 10,827 0 138,192 (106,384) (10,589) (0) (116,973) Domes- InternaRecontic tional ciliation Total 115,264 9,311 -4,074 120,501 (95,592) (9,611) -(4,217) (100,986) Domes- InternaRecontic tional ciliation Total (previous year’s figures) in € thousands Earnings before tax (EBT) (previous year’s figures) DES Nine-month report 2013 -36,657 -2,942 -2,755 -42,354 -(34,751) -(2,954) -(928) -(38,633) Domes- InternaRecontic tional ciliation 3,093,511 220,050 3,313,561 (2,940,536) (218,782) (3,159,318) 2,668,168 214,672 2,882,840 (2,276,740) (214,023) (2,490,763) (previous year’s figures) of which investment properties (previous year’s figures) Other disclosures Dividend In the reporting period a dividend of € 1.20 per share was distributed for financial year 2012 on 21 June 2013. Responsibility statement by the Executive Board To the best of our knowledge, and in accordance with the applicable reporting principles for interim financial reporting, the interim consolidated financial statements give a true and fair view of the assets, liabilities, financial position and profit or loss of the Group, and the interim management report of the Group includes a fair review of the development and performance of the business and the position of the Group, together with a description of the principal opportunities and risks associated with the expected development of the Group for the remainder of the financial year. Hamburg, November 2013 Claus-Matthias Böge (previous year’s figures) Net interest income Total Total EBIT in € thousands International Segment assets Due to the Company’s uniform business activities within a relatively homogeneous region (the European Union), and in accordance with IFRS 8.12, separate segment reporting is presented in the form of a breakdown by domestic and international results. As the Group’s main decision-making body, the Deutsche EuroShop AG Executive Board largely assesses the performance of the segments based on the EBIT of the individual property companies. The valuation principles for the segment reporting correspond to those of the Group. Intra-Group activities between the segments are eliminated in the reconciliation statement. Domestic Total 77,642 8,228 7,806 93,676 (53,617) (4,858) (12,522) (70,997) Olaf Borkers
- 14. Financial calendar 2013 2014 2013 13.11. Nine-month report 2013 19.11. DZ BANK Equity Conference, Frankfurt 21.11. Roadshow Paris, M.M. Warburg 26.11. Supervisory Board meeting, Hamburg 27. – 28.11. Bankhaus Lampe Hamburg Investment Conference, Hamburg 2014 09. – 10.01. Oddo Midcap Forum, Lyon 15.01. J.P. Morgan European Real Estate CEO Conference, London 22.01. Kepler Cheuvreux European Corporate Conference, Frankfurt 27.03. Bank of America Merrill Lynch Real Estate Conference, London 25.04. Publication of the Annual Report 2013 14.05. Interim report Q1 2014 18.06. Annual General Meeting, Hamburg 12.08. Interim report H1 2014 13.11. Nine-month report 2014 Our financial calendar is updated continuously. Please check our website for the latest events: www.deutsche–euroshop.com /ir Investor Relations Contact Patrick Kiss and Nicolas Lissner Tel.: +49 (0)40 - 41 35 79 20 / -22 Fax: +49 (0)40 - 41 35 79 29 E-Mail: ir@deutsche-euroshop.com Internet: www.deutsche-euroshop.com/ir