SlideShare una empresa de Scribd logo
1 de 5
Descargar para leer sin conexión
Theme

Revenue, VaR & volatility


This note seeks to answer two questions: in the post-‘Crunch’ world, have investment banks been
able to generate sustainable revenue from ever-diminishing Trading VaR? And, have they
increased revenue-vs-VaR despite a decline in market volatility?



The answer to both questions is ‘yes’. In fact, top-tier banks1 have vastly improved their returns
on Trading VaR in all key product areas; and have adapted to ‘flat’ markets by better monitoring
of trading patterns and by successfully internalising trades via their electronic trading units.

1. Revenue vs Trading VaR
Much-publicised shortcomings notwithstanding, Trading VaR2 remains a key broad measure of risk.
Here, we observe the highlights of the last 13 quarters, 1Q10-1Q133:


On average, Top 11 banks improved their revenues while simultaneously reducing trading VaR.
In all key products, Trading VaR is 30-45% below the base 1Q-3Q10 level. By contrast, revenues
(of both top- and bottom-quartile performers) grew in the same period; even credit trading
(which arguably has a different risk profile) bounced from the low of 4Q11-2Q12.



That said, further gains may be limited. Seasonal revenue peaks are trending down in credit and
commodities, and equities FX suffered a decline in margins in recent times. Meanwhile, the
decline in Trading VaR is slowing down/levelling off.

Revenue vs Trading VaR
Foreign Exchange

Rates

125

125

100

100

75

75

Indexed to 1Q-3Q10, 3-quarter MA

Indexed to 1Q-3Q10, 3-quarter MA

1Q12-3Q12 Avg

2Q12-4Q12 Avg

3Q12-1Q13 Avg

1Q12-3Q12 Avg

2Q12-4Q12 Avg

3Q12-1Q13 Avg

4Q11-2Q12 Avg

3Q11-1Q12 Avg

2Q11-4Q11 Avg

1Q11-3Q11 Avg

Revenue (US$)

VaR: Trading (US$)

Credit
125

4Q10-2Q11 Avg

3Q10-1Q11 Avg

1Q10-3Q10 Avg

3Q12-1Q13 Avg

2Q12-4Q12 Avg

1Q12-3Q12 Avg

4Q11-2Q12 Avg

3Q11-1Q12 Avg

2Q11-4Q11 Avg

1Q11-3Q11 Avg

4Q10-2Q11 Avg

3Q10-1Q11 Avg

2Q10-4Q10 Avg

1Q10-3Q10 Avg

Revenue (US$)

2Q10-4Q10 Avg

50

50

VaR: Trading (US$)

Commodities
150

Indexed to 1Q-3Q10, 3-quarter MA

125

100

100

75

75

Revenue (US$)

Revenue (US$)

VaR: Trading (US$)

4Q11-2Q12 Avg

3Q11-1Q12 Avg

2Q11-4Q11 Avg

1Q11-3Q11 Avg

4Q10-2Q11 Avg

3Q10-1Q11 Avg

2Q10-4Q10 Avg

Indexed to 1Q-3Q10, 3-quarter MA

1Q10-3Q10 Avg

3Q12-1Q13 Avg

2Q12-4Q12 Avg

1Q12-3Q12 Avg

4Q11-2Q12 Avg

3Q11-1Q12 Avg

2Q11-4Q11 Avg

1Q11-3Q11 Avg

4Q10-2Q11 Avg

3Q10-1Q11 Avg

2Q10-4Q10 Avg

50

1Q10-3Q10 Avg

50

VaR: Trading (US$)

Equity
125

100

75

Revenue (US$)

1

2
3

VaR: Trading (US$)

3Q12-1Q13 Avg

2Q12-4Q12 Avg

1Q12-3Q12 Avg

4Q11-2Q12 Avg

3Q11-1Q12 Avg

2Q11-4Q11 Avg

1Q11-3Q11 Avg

4Q10-2Q11 Avg

3Q10-1Q11 Avg

2Q10-4Q10 Avg

1Q10-3Q10 Avg

Indexed to 1Q-3Q10, 3-quarter MA
50

Source: Tricumen. Note: MA = moving average.

The Top 11 peer group comprises capital markets units of Bank of America Merrill Lynch, Barclays, BNPP, Citi, Credit Suisse,
Deutsche Bank, Goldman Sachs, J.P. Morgan, Morgan Stanley, Societe Generale, and UBS. We also follow HSBC, RBS,
Wells Fargo and Standard Chartered, but they are not included here due to their regional emphasis and revenue mix.
We first extended our analysis to VaR (and RWA) in Mar-11, and followed that up with Stressed VaR (SVaR).
In our view, pre-2010 period is not directly comparable to 2010-13; e.g. VaR calculation at most banks was impacted by the
residual volatility from late 2008 and much of 2009.

1/5

DK / Agentha / 30 June 2013
Theme
2. Revenue / Trading VaR vs volatility
We first (publicly) commented on the link between market volatility and capital markets revenue in
our Dec-11 ‘Revenue & VIX’ note. In it, we identified ‘volatility masters’ among our then-core group
of Top 11 banks by comparing their equities, FX and commodities revenue with main volatility indices.
In this note, we widen the scope to compare Top 11’s revenue/VaR with volatility indices; and extend
the product coverage into rates (plotted against the CBOE’s SRVX index) and credit (where we use a
mix of CDS indices instead of dedicated volatility indices). Highlights:


Banks achieved impressive returns on VaR during the period under observation. For example,
seasonal 3Q-1Q revenue/VaR peaks were, in 2012/13, far ahead of comparable periods of 201012; only credit saw a mild year-on-year decline in revenue/VaR in 3Q12-1Q13. In all products,
1Q13 was the highest 1Q of the last 3 years; equities, FX and rates did particularly well.



Revenue/VaR in most products was aligned with volatility indices until late 2011/early 2012.
Then, the two diverged: returns continued advancing, while volatility commenced its sharp and
sustained decline. To a large degree, we attribute this to two relatively new trends, most evident
among top-tier banks: their vastly improved monitoring of trading patterns within the overall
market activity; and the increased internalisation of trades via their electronic trading units.

Revenue / Trading VaR vs volatility
Foreign Exchange

Rates
175

3-quarter MA, indexed to 1Q-3Q10 Avg.

150

125

3-quarter MA, indexed to 1Q-3Q10 Avg.

125

100

100

75

75

Revenue / VaR (US$)

OVX & GVZ avg.

Revenue / VaR (US$)

Source: S&P/ISDA, Tricumen. Note: S&P/ISDA CDS average
calculated from CDS US IG Index, CDS US HY Index, Eurozone
Developed Nation Sovereign CDS Index, and International Developed
Nation Sovereign CDS Index.

3Q12-1Q13 Avg

2Q12-4Q12 Avg

1Q12-3Q12 Avg

4Q11-2Q12 Avg

3Q11-1Q12 Avg

3Q12-1Q13 Avg

2Q12-4Q12 Avg

1Q12-3Q12 Avg

4Q11-2Q12 Avg

3Q11-1Q12 Avg

2Q11-4Q11 Avg

1Q11-3Q11 Avg

3Q12-1Q13 Avg

2Q12-4Q12 Avg

1Q12-3Q12 Avg

4Q11-2Q12 Avg

3Q11-1Q12 Avg

2Q11-4Q11 Avg

1Q11-3Q11 Avg

4Q10-2Q11 Avg

3Q10-1Q11 Avg

2Q10-4Q10 Avg

50

3Q10-1Q11 Avg

75

2Q10-4Q10 Avg

100

3-quarter MA, indexed to 1Q-3Q10 Avg.

1Q10-3Q10 Avg

125

1Q10-3Q10 Avg

2Q11-4Q11 Avg

Commodities
250
225
200
175
150
125
100
75
50

3-quarter MA, indexed to 1Q-3Q10 Avg.

S&P / ISDA CDS avg

Revenue / VaR (US$)

Source: CBOE, Tricumen. Note: SRVX = the CBOE Interest Rate Swap
Volatility Index.

Credit
150

1Q11-3Q11 Avg

SRVX

Source: CBOE, Tricumen. Note: EVZ = the CBOE EuroCurrency
volatility index.

175

4Q10-2Q11 Avg

3Q10-1Q11 Avg

1Q10-3Q10 Avg

3Q12-1Q13 Avg

2Q12-4Q12 Avg

1Q12-3Q12 Avg

4Q11-2Q12 Avg

50

4Q10-2Q11 Avg

EVZ

3Q11-1Q12 Avg

2Q11-4Q11 Avg

1Q11-3Q11 Avg

4Q10-2Q11 Avg

3Q10-1Q11 Avg

2Q10-4Q10 Avg

1Q10-3Q10 Avg

50

2Q10-4Q10 Avg

150

Revenue / VaR (US$)

Source: CBOE, Tricumen. Note: OVX = the CBOE Crude Oil ETF
Volatility Index (‘Oil VIX’); GVZ = the CBOE Gold ETF Volatility Index
(‘Gold VIX’).

Equity
175
150

3-quarter MA, indexed to 1Q-3Q10 Avg.

125
100
75

VIX & V2X avg.

3Q12-1Q13 Avg

2Q12-4Q12 Avg

1Q12-3Q12 Avg

4Q11-2Q12 Avg

3Q11-1Q12 Avg

2Q11-4Q11 Avg

1Q11-3Q11 Avg

4Q10-2Q11 Avg

3Q10-1Q11 Avg

2Q10-4Q10 Avg

1Q10-3Q10 Avg

50

Revenue / VaR (US$)

Source: CBOE, Tricumen. Note: VIX = CBOE Volatility index; V2X =
Dow Jones EURO STOXX 50 volatility index.

Source: Tricumen. Notes: (1) CBOE = Chicago Board Options
Exchange; (2) Tricumen product definitions. (3) Revenue excludes
CVA, DVA, one-offs and dedicated prop; (4) Trading VaR normalised
to 1-day holding period, 99% confidence level, and 3-year historical
data. It excludes revenue from dedicated proprietary operations and
some physical holdings, as both would distort peer group-wide
comparisons. Further detail on our approach and methodology for
VaR and SVaR is available on request.

2/5

DK / Agentha / 30 June 2013
Theme

Appendix 1/2: Operating Revenue / Trading VaR (Global)
Capital Markets: Secondary
Rank
3m12

3m13

JPM

#1
#5

DBK

Rank

3m13 / 3m12
(Movement)

#1

SG

FICC FX
3m12

3m13

JPM

#1

#1

#2

BARC

#6

#2

#2

#3

CS

#9

#3

GS

#3

#4

DBK

#2

#4

CS

#9

#5

Citi

#7

#5

Citi

#7

#6

UBS

#11

#6

UBS

#11

#7

SG

#5

3m13 / 3m12
(Movement)

#7

EQ Cash

FICC Rates
Rank
3m12

3m13

JPM

#1

#1

UBS

#11

SG

Rank

3m13 / 3m12
(Movement)

3m12

3m13

JPM

#1

#1

#2

DBK

#2

#2

#5

#3

BARC

#6

#3

CS

#9

#4

GS

#3

#4

BARC

#6

#5

SG

#5

#5

DBK

#2

#6

Citi

#7

#6

Citi

#7

#7

UBS

#11

3m13 / 3m12
(Movement)

#7

EQ Derv & Converts

FICC Credit

Rank
3m12

3m13

JPM

#1

#1

UBS

#11

SG

Rank

3m13 / 3m12
(Movement)

3m12

3m13

JPM

#1

#1

#2

DBK

#2

#2

#5

#3

GS

#3

#3

DBK

#2

#4

Citi

#7

#4

BARC

#6

#5

SG

#5

#5

CS

#9

#6

BNPP

#10

#6

Citi

#7

#7

BAML

#8

3m13 / 3m12
(Movement)

#7

FICC Commodities
Rank
3m12
#3
#1

#2

BNPP

#10

#3

SG

#5

#4

UBS

#11

#5

BAML

#8

#6

BARC

#6

3m13 / 3m12
(Movement)

#1

JPM

3/5

3m13

GS

Source: Tricumen. Notes: (1) VaR = Value at Risk; trading
portfolios only, excludes diversification effect/equivalent;
period average; normalised to 1-day holding period,
99% confidence, 3-year historical data; annualised for
inter-year periods; (2) Arrows indicate movement in ranking
relative to the entire peer group (see the ‘Notes’ section,
below); up/green arrows indicate Top 25% performance,
red/down arrows indicate Bottom 25% performance.
(3) Further Notes & Caveats are at the back of this report.
(4) This Appendix was extracted from our regular quarterly
league tables ranking of Top 7 peers by profits as well as
returns per headcount, and on VaR and RWA. Full details
are available on request.

#7

DK / Agentha / 30 June 2013
Theme

Appendix 2/2: Operating Pre-Tax Profit / Trading VaR (Global)
Capital Markets: Secondary
Rank
3m12

3m13

JPM

#1
#5

DBK

Rank

3m13 / 3m12
(Movement)

#1

SG

FICC FX
3m12

3m13

JPM

#1

#1

#2

SG

#5

#2

#2

#3

BARC

#8

#3

Citi

#3

#4

Citi

#3

#4

UBS

#10

#5

DBK

#2

#5

BARC

#8

#6

UBS

#10

#6

BAML

#7

#7

GS

#6

3m13 / 3m12
(Movement)

#7

EQ Cash

FICC Rates
Rank
3m12

3m13

UBS

#10

#1

DBK

#2

CS

Rank

3m13 / 3m12
(Movement)

3m12

3m13

JPM

#1

#1

#2

SG

#5

#2

#9

#3

BARC

#8

#3

JPM

#1

#4

Citi

#3

#4

SG

#5

#5

GS

#6

#5

MS

#4

#6

DBK

#2

#6

Citi

#3

#7

UBS

#10

3m13 / 3m12
(Movement)

#7

EQ Derv & Converts

FICC Credit

Rank
3m12

3m13

JPM

#1

#1

UBS

#10

DBK

Rank

3m13 / 3m12
(Movement)

3m12

3m13

JPM

#1

#1

#2

Citi

#3

#2

#2

#3

DBK

#2

#3

SG

#5

#4

GS

#6

#4

BARC

#8

#5

BAML

#7

#5

CS

#9

#6

CS

#9

#6

GS

#6

#7

BNPP

#11

3m13 / 3m12
(Movement)

#7

FICC Commodities
Rank
3m12
#5
#11

#2

UBS

#10

#3

JPM

#1

#4

BAML

#7

#5

DBK

#2

#6

MS

#4

3m13 / 3m12
(Movement)

#1

BNPP

4/5

3m13

SG

Source: Tricumen. Notes: (1) VaR = Value at Risk; trading
portfolios only, excludes diversification effect/equivalent;
period average; normalised to 1-day holding period,
99% confidence, 3-year historical data; annualised for
inter-year periods; (2) Arrows indicate movement in ranking
relative to the entire peer group (see the ‘Notes’ section,
below); up/green arrows indicate Top 25% performance,
red/down arrows indicate Bottom 25% performance.
(3) Further Notes & Caveats are at the back of this report.
(4) This Appendix was extracted from our regular quarterly
league tables ranking of Top 7 peers by profits as well as
returns per headcount, and on VaR and RWA. Full details
are available on request.

#7

DK / Agentha / 30 June 2013
Theme

About Tricumen
Tricumen was founded in 2008. It quickly become a strong provider of diversified market intelligence
across the capital markets and has since expanded into transaction and corporate banking coverage.
Tricumen’s data has been used by many of the world’s leading investment banks as well as strategy
consulting firms, investment managers and ‘blue chip’ corporations.
Situated near Cambridge in the UK, Tricumen is almost exclusively staffed with senior individuals with
an extensive track record of either working for or analysing banks; and boasts what we believe is the
largest capital markets-focused research network of its peer group.

Caveats
This report and the information contained herein may not be reproduced or distributed in the whole or
in part without the prior written consent of Tricumen Limited. Such consent is often given, provided
that the information released is sourced to Tricumen and that it does not prejudice Tricumen Limited’s
business or compromise the company’s ability to analyse the financial markets.
Tricumen Limited has used all reasonable care in writing, editing and presenting the information found
in this report. All reasonable effort has been made to ensure the information supplied is accurate and
not misleading. For the purposes of cross- market comparison, all numerical data is normalised in
accordance to Tricumen Limited’s proprietary product classification. Fully-researched dataset may
contain margin of error of +/-10%; for modelled datasets, this margin may be wider.
The information and commentary provided in this report has been compiled for informational purposes
only. We recommend that independent advice and enquiries should be sought before acting upon it.
Readers should not rely on this information for legal, accounting, investment, or similar purposes. No
part of this report constitutes investment advice, any form of recommendation, or a solicitation to buy
or sell any instrument or to engage in any trading or investment activity or strategy. Tricumen Limited
does not provide investment advice or personal recommendation nor will it be deemed to have done so.
Tricumen Limited makes no representation, guarantee or warranty as to the suitability, accuracy or
completeness of the report or the information therein. Tricumen Limited assumes no responsibility for
information contained in this report and disclaims all liability arising from negligence or otherwise in
respect of such information.
Tricumen Limited is not liable for any damages arising in contract, tort or otherwise from the use of or
inability to use this report or any material contained in it, or from any action or decision taken as a
result of using the report.

5/5

DK / Agentha / 30 June 2013

Más contenido relacionado

Más de Tricumen Ltd

Tricumen 3Q17 Wholesale Banking Results Review_OPEN 221117
Tricumen 3Q17 Wholesale Banking Results Review_OPEN 221117Tricumen 3Q17 Wholesale Banking Results Review_OPEN 221117
Tricumen 3Q17 Wholesale Banking Results Review_OPEN 221117
Tricumen Ltd
 
Tricumen 4Q16/FY16 Wholesale Banking results review_open 270217
Tricumen 4Q16/FY16 Wholesale Banking results review_open 270217Tricumen 4Q16/FY16 Wholesale Banking results review_open 270217
Tricumen 4Q16/FY16 Wholesale Banking results review_open 270217
Tricumen Ltd
 
Tricumen_3Q16 Wholesale Banking Results Review_OPEN 051216
Tricumen_3Q16 Wholesale Banking Results Review_OPEN 051216Tricumen_3Q16 Wholesale Banking Results Review_OPEN 051216
Tricumen_3Q16 Wholesale Banking Results Review_OPEN 051216
Tricumen Ltd
 

Más de Tricumen Ltd (20)

Tricumen 4Q17/FY17 wholesale Banking results_open 260218
Tricumen 4Q17/FY17 wholesale Banking results_open 260218Tricumen 4Q17/FY17 wholesale Banking results_open 260218
Tricumen 4Q17/FY17 wholesale Banking results_open 260218
 
Tricumen 3Q17 Wholesale Banking Results Review_OPEN 221117
Tricumen 3Q17 Wholesale Banking Results Review_OPEN 221117Tricumen 3Q17 Wholesale Banking Results Review_OPEN 221117
Tricumen 3Q17 Wholesale Banking Results Review_OPEN 221117
 
Tricumen 6m17 Capital Markes: Regions_open 300817
Tricumen 6m17 Capital Markes: Regions_open 300817Tricumen 6m17 Capital Markes: Regions_open 300817
Tricumen 6m17 Capital Markes: Regions_open 300817
 
Tricumen 1Q17 Capital Markets: Regions_310517
Tricumen 1Q17 Capital Markets: Regions_310517Tricumen 1Q17 Capital Markets: Regions_310517
Tricumen 1Q17 Capital Markets: Regions_310517
 
Tricumen FY16 Capital Markets Regions_open 100317
Tricumen FY16 Capital Markets Regions_open 100317Tricumen FY16 Capital Markets Regions_open 100317
Tricumen FY16 Capital Markets Regions_open 100317
 
Tricumen 4Q16/FY16 Wholesale Banking results review_open 270217
Tricumen 4Q16/FY16 Wholesale Banking results review_open 270217Tricumen 4Q16/FY16 Wholesale Banking results review_open 270217
Tricumen 4Q16/FY16 Wholesale Banking results review_open 270217
 
Tricumen 9m16 Capital Markets Regions_OPEN 121216
Tricumen 9m16 Capital Markets Regions_OPEN 121216Tricumen 9m16 Capital Markets Regions_OPEN 121216
Tricumen 9m16 Capital Markets Regions_OPEN 121216
 
Tricumen_3Q16 Wholesale Banking Results Review_OPEN 051216
Tricumen_3Q16 Wholesale Banking Results Review_OPEN 051216Tricumen_3Q16 Wholesale Banking Results Review_OPEN 051216
Tricumen_3Q16 Wholesale Banking Results Review_OPEN 051216
 
Tricumen 6m16 Capital Markets Results Review_Regions_OPEN 010916
Tricumen 6m16 Capital Markets Results Review_Regions_OPEN 010916Tricumen 6m16 Capital Markets Results Review_Regions_OPEN 010916
Tricumen 6m16 Capital Markets Results Review_Regions_OPEN 010916
 
Tricumen 2Q16 Capital Markes Results Review_open 290816
Tricumen 2Q16 Capital Markes Results Review_open 290816Tricumen 2Q16 Capital Markes Results Review_open 290816
Tricumen 2Q16 Capital Markes Results Review_open 290816
 
Tricumen / Capital Markets: Regions 1Q16_open 260516
Tricumen / Capital Markets: Regions 1Q16_open 260516Tricumen / Capital Markets: Regions 1Q16_open 260516
Tricumen / Capital Markets: Regions 1Q16_open 260516
 
Tricumen / 1Q16 Capital Markets Results Review_open
Tricumen / 1Q16 Capital Markets Results Review_openTricumen / 1Q16 Capital Markets Results Review_open
Tricumen / 1Q16 Capital Markets Results Review_open
 
Tricumen / Credit Suisse: Restructuring EMEA and Americas_290316
Tricumen / Credit Suisse: Restructuring EMEA and Americas_290316Tricumen / Credit Suisse: Restructuring EMEA and Americas_290316
Tricumen / Credit Suisse: Restructuring EMEA and Americas_290316
 
Tricumen / FY15 Capital Markets: Regions_open 080316
Tricumen / FY15 Capital Markets: Regions_open 080316Tricumen / FY15 Capital Markets: Regions_open 080316
Tricumen / FY15 Capital Markets: Regions_open 080316
 
Standard Chartered_credit risk management 140116
Standard Chartered_credit risk management 140116Standard Chartered_credit risk management 140116
Standard Chartered_credit risk management 140116
 
Tricumen / Barclays Investment Bank_extending the cuts_151215
Tricumen / Barclays Investment Bank_extending the cuts_151215Tricumen / Barclays Investment Bank_extending the cuts_151215
Tricumen / Barclays Investment Bank_extending the cuts_151215
 
Tricumen / M&A boutiques vs globals_101215
Tricumen / M&A boutiques vs globals_101215Tricumen / M&A boutiques vs globals_101215
Tricumen / M&A boutiques vs globals_101215
 
Tricumen / Future Models in Wholesale Banking 100915
Tricumen / Future Models in Wholesale Banking 100915Tricumen / Future Models in Wholesale Banking 100915
Tricumen / Future Models in Wholesale Banking 100915
 
Tricumen / Capital Markets Regions 6m15_open 230815
Tricumen / Capital Markets Regions 6m15_open 230815Tricumen / Capital Markets Regions 6m15_open 230815
Tricumen / Capital Markets Regions 6m15_open 230815
 
Tricumen / Capital Markets: Regions 1Q15
Tricumen / Capital Markets: Regions 1Q15Tricumen / Capital Markets: Regions 1Q15
Tricumen / Capital Markets: Regions 1Q15
 

Último

VIP Call Girl in Mira Road 💧 9920725232 ( Call Me ) Get A New Crush Everyday ...
VIP Call Girl in Mira Road 💧 9920725232 ( Call Me ) Get A New Crush Everyday ...VIP Call Girl in Mira Road 💧 9920725232 ( Call Me ) Get A New Crush Everyday ...
VIP Call Girl in Mira Road 💧 9920725232 ( Call Me ) Get A New Crush Everyday ...
dipikadinghjn ( Why You Choose Us? ) Escorts
 
( Jasmin ) Top VIP Escorts Service Dindigul 💧 7737669865 💧 by Dindigul Call G...
( Jasmin ) Top VIP Escorts Service Dindigul 💧 7737669865 💧 by Dindigul Call G...( Jasmin ) Top VIP Escorts Service Dindigul 💧 7737669865 💧 by Dindigul Call G...
( Jasmin ) Top VIP Escorts Service Dindigul 💧 7737669865 💧 by Dindigul Call G...
dipikadinghjn ( Why You Choose Us? ) Escorts
 
VIP Independent Call Girls in Bandra West 🌹 9920725232 ( Call Me ) Mumbai Esc...
VIP Independent Call Girls in Bandra West 🌹 9920725232 ( Call Me ) Mumbai Esc...VIP Independent Call Girls in Bandra West 🌹 9920725232 ( Call Me ) Mumbai Esc...
VIP Independent Call Girls in Bandra West 🌹 9920725232 ( Call Me ) Mumbai Esc...
dipikadinghjn ( Why You Choose Us? ) Escorts
 
VIP Call Girl in Mumbai 💧 9920725232 ( Call Me ) Get A New Crush Everyday Wit...
VIP Call Girl in Mumbai 💧 9920725232 ( Call Me ) Get A New Crush Everyday Wit...VIP Call Girl in Mumbai 💧 9920725232 ( Call Me ) Get A New Crush Everyday Wit...
VIP Call Girl in Mumbai 💧 9920725232 ( Call Me ) Get A New Crush Everyday Wit...
dipikadinghjn ( Why You Choose Us? ) Escorts
 
VIP Independent Call Girls in Mira Bhayandar 🌹 9920725232 ( Call Me ) Mumbai ...
VIP Independent Call Girls in Mira Bhayandar 🌹 9920725232 ( Call Me ) Mumbai ...VIP Independent Call Girls in Mira Bhayandar 🌹 9920725232 ( Call Me ) Mumbai ...
VIP Independent Call Girls in Mira Bhayandar 🌹 9920725232 ( Call Me ) Mumbai ...
dipikadinghjn ( Why You Choose Us? ) Escorts
 

Último (20)

Mira Road Memorable Call Grls Number-9833754194-Bhayandar Speciallty Call Gir...
Mira Road Memorable Call Grls Number-9833754194-Bhayandar Speciallty Call Gir...Mira Road Memorable Call Grls Number-9833754194-Bhayandar Speciallty Call Gir...
Mira Road Memorable Call Grls Number-9833754194-Bhayandar Speciallty Call Gir...
 
Call Girls Koregaon Park Call Me 7737669865 Budget Friendly No Advance Booking
Call Girls Koregaon Park Call Me 7737669865 Budget Friendly No Advance BookingCall Girls Koregaon Park Call Me 7737669865 Budget Friendly No Advance Booking
Call Girls Koregaon Park Call Me 7737669865 Budget Friendly No Advance Booking
 
(INDIRA) Call Girl Mumbai Call Now 8250077686 Mumbai Escorts 24x7
(INDIRA) Call Girl Mumbai Call Now 8250077686 Mumbai Escorts 24x7(INDIRA) Call Girl Mumbai Call Now 8250077686 Mumbai Escorts 24x7
(INDIRA) Call Girl Mumbai Call Now 8250077686 Mumbai Escorts 24x7
 
Top Rated Pune Call Girls Viman Nagar ⟟ 6297143586 ⟟ Call Me For Genuine Sex...
Top Rated  Pune Call Girls Viman Nagar ⟟ 6297143586 ⟟ Call Me For Genuine Sex...Top Rated  Pune Call Girls Viman Nagar ⟟ 6297143586 ⟟ Call Me For Genuine Sex...
Top Rated Pune Call Girls Viman Nagar ⟟ 6297143586 ⟟ Call Me For Genuine Sex...
 
Webinar on E-Invoicing for Fintech Belgium
Webinar on E-Invoicing for Fintech BelgiumWebinar on E-Invoicing for Fintech Belgium
Webinar on E-Invoicing for Fintech Belgium
 
Kharghar Blowjob Housewife Call Girls NUmber-9833754194-CBD Belapur Internati...
Kharghar Blowjob Housewife Call Girls NUmber-9833754194-CBD Belapur Internati...Kharghar Blowjob Housewife Call Girls NUmber-9833754194-CBD Belapur Internati...
Kharghar Blowjob Housewife Call Girls NUmber-9833754194-CBD Belapur Internati...
 
VIP Call Girl in Mira Road 💧 9920725232 ( Call Me ) Get A New Crush Everyday ...
VIP Call Girl in Mira Road 💧 9920725232 ( Call Me ) Get A New Crush Everyday ...VIP Call Girl in Mira Road 💧 9920725232 ( Call Me ) Get A New Crush Everyday ...
VIP Call Girl in Mira Road 💧 9920725232 ( Call Me ) Get A New Crush Everyday ...
 
( Jasmin ) Top VIP Escorts Service Dindigul 💧 7737669865 💧 by Dindigul Call G...
( Jasmin ) Top VIP Escorts Service Dindigul 💧 7737669865 💧 by Dindigul Call G...( Jasmin ) Top VIP Escorts Service Dindigul 💧 7737669865 💧 by Dindigul Call G...
( Jasmin ) Top VIP Escorts Service Dindigul 💧 7737669865 💧 by Dindigul Call G...
 
Top Rated Pune Call Girls Sinhagad Road ⟟ 6297143586 ⟟ Call Me For Genuine S...
Top Rated  Pune Call Girls Sinhagad Road ⟟ 6297143586 ⟟ Call Me For Genuine S...Top Rated  Pune Call Girls Sinhagad Road ⟟ 6297143586 ⟟ Call Me For Genuine S...
Top Rated Pune Call Girls Sinhagad Road ⟟ 6297143586 ⟟ Call Me For Genuine S...
 
W.D. Gann Theory Complete Information.pdf
W.D. Gann Theory Complete Information.pdfW.D. Gann Theory Complete Information.pdf
W.D. Gann Theory Complete Information.pdf
 
Navi Mumbai Cooperetive Housewife Call Girls-9833754194-Natural Panvel Enjoye...
Navi Mumbai Cooperetive Housewife Call Girls-9833754194-Natural Panvel Enjoye...Navi Mumbai Cooperetive Housewife Call Girls-9833754194-Natural Panvel Enjoye...
Navi Mumbai Cooperetive Housewife Call Girls-9833754194-Natural Panvel Enjoye...
 
VIP Independent Call Girls in Bandra West 🌹 9920725232 ( Call Me ) Mumbai Esc...
VIP Independent Call Girls in Bandra West 🌹 9920725232 ( Call Me ) Mumbai Esc...VIP Independent Call Girls in Bandra West 🌹 9920725232 ( Call Me ) Mumbai Esc...
VIP Independent Call Girls in Bandra West 🌹 9920725232 ( Call Me ) Mumbai Esc...
 
Booking open Available Pune Call Girls Shivane 6297143586 Call Hot Indian Gi...
Booking open Available Pune Call Girls Shivane  6297143586 Call Hot Indian Gi...Booking open Available Pune Call Girls Shivane  6297143586 Call Hot Indian Gi...
Booking open Available Pune Call Girls Shivane 6297143586 Call Hot Indian Gi...
 
8377087607, Door Step Call Girls In Kalkaji (Locanto) 24/7 Available
8377087607, Door Step Call Girls In Kalkaji (Locanto) 24/7 Available8377087607, Door Step Call Girls In Kalkaji (Locanto) 24/7 Available
8377087607, Door Step Call Girls In Kalkaji (Locanto) 24/7 Available
 
Call Girls Rajgurunagar Call Me 7737669865 Budget Friendly No Advance Booking
Call Girls Rajgurunagar Call Me 7737669865 Budget Friendly No Advance BookingCall Girls Rajgurunagar Call Me 7737669865 Budget Friendly No Advance Booking
Call Girls Rajgurunagar Call Me 7737669865 Budget Friendly No Advance Booking
 
VIP Call Girl in Mumbai 💧 9920725232 ( Call Me ) Get A New Crush Everyday Wit...
VIP Call Girl in Mumbai 💧 9920725232 ( Call Me ) Get A New Crush Everyday Wit...VIP Call Girl in Mumbai 💧 9920725232 ( Call Me ) Get A New Crush Everyday Wit...
VIP Call Girl in Mumbai 💧 9920725232 ( Call Me ) Get A New Crush Everyday Wit...
 
(Vedika) Low Rate Call Girls in Pune Call Now 8250077686 Pune Escorts 24x7
(Vedika) Low Rate Call Girls in Pune Call Now 8250077686 Pune Escorts 24x7(Vedika) Low Rate Call Girls in Pune Call Now 8250077686 Pune Escorts 24x7
(Vedika) Low Rate Call Girls in Pune Call Now 8250077686 Pune Escorts 24x7
 
Mira Road Awesome 100% Independent Call Girls NUmber-9833754194-Dahisar Inter...
Mira Road Awesome 100% Independent Call Girls NUmber-9833754194-Dahisar Inter...Mira Road Awesome 100% Independent Call Girls NUmber-9833754194-Dahisar Inter...
Mira Road Awesome 100% Independent Call Girls NUmber-9833754194-Dahisar Inter...
 
Vasai-Virar High Profile Model Call Girls📞9833754194-Nalasopara Satisfy Call ...
Vasai-Virar High Profile Model Call Girls📞9833754194-Nalasopara Satisfy Call ...Vasai-Virar High Profile Model Call Girls📞9833754194-Nalasopara Satisfy Call ...
Vasai-Virar High Profile Model Call Girls📞9833754194-Nalasopara Satisfy Call ...
 
VIP Independent Call Girls in Mira Bhayandar 🌹 9920725232 ( Call Me ) Mumbai ...
VIP Independent Call Girls in Mira Bhayandar 🌹 9920725232 ( Call Me ) Mumbai ...VIP Independent Call Girls in Mira Bhayandar 🌹 9920725232 ( Call Me ) Mumbai ...
VIP Independent Call Girls in Mira Bhayandar 🌹 9920725232 ( Call Me ) Mumbai ...
 

Tricumen / Revenue, VaR and Volatility_30-June-13
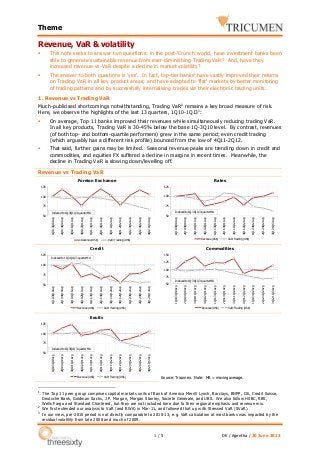
  • 1. Theme Revenue, VaR & volatility  This note seeks to answer two questions: in the post-‘Crunch’ world, have investment banks been able to generate sustainable revenue from ever-diminishing Trading VaR? And, have they increased revenue-vs-VaR despite a decline in market volatility?  The answer to both questions is ‘yes’. In fact, top-tier banks1 have vastly improved their returns on Trading VaR in all key product areas; and have adapted to ‘flat’ markets by better monitoring of trading patterns and by successfully internalising trades via their electronic trading units. 1. Revenue vs Trading VaR Much-publicised shortcomings notwithstanding, Trading VaR2 remains a key broad measure of risk. Here, we observe the highlights of the last 13 quarters, 1Q10-1Q133:  On average, Top 11 banks improved their revenues while simultaneously reducing trading VaR. In all key products, Trading VaR is 30-45% below the base 1Q-3Q10 level. By contrast, revenues (of both top- and bottom-quartile performers) grew in the same period; even credit trading (which arguably has a different risk profile) bounced from the low of 4Q11-2Q12.  That said, further gains may be limited. Seasonal revenue peaks are trending down in credit and commodities, and equities FX suffered a decline in margins in recent times. Meanwhile, the decline in Trading VaR is slowing down/levelling off. Revenue vs Trading VaR Foreign Exchange Rates 125 125 100 100 75 75 Indexed to 1Q-3Q10, 3-quarter MA Indexed to 1Q-3Q10, 3-quarter MA 1Q12-3Q12 Avg 2Q12-4Q12 Avg 3Q12-1Q13 Avg 1Q12-3Q12 Avg 2Q12-4Q12 Avg 3Q12-1Q13 Avg 4Q11-2Q12 Avg 3Q11-1Q12 Avg 2Q11-4Q11 Avg 1Q11-3Q11 Avg Revenue (US$) VaR: Trading (US$) Credit 125 4Q10-2Q11 Avg 3Q10-1Q11 Avg 1Q10-3Q10 Avg 3Q12-1Q13 Avg 2Q12-4Q12 Avg 1Q12-3Q12 Avg 4Q11-2Q12 Avg 3Q11-1Q12 Avg 2Q11-4Q11 Avg 1Q11-3Q11 Avg 4Q10-2Q11 Avg 3Q10-1Q11 Avg 2Q10-4Q10 Avg 1Q10-3Q10 Avg Revenue (US$) 2Q10-4Q10 Avg 50 50 VaR: Trading (US$) Commodities 150 Indexed to 1Q-3Q10, 3-quarter MA 125 100 100 75 75 Revenue (US$) Revenue (US$) VaR: Trading (US$) 4Q11-2Q12 Avg 3Q11-1Q12 Avg 2Q11-4Q11 Avg 1Q11-3Q11 Avg 4Q10-2Q11 Avg 3Q10-1Q11 Avg 2Q10-4Q10 Avg Indexed to 1Q-3Q10, 3-quarter MA 1Q10-3Q10 Avg 3Q12-1Q13 Avg 2Q12-4Q12 Avg 1Q12-3Q12 Avg 4Q11-2Q12 Avg 3Q11-1Q12 Avg 2Q11-4Q11 Avg 1Q11-3Q11 Avg 4Q10-2Q11 Avg 3Q10-1Q11 Avg 2Q10-4Q10 Avg 50 1Q10-3Q10 Avg 50 VaR: Trading (US$) Equity 125 100 75 Revenue (US$) 1 2 3 VaR: Trading (US$) 3Q12-1Q13 Avg 2Q12-4Q12 Avg 1Q12-3Q12 Avg 4Q11-2Q12 Avg 3Q11-1Q12 Avg 2Q11-4Q11 Avg 1Q11-3Q11 Avg 4Q10-2Q11 Avg 3Q10-1Q11 Avg 2Q10-4Q10 Avg 1Q10-3Q10 Avg Indexed to 1Q-3Q10, 3-quarter MA 50 Source: Tricumen. Note: MA = moving average. The Top 11 peer group comprises capital markets units of Bank of America Merrill Lynch, Barclays, BNPP, Citi, Credit Suisse, Deutsche Bank, Goldman Sachs, J.P. Morgan, Morgan Stanley, Societe Generale, and UBS. We also follow HSBC, RBS, Wells Fargo and Standard Chartered, but they are not included here due to their regional emphasis and revenue mix. We first extended our analysis to VaR (and RWA) in Mar-11, and followed that up with Stressed VaR (SVaR). In our view, pre-2010 period is not directly comparable to 2010-13; e.g. VaR calculation at most banks was impacted by the residual volatility from late 2008 and much of 2009. 1/5 DK / Agentha / 30 June 2013
  • 2. Theme 2. Revenue / Trading VaR vs volatility We first (publicly) commented on the link between market volatility and capital markets revenue in our Dec-11 ‘Revenue & VIX’ note. In it, we identified ‘volatility masters’ among our then-core group of Top 11 banks by comparing their equities, FX and commodities revenue with main volatility indices. In this note, we widen the scope to compare Top 11’s revenue/VaR with volatility indices; and extend the product coverage into rates (plotted against the CBOE’s SRVX index) and credit (where we use a mix of CDS indices instead of dedicated volatility indices). Highlights:  Banks achieved impressive returns on VaR during the period under observation. For example, seasonal 3Q-1Q revenue/VaR peaks were, in 2012/13, far ahead of comparable periods of 201012; only credit saw a mild year-on-year decline in revenue/VaR in 3Q12-1Q13. In all products, 1Q13 was the highest 1Q of the last 3 years; equities, FX and rates did particularly well.  Revenue/VaR in most products was aligned with volatility indices until late 2011/early 2012. Then, the two diverged: returns continued advancing, while volatility commenced its sharp and sustained decline. To a large degree, we attribute this to two relatively new trends, most evident among top-tier banks: their vastly improved monitoring of trading patterns within the overall market activity; and the increased internalisation of trades via their electronic trading units. Revenue / Trading VaR vs volatility Foreign Exchange Rates 175 3-quarter MA, indexed to 1Q-3Q10 Avg. 150 125 3-quarter MA, indexed to 1Q-3Q10 Avg. 125 100 100 75 75 Revenue / VaR (US$) OVX & GVZ avg. Revenue / VaR (US$) Source: S&P/ISDA, Tricumen. Note: S&P/ISDA CDS average calculated from CDS US IG Index, CDS US HY Index, Eurozone Developed Nation Sovereign CDS Index, and International Developed Nation Sovereign CDS Index. 3Q12-1Q13 Avg 2Q12-4Q12 Avg 1Q12-3Q12 Avg 4Q11-2Q12 Avg 3Q11-1Q12 Avg 3Q12-1Q13 Avg 2Q12-4Q12 Avg 1Q12-3Q12 Avg 4Q11-2Q12 Avg 3Q11-1Q12 Avg 2Q11-4Q11 Avg 1Q11-3Q11 Avg 3Q12-1Q13 Avg 2Q12-4Q12 Avg 1Q12-3Q12 Avg 4Q11-2Q12 Avg 3Q11-1Q12 Avg 2Q11-4Q11 Avg 1Q11-3Q11 Avg 4Q10-2Q11 Avg 3Q10-1Q11 Avg 2Q10-4Q10 Avg 50 3Q10-1Q11 Avg 75 2Q10-4Q10 Avg 100 3-quarter MA, indexed to 1Q-3Q10 Avg. 1Q10-3Q10 Avg 125 1Q10-3Q10 Avg 2Q11-4Q11 Avg Commodities 250 225 200 175 150 125 100 75 50 3-quarter MA, indexed to 1Q-3Q10 Avg. S&P / ISDA CDS avg Revenue / VaR (US$) Source: CBOE, Tricumen. Note: SRVX = the CBOE Interest Rate Swap Volatility Index. Credit 150 1Q11-3Q11 Avg SRVX Source: CBOE, Tricumen. Note: EVZ = the CBOE EuroCurrency volatility index. 175 4Q10-2Q11 Avg 3Q10-1Q11 Avg 1Q10-3Q10 Avg 3Q12-1Q13 Avg 2Q12-4Q12 Avg 1Q12-3Q12 Avg 4Q11-2Q12 Avg 50 4Q10-2Q11 Avg EVZ 3Q11-1Q12 Avg 2Q11-4Q11 Avg 1Q11-3Q11 Avg 4Q10-2Q11 Avg 3Q10-1Q11 Avg 2Q10-4Q10 Avg 1Q10-3Q10 Avg 50 2Q10-4Q10 Avg 150 Revenue / VaR (US$) Source: CBOE, Tricumen. Note: OVX = the CBOE Crude Oil ETF Volatility Index (‘Oil VIX’); GVZ = the CBOE Gold ETF Volatility Index (‘Gold VIX’). Equity 175 150 3-quarter MA, indexed to 1Q-3Q10 Avg. 125 100 75 VIX & V2X avg. 3Q12-1Q13 Avg 2Q12-4Q12 Avg 1Q12-3Q12 Avg 4Q11-2Q12 Avg 3Q11-1Q12 Avg 2Q11-4Q11 Avg 1Q11-3Q11 Avg 4Q10-2Q11 Avg 3Q10-1Q11 Avg 2Q10-4Q10 Avg 1Q10-3Q10 Avg 50 Revenue / VaR (US$) Source: CBOE, Tricumen. Note: VIX = CBOE Volatility index; V2X = Dow Jones EURO STOXX 50 volatility index. Source: Tricumen. Notes: (1) CBOE = Chicago Board Options Exchange; (2) Tricumen product definitions. (3) Revenue excludes CVA, DVA, one-offs and dedicated prop; (4) Trading VaR normalised to 1-day holding period, 99% confidence level, and 3-year historical data. It excludes revenue from dedicated proprietary operations and some physical holdings, as both would distort peer group-wide comparisons. Further detail on our approach and methodology for VaR and SVaR is available on request. 2/5 DK / Agentha / 30 June 2013
  • 3. Theme Appendix 1/2: Operating Revenue / Trading VaR (Global) Capital Markets: Secondary Rank 3m12 3m13 JPM #1 #5 DBK Rank 3m13 / 3m12 (Movement) #1 SG FICC FX 3m12 3m13 JPM #1 #1 #2 BARC #6 #2 #2 #3 CS #9 #3 GS #3 #4 DBK #2 #4 CS #9 #5 Citi #7 #5 Citi #7 #6 UBS #11 #6 UBS #11 #7 SG #5 3m13 / 3m12 (Movement) #7 EQ Cash FICC Rates Rank 3m12 3m13 JPM #1 #1 UBS #11 SG Rank 3m13 / 3m12 (Movement) 3m12 3m13 JPM #1 #1 #2 DBK #2 #2 #5 #3 BARC #6 #3 CS #9 #4 GS #3 #4 BARC #6 #5 SG #5 #5 DBK #2 #6 Citi #7 #6 Citi #7 #7 UBS #11 3m13 / 3m12 (Movement) #7 EQ Derv & Converts FICC Credit Rank 3m12 3m13 JPM #1 #1 UBS #11 SG Rank 3m13 / 3m12 (Movement) 3m12 3m13 JPM #1 #1 #2 DBK #2 #2 #5 #3 GS #3 #3 DBK #2 #4 Citi #7 #4 BARC #6 #5 SG #5 #5 CS #9 #6 BNPP #10 #6 Citi #7 #7 BAML #8 3m13 / 3m12 (Movement) #7 FICC Commodities Rank 3m12 #3 #1 #2 BNPP #10 #3 SG #5 #4 UBS #11 #5 BAML #8 #6 BARC #6 3m13 / 3m12 (Movement) #1 JPM 3/5 3m13 GS Source: Tricumen. Notes: (1) VaR = Value at Risk; trading portfolios only, excludes diversification effect/equivalent; period average; normalised to 1-day holding period, 99% confidence, 3-year historical data; annualised for inter-year periods; (2) Arrows indicate movement in ranking relative to the entire peer group (see the ‘Notes’ section, below); up/green arrows indicate Top 25% performance, red/down arrows indicate Bottom 25% performance. (3) Further Notes & Caveats are at the back of this report. (4) This Appendix was extracted from our regular quarterly league tables ranking of Top 7 peers by profits as well as returns per headcount, and on VaR and RWA. Full details are available on request. #7 DK / Agentha / 30 June 2013
  • 4. Theme Appendix 2/2: Operating Pre-Tax Profit / Trading VaR (Global) Capital Markets: Secondary Rank 3m12 3m13 JPM #1 #5 DBK Rank 3m13 / 3m12 (Movement) #1 SG FICC FX 3m12 3m13 JPM #1 #1 #2 SG #5 #2 #2 #3 BARC #8 #3 Citi #3 #4 Citi #3 #4 UBS #10 #5 DBK #2 #5 BARC #8 #6 UBS #10 #6 BAML #7 #7 GS #6 3m13 / 3m12 (Movement) #7 EQ Cash FICC Rates Rank 3m12 3m13 UBS #10 #1 DBK #2 CS Rank 3m13 / 3m12 (Movement) 3m12 3m13 JPM #1 #1 #2 SG #5 #2 #9 #3 BARC #8 #3 JPM #1 #4 Citi #3 #4 SG #5 #5 GS #6 #5 MS #4 #6 DBK #2 #6 Citi #3 #7 UBS #10 3m13 / 3m12 (Movement) #7 EQ Derv & Converts FICC Credit Rank 3m12 3m13 JPM #1 #1 UBS #10 DBK Rank 3m13 / 3m12 (Movement) 3m12 3m13 JPM #1 #1 #2 Citi #3 #2 #2 #3 DBK #2 #3 SG #5 #4 GS #6 #4 BARC #8 #5 BAML #7 #5 CS #9 #6 CS #9 #6 GS #6 #7 BNPP #11 3m13 / 3m12 (Movement) #7 FICC Commodities Rank 3m12 #5 #11 #2 UBS #10 #3 JPM #1 #4 BAML #7 #5 DBK #2 #6 MS #4 3m13 / 3m12 (Movement) #1 BNPP 4/5 3m13 SG Source: Tricumen. Notes: (1) VaR = Value at Risk; trading portfolios only, excludes diversification effect/equivalent; period average; normalised to 1-day holding period, 99% confidence, 3-year historical data; annualised for inter-year periods; (2) Arrows indicate movement in ranking relative to the entire peer group (see the ‘Notes’ section, below); up/green arrows indicate Top 25% performance, red/down arrows indicate Bottom 25% performance. (3) Further Notes & Caveats are at the back of this report. (4) This Appendix was extracted from our regular quarterly league tables ranking of Top 7 peers by profits as well as returns per headcount, and on VaR and RWA. Full details are available on request. #7 DK / Agentha / 30 June 2013
  • 5. Theme About Tricumen Tricumen was founded in 2008. It quickly become a strong provider of diversified market intelligence across the capital markets and has since expanded into transaction and corporate banking coverage. Tricumen’s data has been used by many of the world’s leading investment banks as well as strategy consulting firms, investment managers and ‘blue chip’ corporations. Situated near Cambridge in the UK, Tricumen is almost exclusively staffed with senior individuals with an extensive track record of either working for or analysing banks; and boasts what we believe is the largest capital markets-focused research network of its peer group. Caveats This report and the information contained herein may not be reproduced or distributed in the whole or in part without the prior written consent of Tricumen Limited. Such consent is often given, provided that the information released is sourced to Tricumen and that it does not prejudice Tricumen Limited’s business or compromise the company’s ability to analyse the financial markets. Tricumen Limited has used all reasonable care in writing, editing and presenting the information found in this report. All reasonable effort has been made to ensure the information supplied is accurate and not misleading. For the purposes of cross- market comparison, all numerical data is normalised in accordance to Tricumen Limited’s proprietary product classification. Fully-researched dataset may contain margin of error of +/-10%; for modelled datasets, this margin may be wider. The information and commentary provided in this report has been compiled for informational purposes only. We recommend that independent advice and enquiries should be sought before acting upon it. Readers should not rely on this information for legal, accounting, investment, or similar purposes. No part of this report constitutes investment advice, any form of recommendation, or a solicitation to buy or sell any instrument or to engage in any trading or investment activity or strategy. Tricumen Limited does not provide investment advice or personal recommendation nor will it be deemed to have done so. Tricumen Limited makes no representation, guarantee or warranty as to the suitability, accuracy or completeness of the report or the information therein. Tricumen Limited assumes no responsibility for information contained in this report and disclaims all liability arising from negligence or otherwise in respect of such information. Tricumen Limited is not liable for any damages arising in contract, tort or otherwise from the use of or inability to use this report or any material contained in it, or from any action or decision taken as a result of using the report. 5/5 DK / Agentha / 30 June 2013