USA and Phoenix, AZ Q4 2010 Newsletter
•
0 recomendaciones•383 vistas

USA and Phoenix, AZ Q4 2010 Newsletter

Recomendados
Recomendados
Más contenido relacionado
La actualidad más candente
La actualidad más candente (19)
Destacado
Similar a USA and Phoenix, AZ Q4 2010 Newsletter
Similar a USA and Phoenix, AZ Q4 2010 Newsletter (20)
Más de Dean Wegner of Guardian Mortgage, Arizona 602-432-6388
Más de Dean Wegner of Guardian Mortgage, Arizona 602-432-6388 (20)
Último
Último (20)
USA and Phoenix, AZ Q4 2010 Newsletter
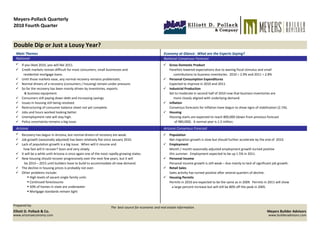
- 1. Meyers‐Pollack Quarterly 2010 Fourth Quarter Double Dip or Just a Lousy Year? Main Themes Economy at Glance: What are the Experts Saying? National National Consensus Forecast If you liked 2010, you will like 2011. Gross Domestic Product Credit markets remain difficult for most consumers, small businesses and Panelists lowered expectations due to waning fiscal stimulus and small residential mortgage loans. contributions to business inventories. 2010 = 2.9% and 2011 = 2.8% Until those markets ease, any normal recovery remains problematic. Personal Consumption Expenditures Normal drivers of a recovery (consumers / housing) remain under pressure. Expected to improve in 2010 and 2011. So far the recovery has been mainly driven by inventories, exports Industrial Production & business equipment. Set to moderate in second half of 2010 now that business inventories are Consumers still paying down debt and increasing savings. more closely aligned with underlying demand. Issues in housing still being resolved. Inflation Restructuring of consumer balance sheet not yet complete. Consensus forecasts for inflation have begun to show signs of stabilization (2.1%). Jobs and hours worked looking better. Housing Unemployment rate will stay high. Housing starts are expected to reach 800,000 (down from previous forecast Policy uncertainty remains a big issue. of 980,000). A normal year is 1.5 million. Arizona Arizona Consensus Forecast Recovery has begun in Arizona, but normal drivers of recovery are weak. Population Job growth (seasonally adjusted) has been relatively flat since January 2010. Net migration growth is slow but should further accelerate by the end of 2010. Lack of population growth is a big issue. When will it resume and Employment how fast will it recover? Soon and very slowly. Month / month seasonally adjusted employment growth turned positive It will be a while until Arizona is once again one of the most rapidly growing states. this summer. Employment expected to be up 1.5% in 2011. New housing should recover progressively over the next few years, but it will Personal Income be 2014 – 2015 until builders have to build to accommodate all new demand. Personal income growth is still weak – due mainly to lack of significant job growth. The decline in housing prices is probably not over. Retail Sales Other problems include: Sales activity has turned positive after several quarters of decline. High levels of vacant single family units Housing Permits Continued foreclosures Permits in 2010 are expected to be the same as in 2009. Permits in 2011 will show 50% of homes in state are underwater a large percent increase but will still be 80% off the peak in 2005. Mortgage standards remain tight Prepared by: The best source for economic and real estate information. Elliott D. Pollack & Co. Meyers Builder Advisors www.arizonaeconomy.com www.builderadvisors.com
- 2. Meyers‐Pollack Quarterly 2010 Fourth Quarter The National Economy The U.S. economy turned positive in the 3rd quarter of 2009, thus signaling the end of the recession. While the recession is technically over, the unemployment rate will remain high for some time and the job recovery will be relatively weak. The consumer will continue to be cautious in coming quarters due to uncertainty in the job market and the residual of negative wealth effects associated with lower home values and weak stock market. Yet, while consumers are still carrying too much debt and consumer confidence still remains at levels associated with weakness, there has been a substantial improvement in both areas. This should allow some upturn in retail sales. U.S. Real Gross Domestic Product National Employment U.S. Leading Indicators Annual Growth 1970-2011* Percent Change Month Ago, Annualized 1978-2010* Source: U.S. Bureau of Economic Analysis & Blue Chip Indicators 1981-2010* Source: The Conference Board Source: US Bureau of Labor Statistics 120 8% 8.0% 110 6% 6.0% 100 4.0% 4% 90 2.0% 2% 80 0.0% 70 0% -2.0% -4.0% 60 -2% -6.0% 50 -4% -8.0% 40 19 0 19 1 19 2 19 3 19 4 19 5 76 19 7 78 19 9 80 19 1 19 2 19 3 84 19 5 86 19 7 88 19 9 90 19 1 92 19 3 19 4 19 5 19 6 97 19 8 99 20 0 01 20 2 03 20 4 05 20 6 20 7 20 8 09 20 0 11 1 2 3 4 5 6 7 8 9 0 1 2 3 4 5 6 7 8 9 0 1 2 3 4 5 6 7 8 9 0 7 7 7 7 7 7 7 7 8 8 8 8 8 8 9 9 9 9 9 9 0 0 0 0 0 0 1 Ja 8 Ja 9 Ja 0 Ja 1 Ja 2 Ja 3 Ja 4 Ja 5 Ja 6 Ja 7 Ja 8 Ja 9 Ja 0 Ja 1 Ja 2 Ja 3 Ja 4 Ja 5 Ja 6 Ja 7 Ja 8 Ja 9 Ja 0 Ja 1 Ja 2 Ja 3 Ja 4 Ja 5 Ja 6 Ja 7 Ja 8 Ja 9 0 n-8 n-8 n-8 n-8 n-8 n-8 n-8 n-8 n-8 n-9 n-9 n-9 n-9 n-9 n-9 n-9 n-9 n-9 n-9 n-0 n-0 n-0 n-0 n-0 n-0 n-0 n-0 n-0 n-0 n-1 19 19 19 19 19 19 19 19 19 19 20 20 20 20 20 n-7 n-7 n-8 n-8 n-8 n-8 n-8 n-8 n-8 n-8 n-8 n-8 n-9 n-9 n-9 n-9 n-9 n-9 n-9 n-9 n-9 n-9 n-0 n-0 n-0 n-0 n-0 n-0 n-0 n-0 n-0 n-0 n-1 Ja Ja Ja Ja Ja Ja Ja Ja Ja Ja Ja Ja Ja Ja Ja Ja Ja Ja Ja Ja Ja Ja Ja Ja Ja Ja Ja Ja Ja Ja Ja * As of Sept 2010 * As of Aug 2010 * As of Aug 2010 Real GDP should be up in 2010 and 2011. Employment has been relatively flat after taking out the Leading Indicators continue to advance. effects of short‐term U.S. Census workers. Key Economic Indicators Hour Worked U.S. Unemployment Rate Annual Growth at Recession End v. One Year Later Quarterly Percent Change 1980-2010* Source: NAHB; Census; BEA; BLS 2000 - 2010* Source: Bureau of Labor Statistics 30% Source: Bureau of Labor Statistics 12.00% 26.7% 6.0% 25% 4.0% Average of 8 Prior Recoveries Current Recovery 10.00% 20% 2.0% 0.0% 8.00% 15% -2.0% 10.0% 9.8% 6.00% 10% 8.2% -4.0% 6.6% 6.0% 5.9% 5% 4.1% 4.2% -6.0% 3.0% 2.7% 2.4% 4.00% -8.0% 0% -0.1% -10.0% 2.00% -5% -12.0% 0.00% -7.5% Q1 Q3 Q1 Q3 Q1 Q3 Q1 Q3 Q1 Q3 Q1 Q3 Q1 Q3 Q1 Q3 Q1 Q3 Q1 Q3 Q1 -10% 0 1 2 3 4 5 6 7 8 9 0 1 2 3 4 5 6 7 8 9 0 1 2 3 4 5 6 7 8 9 0 00 00 01 01 02 02 03 03 04 04 05 05 06 06 07 07 08 08 09 09 10 n-8 n-8 n-8 n-8 n-8 n-8 n-8 n-8 n-8 n-8 n-9 n-9 n-9 n-9 n-9 n-9 n-9 n-9 n-9 n-9 n-0 n-0 n-0 n-0 n-0 n-0 n-0 n-0 n-0 n-0 n-1 Housing Retail Sales Industrial GDP Non- Nonfarm Nonfarm 20 20 20 20 20 20 20 20 20 20 20 20 20 20 20 20 20 20 20 20 20 Ja Ja Ja Ja Ja Ja Ja Ja Ja Ja Ja Ja Ja Ja Ja Ja Ja Ja Ja Ja Ja Ja Ja Ja Ja Ja Ja Ja Ja Ja Ja Starts Production residential payroll employment construction * As of Q2 2010 Businesses are trying to get all they can out of existing The unemployment rate remains high. Key economic variables during this recovery remain weak workers before hiring new ones. despite how far they fell during the recession.
- 3. Meyers‐Pollack Quarterly 2010 Fourth Quarter The National Economy: The Consumer Consumer confidence turned around from its downward spiral earlier this year, but remains relatively flat since mid‐2009. Households continue to pay off debt and save more. The financial obligation ratio is back to pre‐boom levels. Do consumers feel uncomfortable about debt levels or is it due to consumers' inability to get loans? Probably both, but the latter will continue. A return to a free spending consumer will take quite a while. Real Personal Income Household Net Worth Consumer Confidence Percent Change Quarter Ago, Annualized 1970 – 2010* 1978-2010* 1971 – 2010* Source: Federal Reserve Source: The Dismal Scientist Source: Bureau of Economic Analysis 70 150 14.0% 140 12.0% 60 130 10.0% 120 8.0% 50 110 6.0% 100 4.0% 40 90 2.0% 80 0.0% 30 70 -2.0% 60 -4.0% 20 50 -6.0% 40 -8.0% 10 30 -10.0% 20 -12.0% 0 Ja 8 Ja 9 Ja 0 Ja 1 Ja 2 Ja 3 Ja 4 Ja 5 Ja 6 Ja 7 Ja 8 Ja 9 Ja 0 Ja 1 Ja 2 Ja 3 Ja 4 Ja 5 Ja 6 Ja 7 Ja 8 Ja 9 Ja 0 Ja 1 Ja 2 Ja 3 Ja 4 Ja 5 Ja 6 Ja 7 Ja 8 Ja 9 0 n-7 n-7 n-8 n-8 n-8 n-8 n-8 n-8 n-8 n-8 n-8 n-8 n-9 n-9 n-9 n-9 n-9 n-9 n-9 n-9 n-9 n-9 n-0 n-0 n-0 n-0 n-0 n-0 n-0 n-0 n-0 n-0 n-1 19 1 Q1 19 Q1 19 Q1 19 Q1 19 5 Q1 19 Q1 19 7 Q1 19 Q1 19 Q1 19 0 Q1 19 Q1 19 2 Q1 19 Q1 19 Q1 19 Q1 19 Q1 19 Q1 19 Q1 19 9 Q1 19 Q1 19 Q1 19 Q1 19 3 Q1 19 Q1 19 5 Q1 19 Q1 19 Q1 19 Q1 20 Q1 20 0 Q1 20 Q1 20 2 Q1 20 Q1 20 Q1 20 5 Q1 20 Q1 20 7 Q1 20 Q1 20 9 Q1 Q1 Q1 Q2 Q3 Q4 Q1 Q2 Q3 Q4 Q1 Q2 Q3 Q4 Q1 Q2 Q3 Q4 Q1 Q2 Q3 Q4 Q1 Q2 Q3 Q4 Q1 20 Q2 20 Q3 20 Q4 20 Q1 20 Q2 20 Q3 20 Q4 Q1 Ja 70 71 72 73 75 76 77 78 80 81 82 83 85 86 87 88 90 91 92 93 95 96 97 98 00 01 72 73 74 76 78 79 81 83 84 85 86 87 88 90 91 92 94 96 97 98 99 01 03 04 06 08 10 02 03 05 06 07 08 10 7 7 7 8 8 8 9 9 0 0 0 0 0 19 19 19 19 19 19 19 19 19 19 19 19 19 19 19 19 19 19 19 19 19 19 19 19 20 20 19 * As of Aug 2010 * As of Aug 2010 * As of Q2 2010 Consumer confidence up to levels historically associated Real incomes are growing again. It will take sustained Household net worth turned positive in the fourth with the bottom of a recession. employment and hours worked growth to push up the quarter of 2009. People will continue to feel better but rate of growth. modestly so. Financial Obligation Ratio Household Net Private Saving Real Retail Sales U.S. 1980-2010* 1971 - 2010* Percent Change Year Ago Source: Federal Reserve Source: Free Lunch.com 1973-2010* $1,200,000 Source: Federal Reserve 20.00% 15.00% $1,100,000 $1,000,000 19.00% 10.00% $900,000 $800,000 5.00% 18.00% $700,000 $600,000 0.00% $500,000 17.00% $400,000 -5.00% $300,000 16.00% $200,000 -10.00% $100,000 15.00% $0 -15.00% 20 9 3 19 Q1 19 Q3 19 Q1 19 Q3 19 Q1 19 Q3 19 Q1 19 Q3 19 Q1 19 Q3 19 Q1 19 Q3 19 Q1 19 Q3 19 Q1 19 Q3 19 Q1 19 Q3 19 1 Q1 20 Q3 20 Q1 20 Q3 20 Q1 20 Q3 Q1 Q1 Q2 Q3 Q4 Q1 Q2 Q3 Q4 Q1 Q2 Q3 Q4 Q1 Q2 Q3 Q4 Q1 Q2 Q3 Q4 Q1 Q2 Q3 Q4 Q1 Q Ja 73 Ja 4 Ja 5 Ja 6 Ja 77 Ja 8 Ja 9 Ja 80 Ja 1 Ja 82 Ja 3 Ja 84 Ja 85 Ja 6 Ja 7 Ja 8 Ja 89 Ja 0 Ja 91 Ja 2 Ja 3 Ja 94 Ja 5 Ja 96 Ja 7 Ja 8 Ja 99 Ja 0 Ja 1 Ja 2 Ja 03 Ja 04 Ja 5 Ja 06 Ja 7 Ja 08 Ja 9 0 9 n-7 n-7 n-7 n-7 n-7 n-8 n-8 n-8 n-8 n-8 n-9 n-9 n-9 n-9 n-9 n-9 n-0 n-0 n-0 n-0 n-0 n-0 n-1 71 72 74 75 77 78 80 81 83 84 86 87 89 90 92 93 95 96 98 01 02 04 05 07 08 10 80 81 82 83 85 86 87 88 90 91 92 93 95 96 97 98 00 01 02 03 05 06 07 08 10 n- n- n- n- n- n- n- n- n- n- n- n- n- n- n- Ja 19 20 19 19 19 19 19 19 19 19 19 19 19 19 19 19 19 19 20 20 20 20 20 20 20 20 20 * As of Q1 2010 * As of Q1 2010 * As of June 2010 The financial obligation ratio is at levels first seen in The quantity of savings has almost doubled from pre‐ Retail sales has turned positive after several quarters of 1985 and not seen since 1999. How much more does it recession levels. This is a good sign. Savings needs to be decline. have to fall before consumers feel comfortable? higher since consumers can no longer use their house as Probably down to 16% or less. But, given consumers' a credit card and stocks are still way off of the peak. inability to borrow, the ratio could go even lower.