
Recomendados
Más contenido relacionado
La actualidad más candente
La actualidad más candente (9)
Destacado
Destacado (8)
Similar a 1) 1999, 2001, and 2008 CIRP Frequency Distribution Trend Results of CMU Responses
Similar a 1) 1999, 2001, and 2008 CIRP Frequency Distribution Trend Results of CMU Responses (20)
1) 1999, 2001, and 2008 CIRP Frequency Distribution Trend Results of CMU Responses
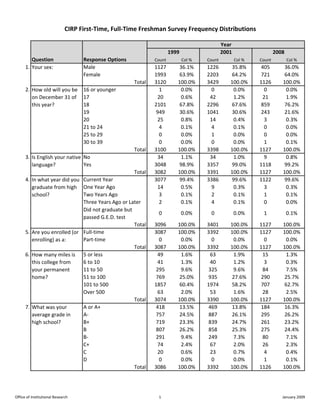
- 1. CIRP First‐Time, Full‐Time Freshman Survey Frequency Distributions Year 1999 2001 2008 Question Response Options Count Col % Count Col % Count Col % 1. Your sex: Male 1127 36.1% 1226 35.8% 405 36.0% Female 1993 63.9% 2203 64.2% 721 64.0% Total 3120 100.0% 3429 100.0% 1126 100.0% 2. How old will you be 16 or younger 1 0.0% 0 0.0% 0 0.0% on December 31 of 17 20 0.6% 42 1.2% 21 1.9% this year? 18 2101 67.8% 2296 67.6% 859 76.2% 19 949 30.6% 1041 30.6% 243 21.6% 20 25 0.8% 14 0.4% 3 0.3% 21 to 24 4 0.1% 4 0.1% 0 0.0% 25 to 29 0 0.0% 1 0.0% 0 0.0% 30 to 39 0 0.0% 0 0.0% 1 0.1% Total 3100 100.0% 3398 100.0% 1127 100.0% 3. Is English your native No 34 1.1% 34 1.0% 9 0.8% language? Yes 3048 98.9% 3357 99.0% 1118 99.2% Total 3082 100.0% 3391 100.0% 1127 100.0% 4. In what year did you Current Year 3077 99.4% 3386 99.6% 1122 99.6% graduate from high One Year Ago 14 0.5% 9 0.3% 3 0.3% school? Two Years Ago 3 0.1% 2 0.1% 1 0.1% Three Years Ago or Later 2 0.1% 4 0.1% 0 0.0% Did not graduate but 0 0.0% 0 0.0% 1 0.1% passed G.E.D. test Total 3096 100.0% 3401 100.0% 1127 100.0% 5. Are you enrolled (or Full‐time 3087 100.0% 3392 100.0% 1127 100.0% enrolling) as a: Part‐time 0 0.0% 0 0.0% 0 0.0% Total 3087 100.0% 3392 100.0% 1127 100.0% 6. How many miles is 5 or less 49 1.6% 63 1.9% 15 1.3% this college from 6 to 10 41 1.3% 40 1.2% 3 0.3% your permanent 11 to 50 295 9.6% 325 9.6% 84 7.5% home? 51 to 100 769 25.0% 935 27.6% 290 25.7% 101 to 500 1857 60.4% 1974 58.2% 707 62.7% Over 500 63 2.0% 53 1.6% 28 2.5% Total 3074 100.0% 3390 100.0% 1127 100.0% 7. What was your A or A+ 418 13.5% 469 13.8% 184 16.3% average grade in A‐ 757 24.5% 887 26.1% 295 26.2% high school? B+ 719 23.3% 839 24.7% 261 23.2% B 807 26.2% 858 25.3% 275 24.4% B‐ 291 9.4% 249 7.3% 80 7.1% C+ 74 2.4% 67 2.0% 26 2.3% C 20 0.6% 23 0.7% 4 0.4% D 0 0.0% 0 0.0% 1 0.1% Total 3086 100.0% 3392 100.0% 1126 100.0% Office of Institutional Research 1 January 2009
- 2. Year 1999 2001 2008 Question Response Options Count Col % Count Col % Count Col % 8. What was your 18 or lower 90 8.3% composite ACT 19 ‐ 21 327 30.3% score? 22 ‐ 24 352 32.6% NA NA 25 ‐ 27 198 18.4% 28 or higher 112 10.4% Total 1079 100.0% 9. From what kind of Public school 1034 91.7% high school did you Public charter school 15 1.3% graduate? Public magnet school 2 0.2% Private religious/ Changed Response 64 5.7% parochial school NA Options Private independent 10 0.9% college‐prep school Home school 2 0.2% Total 1127 100.0% 10. Prior to this term, No 3026 98.0% 3346 98.1% 1093 97.1% have you ever taken courses for credit at Yes 61 2.0% 64 1.9% 33 2.9% this institution? Total 3087 100.0% 3410 100.0% 1126 100.0% 11. Since leaving high school, have you No 2788 89.4% 3026 88.2% 1027 91.2% ever taken courses, whether for credit or not for credit, at any Yes 332 10.6% 403 11.8% 99 8.8% other institution? Total 3120 100.0% 3429 100.0% 1126 100.0% 12. Where do you plan With my family or other 153 4.9% 164 4.8% 35 3.1% to live during the fall relatives term? Other private home, 27 0.9% 28 0.8% 8 0.7% apartment, or room College residence hall 2902 93.3% 3205 93.7% 1066 94.6% Fraternity or sorority 2 0.1% 3 0.1% 1 0.1% house Other campus student 24 0.8% 17 0.5% 15 1.3% housing Other 2 0.1% 2 0.1% 2 0.2% Total 3110 100.0% 3419 100.0% 1127 100.0% Office of Institutional Research 2 January 2009
- 3. Year 1999 2001 2008 Question Response Options Count Col % Count Col % Count Col % 13. To how many None 715 23.1% 810 23.8% 251 22.3% colleges other than One 676 21.8% 690 20.2% 201 17.8% this one did you Two 767 24.7% 740 21.7% 257 22.8% apply for admission Three 513 16.5% 665 19.5% 231 20.5% this year? Four 261 8.4% 285 8.4% 117 10.4% Five 95 3.1% 136 4.0% 46 4.1% Six 37 1.2% 42 1.2% 9 0.8% Seven to ten 28 0.9% 33 1.0% 12 1.1% Eleven or more 9 0.3% 8 0.2% 3 0.3% Total 3101 100.0% 3409 100.0% 1127 100.0% 14. Were you accepted No 130 11.5% by your first choice Yes NA NA 997 88.5% college? Total 1127 100.0% 15. Is this college your: Less than third choice 26 0.8% 33 1.0% 10 0.9% Third choice 59 1.9% 90 2.6% 42 3.7% Second choice 544 17.5% 713 20.8% 274 24.3% First choice 2478 79.8% 2586 75.6% 800 71.0% Total 3107 100.0% 3422 100.0% 1126 100.0% 16. Citizenship status: Neither 4 0.1% 0 0.0% 2 0.2% Permanent resident 13 0.4% 18 0.5% 7 0.6% U.S. citizen 3081 99.5% 3387 99.5% 1118 99.2% Total 3098 100.0% 3405 100.0% 1127 100.0% 17. Are your parents: One or both deceased 93 3.0% 98 2.9% 34 3.0% Both alive, divorced or 731 23.7% 847 24.9% 304 27.0% living apart Both alive and living with 2259 73.3% 2453 72.2% 789 70.0% each other Total 3083 100.0% 3398 100.0% 1127 100.0% 18a. During high school None 3 0.1% 2 0.2% how may years did One‐half 2 0.1% 1 0.1% you study each of One 3 0.1% 4 0.4% the following: Two 18 0.5% 3 0.3% NA English Three 230 6.7% 49 4.3% Four 3015 88.2% 1026 91.0% Five or more 149 4.4% 42 3.7% Total 3420 100.0% 1127 100.0% 18b. During high school None 0 0.0% 4 0.4% how may years did One‐half 4 0.1% 3 0.3% you study each of One 5 0.1% 8 0.7% the following: Two 168 4.9% 39 3.5% NA Mathematics Three 1181 34.6% 247 21.9% Four 1957 57.3% 785 69.7% Five or more 102 3.0% 41 3.6% Total 3417 100.0% 1127 100.0% Office of Institutional Research 3 January 2009
- 4. Year 1999 2001 2008 Question Response Options Count Col % Count Col % Count Col % 18c. During high school None 227 6.7% 68 6.0% how may years did One‐half 60 1.8% 18 1.6% you study each of One 454 13.3% 131 11.6% the following: Two 1447 42.5% 458 40.7% NA Foreign Language Three 736 21.6% 254 22.6% Four 454 13.3% 179 15.9% Five or more 27 0.8% 18 1.6% Total 3405 100.0% 1126 100.0% 18d. During high school None 217 6.4% 39 3.5% how may years did One‐half 141 4.1% 32 2.8% you study each of One 1360 40.0% 417 37.1% the following: Two 1083 31.9% 362 32.2% NA Physical Science Three 437 12.9% 179 15.9% Four 148 4.4% 92 8.2% Five or more 13 0.4% 4 0.4% Total 3399 100.0% 1125 100.0% 18e. During high school None 92 2.7% 12 1.1% how may years did One‐half 112 3.3% 21 1.9% you study each of One 1675 49.2% 469 41.7% the following: Two 1158 34.0% 416 37.0% NA Biological Science Three 259 7.6% 121 10.8% Four 101 3.0% 80 7.1% Five or more 9 0.3% 6 0.5% Total 3406 100.0% 1125 100.0% 18f. During high school None 1 0.0% 2 0.2% how may years did One‐half 40 1.2% 11 1.0% you study each of One 288 8.5% 74 6.6% the following: Two 855 25.2% 211 18.8% NA History/Am. Govt. Three 1272 37.4% 442 39.4% Four 903 26.6% 369 32.9% Five or more 38 1.1% 14 1.2% Total 3397 100.0% 1123 100.0% 18g. During high school None 876 26.0% 275 24.5% how may years did One‐half 574 17.0% 169 15.0% you study each of One 1084 32.2% 378 33.7% the following: Two 555 16.5% 199 17.7% NA Computer Science Three 179 5.3% 64 5.7% Four 88 2.6% 35 3.1% Five or more 14 0.4% 3 0.3% Total 3370 100.0% 1123 100.0% Office of Institutional Research 4 January 2009
- 5. Year 1999 2001 2008 Question Response Options Count Col % Count Col % Count Col % 18h. During high school None 838 24.7% 252 22.4% how may years did One‐half 211 6.2% 81 7.2% you study each of One 599 17.6% 162 14.4% the following: Arts Two 479 14.1% 166 14.7% NA and/or Music Three 290 8.5% 103 9.1% Four 850 25.0% 313 27.8% Five or more 128 3.8% 50 4.4% Total 3395 100.0% 1127 100.0% 19a. Highest Degree None 12 0.5% 10 0.3% 14 1.3% Planned at Any Vocational certificate 2 0.1% 4 0.1% 3 0.3% Institution: Associate 4 0.2% 3 0.1% 22 2.0% Bachelor's degree 903 34.7% 939 32.2% 279 25.1% Master's degree 1212 46.6% 1390 47.7% 473 42.6% Ph.D. or Ed.D. 280 10.8% 355 12.2% 200 18.0% M.D., D.O., D.D.S., D.V.M. 104 4.0% 136 4.7% 80 7.2% J.D. (Law) 51 2.0% 47 1.6% 21 1.9% B.D. or M.DIV. (Divinity) 4 0.2% 6 0.2% 2 0.2% Other 30 1.2% 24 0.8% 17 1.5% Total 2602 100.0% 2914 100.0% 1111 100.0% 19b. Highest Degree None 27 1.7% 31 1.7% 23 2.1% Planned at This Vocational certificate 3 0.2% 3 0.2% 10 0.9% Institution: Associate 22 1.3% 37 2.0% 37 3.4% Bachelor's degree 1131 69.2% 1273 69.3% 636 58.9% Master's degree 385 23.5% 433 23.6% 276 25.6% Ph.D. or Ed.D. 39 2.4% 31 1.7% 61 5.7% M.D., D.O., D.D.S., D.V.M. 3 0.2% 9 0.5% 15 1.4% J.D. (Law) 6 0.4% 3 0.2% 4 0.4% B.D. or M.DIV. (Divinity) 3 0.2% 0 0.0% 3 0.3% Other 16 1.0% 18 1.0% 14 1.3% Total 1635 100.0% 1838 100.0% 1079 100.0% 20a. Racial composition Completely non‐White 9 0.8% of high school I last Mostly non‐White 43 3.8% attended: Roughly half non‐White 195 17.3% NA NA Mostly White 772 68.6% Completely White 106 9.4% Total 1125 100.0% 20b. Racial composition Completely non‐White 14 1.2% of the neighborhood Mostly non‐White 38 3.4% where I grew up: Roughly half non‐White 92 8.2% NA NA Mostly White 658 58.4% Completely White 324 28.8% Total 1126 100.0% Office of Institutional Research 5 January 2009
- 6. Year 1999 2001 2008 Question Response Options Count Col % Count Col % Count Col % 21a. Do you have a No 998 88.6% disability? Yes NA NA 129 11.4% Total 1127 100.0% 21b. Of those that have a No 118 91.5% disability: Hearing Yes NA NA 11 8.5% Disability Total 129 100.0% 21c. Of those that have a No 123 95.3% disability: Speech Yes NA NA 6 4.7% Disability Total 129 100.0% 21d. Of those that have a No 125 96.9% disability: Yes NA NA 4 3.1% Orthopedic Disability Total 129 100.0% 21e. Of those that have a No 99 76.7% disability: Learning Yes NA NA 30 23.3% Disability Total 129 100.0% 21f. Of those that have a No 115 89.1% disability: Partially Yes NA NA 14 10.9% sighted or blind Total 129 100.0% 21g. Of those that have a No 108 83.7% disability: Health‐ Yes NA NA 21 16.3% related Disability Total 129 100.0% 21h. Of those that have a No 110 85.3% disability: Other Yes NA NA 19 14.7% Disability Total 129 100.0% 22a. How much of your None 312 9.7% 192 17.2% first year's Less than $1,000 410 12.8% 153 13.7% educational expenses do you $1,000 ‐ 2,999 645 20.1% 173 15.5% expect to cover $3,000 ‐ 5,999 NA 765 23.8% 195 17.5% from: Family $6,000 ‐ 9,999 566 17.6% 155 13.9% resources (parents, relatives, spouse, $10,000 + 514 16.0% 249 22.3% etc.) Total 3212 100.0% 1117 100.0% 22b. How much of your None 402 13.8% 189 17.0% first year's educational Less than $1,000 1050 36.0% 382 34.3% expenses do you $1,000 ‐ 2,999 1067 36.6% 372 33.4% expect to cover $3,000 ‐ 5,999 NA 312 10.7% 114 10.2% from: My own resources (savings $6,000 ‐ 9,999 61 2.1% 39 3.5% from work, work‐ $10,000 + 25 0.9% 19 1.7% study, other income) Total 2917 100.0% 1115 100.0% Office of Institutional Research 6 January 2009
- 7. Year 1999 2001 2008 Question Response Options Count Col % Count Col % Count Col % 22c. How much of your None 326 10.6% 238 21.4% first year's educational Less than $1,000 202 6.6% 118 10.6% expenses do you $1,000 ‐ 2,999 1110 36.1% 279 25.1% expect to cover from: Aid which $3,000 ‐ 5,999 NA 955 31.1% 243 21.9% need not be repaid (grants, $6,000 ‐ 9,999 334 10.9% 128 11.5% scholarships, $10,000 + 144 4.7% 104 9.4% military funding, etc.) Total 3071 100.0% 1110 100.0% 22d. How much of your None 1133 41.7% 315 28.3% first year's Less than $1,000 225 8.3% 44 4.0% educational $1,000 ‐ 2,999 659 24.3% 120 10.8% expenses do you $3,000 ‐ 5,999 NA 443 16.3% 234 21.0% expect to cover $6,000 ‐ 9,999 185 6.8% 207 18.6% from: Aid which $10,000 + 69 2.5% 192 17.3% must be repaid Total 2714 100.0% 1112 100.0% 22e. How much of your None 1477 90.1% 900 82.1% first year's Less than $1,000 80 4.9% 104 9.5% educational $1,000 ‐ 2,999 43 2.6% 55 5.0% expenses do you $3,000 ‐ 5,999 NA 21 1.3% 17 1.6% expect to cover $6,000 ‐ 9,999 8 0.5% 10 0.9% from: Other than $10,000 + 10 0.6% 10 0.9% above Total 1639 100.0% 1096 100.0% 23. What is your best Less than $10,000 30 2.7% estimate of your $10,000 to $14,999 25 2.3% parents' total $15,000 to $19,999 22 2.0% income last year? $20,000 to $24,999 32 2.9% Consider income $25,000 to $29,999 33 3.0% from all sources $30,000 to $39,999 76 6.9% before taxes $40,000 to $49,999 78 7.1% Response Options Response Options $50,000 to $59,999 109 9.9% Differed Differed $60,000 to $74,999 161 14.6% $75,000 to $99,999 187 17.0% $100,000 to $149,999 196 17.8% $150,000 to $199,999 78 7.1% $200,000 to $249,999 31 2.8% $250,000 or more 44 4.0% Total 1102 100.0% Office of Institutional Research 7 January 2009
- 8. Year 1999 2001 2008 Question Response Options Count Col % Count Col % Count Col % 23.* What is your best Less than $10,000 67 2.4% 60 2.0% 30 2.7% estimate of your $10,000 to $14,999 51 1.8% 57 1.8% 25 2.3% parents' total $15,000 to $19,999 66 2.4% 73 2.3% 22 2.0% income last year? $20,000 to $24,999 90 3.2% 110 3.5% 32 2.9% *Recoded: 1999 and $25,000 to $29,999 107 3.8% 114 3.6% 33 3.0% 2000 included "less $30,000 to $39,999 245 8.8% 230 7.4% 76 6.9% than $6,000"; $40,000 to $49,999 314 11.3% 327 10.5% 78 7.1% "$6,000 to $9,999"; $50,000 to $59,999 386 13.8% 410 13.1% 109 9.9% and "$200,000 or $60,000 to $74,999 489 17.5% 535 17.1% 161 14.6% more" $75,000 to $99,999 447 16.0% 519 16.6% 187 17.0% $100,000 to $149,999 355 12.7% 476 15.2% 196 17.8% $150,000 to $199,999 117 4.2% 136 4.3% 78 7.1% $200,000 or more 55 2.0% 81 2.6% 75 6.8% Total 2789 100.0% 3128 100.0% 1102 100.0% 24. Do you have any None (I am confident that 867 28.8% 936 27.9% 271 24.1% concern about your I will have sufficient funds) ability to finance Some (but I probably will 1691 56.1% 1976 58.8% 653 58.0% your college have enough funds) education? Major (not sure I will have 454 15.1% 447 13.3% 201 17.9% enough funds) Total 3012 100.0% 3359 100.0% 1125 100.0% 25a.* Your current Baptist 186 6.2% 247 7.4% 54 4.8% religious preference: Buddhist 3 0.1% 7 0.2% 5 0.4% *Recoded: 2008 Church of Christ NA NA NA NA 50 4.5% included "Church of Eastern Orthodox 12 0.4% 8 0.2% 6 0.5% Christ", "Hindu", and Episcopalian 33 1.1% 32 1.0% 9 0.8% "Muslim" Hindu NA NA NA NA 0 0.0% Islamic 3 0.1% 3 0.1% 0 0.0% Jewish 8 0.3% 12 0.4% 6 0.5% LDS (Mormon) 7 0.2% 6 0.2% 1 0.1% Lutheran 341 11.4% 324 9.7% 89 7.9% Methodist 267 8.9% 251 7.5% 91 8.1% Muslim NA NA NA NA 1 0.1% Presbyterian 139 4.7% 125 3.8% 24 2.1% Quaker 5 0.2% 6 0.2% 2 0.2% Roman Catholic 1005 33.6% 1078 32.3% 293 26.2% Seventh Day Adventist 5 0.2% 9 0.3% 3 0.3% United Church of Christ/ 29 1.0% 50 1.5% 11 1.0% Congregational Other Christian 368 12.3% 499 15.0% 219 19.6% Other Religion 76 2.5% 85 2.6% 36 3.2% None 501 16.8% 591 17.7% 220 19.6% Total 2988 100.0% 3333 100.0% 1120 100.0% Office of Institutional Research 8 January 2009
- 9. Year 1999 2001 2008 Question Response Options Count Col % Count Col % Count Col % 25b.* Your father's current Baptist 178 6.6% 238 7.7% 68 6.1% religious preference: Buddhist 4 0.1% 6 0.2% 0 0.0% *Recoded: 2008 Church of Christ NA NA NA NA 59 5.3% included "Church of Eastern Orthodox 8 0.3% 7 0.2% 9 0.8% Christ", "Hindu", and Episcopalian 30 1.1% 35 1.1% 11 1.0% "Muslim" Hindu NA NA NA NA 0 0.0% Islamic 6 0.2% 7 0.2% 0 0.0% Jewish 17 0.6% 17 0.5% 10 0.9% LDS (Mormon) 5 0.2% 3 0.1% 3 0.3% Lutheran 341 12.6% 332 10.7% 98 8.8% Methodist 254 9.4% 244 7.9% 82 7.4% Muslim NA NA NA NA 4 0.4% Presbyterian 133 4.9% 134 4.3% 42 3.8% Quaker 5 0.2% 3 0.1% 2 0.2% Roman Catholic 968 35.7% 1093 35.3% 292 26.3% Seventh Day Adventist 4 0.1% 7 0.2% 5 0.4% United Church of Christ/ 19 0.7% 42 1.4% 13 1.2% Congregational Other Christian 295 10.9% 388 12.5% 199 17.9% Other Religion 44 1.6% 51 1.6% 26 2.3% None 403 14.8% 488 15.8% 189 17.0% Total 2714 100.0% 3095 100.0% 1112 100.0% 25c.* Your mother's Baptist 191 6.8% 254 8.0% 73 6.5% current religious Buddhist 1 0.0% 4 0.1% 0 0.0% preference: Church of Christ NA NA NA NA 64 5.7% *Recoded: 2008 Eastern Orthodox 7 0.2% 8 0.3% 10 0.9% included "Church of Episcopalian 40 1.4% 41 1.3% 13 1.2% Christ", "Hindu", and Hindu NA NA NA NA 0 0.0% "Muslim" Islamic 3 0.1% 3 0.1% 0 0.0% Jewish 17 0.6% 8 0.3% 8 0.7% LDS (Mormon) 5 0.2% 6 0.2% 1 0.1% Lutheran 360 12.8% 349 11.0% 111 9.9% Methodist 279 9.9% 288 9.1% 101 9.1% Muslim NA NA NA NA 1 0.1% Presbyterian 155 5.5% 151 4.8% 36 3.2% Quaker 8 0.3% 4 0.1% 2 0.2% Roman Catholic 1066 38.0% 1151 36.3% 320 28.7% Seventh Day Adventist 4 0.1% 10 0.3% 6 0.5% United Church of Christ/ 22 0.8% 43 1.4% 12 1.1% Congregational Other Christian 330 11.8% 461 14.5% 208 18.6% Other Religion 45 1.6% 60 1.9% 24 2.2% None 274 9.8% 330 10.4% 126 11.3% Total 2807 100.0% 3171 100.0% 1116 100.0% Office of Institutional Research 9 January 2009
- 10. Year 1999 2001 2008 Question Response Options Count Col % Count Col % Count Col % 26a. Activities noted in Not at all 562 18.1% 566 16.6% 293 26.0% the past year: Occasionally 1368 44.1% 1521 44.5% 477 42.3% Attended a religious Frequently 1169 37.7% 1328 38.9% 357 31.7% service Total 3099 100.0% 3415 100.0% 1127 100.0% 26b. Activities noted in Not at all 36 1.2% 42 1.2% 39 3.5% the past year: Was Occasionally 1577 50.8% 1603 46.9% 654 58.1% bored in class Frequently 1490 48.0% 1773 51.9% 433 38.5% Total 3103 100.0% 3418 100.0% 1126 100.0% 26c. Activities noted in Not at all 1397 45.2% 1487 43.6% 828 73.5% the past year: Occasionally 1316 42.6% 1494 43.9% 267 23.7% Participated in political Frequently 377 12.2% 426 12.5% 31 2.8% demonstrations Total 3090 100.0% 3407 100.0% 1126 100.0% 26d. Activities noted in Not at all 1658 53.5% 1812 53.1% 495 44.0% the past year: Occasionally 1114 35.9% 1256 36.8% 518 46.0% Tutored another Frequently 329 10.6% 345 10.1% 113 10.0% student Total 3101 100.0% 3413 100.0% 1126 100.0% 26e. Activities noted in Not at all 452 14.6% 484 14.2% 122 10.8% the past year: Occasionally 1957 63.1% 2194 64.2% 748 66.4% Studied with other Frequently 692 22.3% 739 21.6% 257 22.8% students Total 3101 100.0% 3417 100.0% 1127 100.0% 26f. Activities noted in Not at all 2121 68.4% 2279 66.8% 865 76.8% the past year: Was a Occasionally 837 27.0% 970 28.4% 218 19.3% guest in a teacher's Frequently 145 4.7% 163 4.8% 44 3.9% home Total 3103 100.0% 3412 100.0% 1127 100.0% 26g. Activities noted in Not at all 1933 62.4% 2325 68.0% 865 76.8% the past year: Occasionally 686 22.1% 685 20.0% 200 17.7% Smoked cigarettes Frequently 481 15.5% 409 12.0% 62 5.5% Total 3100 100.0% 3419 100.0% 1127 100.0% 26h. Activities noted in Not at all 1319 42.6% 1537 45.0% 626 55.5% the past year: Drank Occasionally 1367 44.2% 1447 42.3% 407 36.1% beer Frequently 409 13.2% 435 12.7% 94 8.3% Total 3095 100.0% 3419 100.0% 1127 100.0% 26i. Activities noted in Not at all 1156 37.4% 1259 36.8% 557 49.4% the past year: Drank Occasionally 1639 53.0% 1787 52.2% 492 43.7% wine or liquor Frequently 296 9.6% 375 11.0% 78 6.9% Total 3091 100.0% 3421 100.0% 1127 100.0% 26j. Activities noted in Not at all 247 7.9% 299 8.8% 91 8.1% the past year: Felt Occasionally 1738 55.9% 1937 56.7% 648 57.5% overwhelmed by all Frequently 1122 36.1% 1180 34.5% 388 34.4% I had to do Total 3107 100.0% 3416 100.0% 1127 100.0% 26k. Activities noted in Not at all 1071 34.5% 1288 37.7% 403 35.8% the past year: Felt Occasionally 1738 56.0% 1853 54.2% 619 54.9% depressed Frequently 295 9.5% 276 8.1% 105 9.3% Total 3104 100.0% 3417 100.0% 1127 100.0% Office of Institutional Research 10 January 2009
- 11. Year 1999 2001 2008 Question Response Options Count Col % Count Col % Count Col % 26l. Activities noted in Not at all 654 21.1% 704 20.6% 179 15.9% the past year: Occasionally 1735 56.0% 1856 54.3% 654 58.1% Performed Frequently 711 22.9% 858 25.1% 293 26.0% volunteer work Total 3100 100.0% 3418 100.0% 1126 100.0% 26m. Activities noted in Not at all 2010 64.9% 2114 61.9% 642 57.0% the past year: Occasionally 442 14.3% 553 16.2% 210 18.6% Played a musical Frequently 647 20.9% 748 21.9% 275 24.4% instrument Total 3099 100.0% 3415 100.0% 1127 100.0% 26n. Activities noted in Not at all 522 16.8% 546 16.0% 146 13.0% the past year: Asked Occasionally 1968 63.4% 2119 62.0% 691 61.3% a teacher for advice Frequently 613 19.8% 754 22.1% 290 25.7% after class Total 3103 100.0% 3419 100.0% 1127 100.0% 26o. Activities noted in Not at all 730 23.6% 677 19.9% 263 23.4% the past year: Voted Occasionally 1749 56.5% 1987 58.3% 597 53.0% in a student election Frequently 615 19.9% 742 21.8% 266 23.6% Total 3094 100.0% 3406 100.0% 1126 100.0% 26p. Activities noted in Not at all 150 4.8% 134 3.9% 46 4.1% the past year: Socialized with Occasionally 1295 41.7% 1359 39.8% 455 40.4% someone of another Frequently 1660 53.5% 1922 56.3% 624 55.5% racial/ethnic group Total 3105 100.0% 3415 100.0% 1125 100.0% 26q. Activities noted in Not at all 897 29.0% 960 28.3% 461 40.9% the past year: Came Occasionally 1823 58.9% 1920 56.5% 575 51.0% late to class Frequently 376 12.1% 516 15.2% 91 8.1% Total 3096 100.0% 3396 100.0% 1127 100.0% 26r. Activities noted in Not at all 180 5.8% 50 1.5% 5 0.4% the past year: Used Occasionally 1137 36.6% 785 22.9% 258 22.9% the Internet: For research or Frequently 1787 57.6% 2586 75.6% 864 76.7% homework Total 3104 100.0% 3421 100.0% 1127 100.0% 26s. Activities noted in Not at all 152 13.5% the past year: Used Occasionally 476 42.2% NA NA the Internet: To Frequently 499 44.3% read news sites Total 1127 100.0% 26t. Activities noted in Not at all 483 42.9% the past year: Used Occasionally 328 29.1% NA NA the Internet: To Frequently 315 28.0% read blogs Total 1126 100.0% 26u. Activities noted in Not at all 704 62.6% the past year: Used Occasionally 243 21.6% NA NA the Internet: To Frequently 178 15.8% blog Total 1125 100.0% Office of Institutional Research 11 January 2009
- 12. Year 1999 2001 2008 Question Response Options Count Col % Count Col % Count Col % 26v. Activities noted in Not at all 1498 48.4% 1620 47.4% 411 36.5% the past year: Occasionally 1165 37.6% 1309 38.3% 519 46.1% Performed community service Frequently 434 14.0% 490 14.3% 197 17.5% as part of a class Total 3097 100.0% 3419 100.0% 1127 100.0% 26w. Activities noted in Not at all 727 23.6% 709 20.8% 218 19.4% the past year: Occasionally 1727 56.0% 1896 55.7% 603 53.6% Discussed religion Frequently 632 20.5% 801 23.5% 305 27.1% Total 3086 100.0% 3406 100.0% 1126 100.0% 26x. Activities noted in Not at all 1025 33.2% 1000 29.4% 159 14.1% the past year: Occasionally 1659 53.7% 1881 55.2% 634 56.3% Discussed politics Frequently 408 13.2% 524 15.4% 334 29.6% Total 3092 100.0% 3405 100.0% 1127 100.0% 26y. Activities noted in Not at all 1004 89.1% the past year: Occasionally 98 8.7% Worked on a local, NA NA state or national Frequently 25 2.2% political campaign Total 1127 100.0% 27a. Rate yourself on Lowest 10% 0 0.0% 0 0.0% 1 0.1% each trait compared Below average 18 0.6% 24 0.7% 16 1.4% with the average Average 1082 35.0% 1189 34.8% 376 33.4% person your age: Above average 1593 51.5% 1774 51.9% 559 49.6% Academic ability Highest 10% 399 12.9% 429 12.6% 174 15.5% Total 3092 100.0% 3416 100.0% 1126 100.0% 27b. Rate yourself on Lowest 10% 386 12.5% 392 11.5% 117 10.4% each trait compared Below average 1044 33.8% 1023 29.9% 396 35.2% with the average Average 956 30.9% 1120 32.8% 347 30.8% person your age: Above average 552 17.9% 697 20.4% 203 18.0% Artistic ability Highest 10% 153 4.9% 184 5.4% 62 5.5% Total 3091 100.0% 3416 100.0% 1125 100.0% 27c. Rate yourself on Lowest 10% 52 1.7% 39 1.1% 10 0.9% each trait compared Below average 446 14.4% 387 11.3% 90 8.0% with the average Average 1685 54.5% 1871 54.8% 567 50.4% person your age: Above average 776 25.1% 936 27.4% 401 35.6% Computer skills Highest 10% 132 4.3% 182 5.3% 58 5.2% Total 3091 100.0% 3415 100.0% 1126 100.0% 27d. Rate yourself on Lowest 10% 2 0.1% 5 0.1% 1 0.1% each trait compared Below average 57 1.8% 64 1.9% 7 0.6% with the average Average 761 24.7% 948 27.8% 252 22.4% person your age: Above average 1615 52.4% 1761 51.6% 619 55.0% Cooperativeness Highest 10% 649 21.0% 638 18.7% 247 21.9% Total 3084 100.0% 3416 100.0% 1126 100.0% Office of Institutional Research 12 January 2009
- 13. Year 1999 2001 2008 Question Response Options Count Col % Count Col % Count Col % 27e. Rate yourself on Lowest 10% 29 0.9% 27 0.8% 10 0.9% each trait compared Below average 325 10.5% 319 9.3% 116 10.3% with the average Average 1152 37.3% 1269 37.2% 378 33.6% person your age: Above average 1151 37.2% 1273 37.3% 453 40.2% Creativity Highest 10% 434 14.0% 525 15.4% 169 15.0% Total 3091 100.0% 3413 100.0% 1126 100.0% 27f. Rate yourself on Lowest 10% 6 0.2% 5 0.1% 1 0.1% each trait compared Below average 97 3.1% 88 2.6% 25 2.2% with the average Average 892 28.9% 1023 29.9% 279 24.8% person your age: Above average 1400 45.3% 1485 43.5% 488 43.3% Drive to achieve Highest 10% 693 22.4% 815 23.9% 333 29.6% Total 3088 100.0% 3416 100.0% 1126 100.0% 27g. Rate yourself on Lowest 10% 29 0.9% 35 1.0% 9 0.8% each trait compared Below average 196 6.3% 260 7.6% 114 10.1% with the average Average 1307 42.3% 1535 45.0% 453 40.2% person your age: Above average 1107 35.9% 1136 33.3% 372 33.0% Emotional health Highest 10% 448 14.5% 448 13.1% 178 15.8% Total 3087 100.0% 3414 100.0% 1126 100.0% 27h. Rate yourself on Lowest 10% 16 0.5% 15 0.4% 9 0.8% each trait compared Below average 199 6.4% 258 7.6% 69 6.1% with the average Average 1020 33.0% 1193 35.0% 350 31.1% person your age: Above average 1252 40.5% 1323 38.8% 463 41.1% Leadership ability Highest 10% 606 19.6% 624 18.3% 235 20.9% Total 3093 100.0% 3413 100.0% 1126 100.0% 27i. Rate yourself on Lowest 10% 141 4.6% 157 4.6% 41 3.6% each trait compared Below average 685 22.2% 762 22.3% 217 19.3% with the average Average 1145 37.0% 1321 38.7% 428 38.0% person your age: Mathematical ability Above average 871 28.2% 892 26.1% 341 30.3% Highest 10% 249 8.1% 283 8.3% 99 8.8% Total 3091 100.0% 3415 100.0% 1126 100.0% 27j. Rate yourself on Lowest 10% 15 0.5% 12 0.4% 4 0.4% each trait compared Below average 173 5.6% 211 6.2% 90 8.0% with the average Average 1268 41.0% 1461 42.7% 463 41.1% person your age: Above average 1110 35.9% 1224 35.8% 376 33.4% Physical health Highest 10% 524 17.0% 510 14.9% 193 17.1% Total 3090 100.0% 3418 100.0% 1126 100.0% 27k. Rate yourself on Lowest 10% 30 1.0% 36 1.1% 17 1.5% each trait compared Below average 177 5.7% 236 6.9% 99 8.8% with the average Average 1606 52.1% 1771 51.9% 596 52.9% person your age: Above average 1056 34.3% 1116 32.7% 346 30.7% Popularity Highest 10% 213 6.9% 255 7.5% 68 6.0% Total 3082 100.0% 3414 100.0% 1126 100.0% Office of Institutional Research 13 January 2009
- 14. Year 1999 2001 2008 Question Response Options Count Col % Count Col % Count Col % 27l. Rate yourself on Lowest 10% 124 4.0% 130 3.8% 34 3.0% each trait compared Below average 660 21.4% 757 22.2% 224 19.9% with the average Average 1281 41.5% 1362 39.9% 445 39.5% person your age: Above average 776 25.1% 849 24.9% 310 27.5% Public speaking Highest 10% 248 8.0% 315 9.2% 113 10.0% ability Total 3089 100.0% 3413 100.0% 1126 100.0% 27m. Rate yourself on Lowest 10% 14 0.5% 18 0.5% 2 0.2% each trait compared Below average 170 5.5% 197 5.8% 87 7.7% with the average Average 1310 42.4% 1404 41.1% 435 38.7% person your age: Self‐confidence Above average 1208 39.1% 1373 40.2% 431 38.3% (intellectual) Highest 10% 385 12.5% 421 12.3% 170 15.1% Total 3087 100.0% 3413 100.0% 1125 100.0% 27n. Rate yourself on Lowest 10% 30 1.0% 40 1.2% 9 0.8% each trait compared Below average 330 10.7% 365 10.7% 152 13.5% with the average Average 1253 40.6% 1418 41.5% 428 38.0% person your age: Above average 1097 35.5% 1173 34.3% 400 35.6% Self‐confidence Highest 10% 378 12.2% 421 12.3% 136 12.1% (social) Total 3088 100.0% 3417 100.0% 1125 100.0% 27o. Rate yourself on Lowest 10% 10 0.3% 12 0.4% 3 0.3% each trait compared Below average 131 4.2% 173 5.1% 56 5.0% with the average Average 1462 47.4% 1654 48.5% 461 41.0% person your age: Above average 1133 36.7% 1187 34.8% 427 38.0% Self‐understanding Highest 10% 351 11.4% 383 11.2% 178 15.8% Total 3087 100.0% 3409 100.0% 1125 100.0% 27p. Rate yourself on Lowest 10% 88 2.9% 211 6.2% 58 5.2% each trait compared Below average 438 14.2% 504 14.8% 157 14.0% with the average Average 1407 45.7% 1573 46.2% 472 42.0% person your age: Above average 828 26.9% 842 24.7% 320 28.4% Spirituality Highest 10% 318 10.3% 276 8.1% 118 10.5% Total 3079 100.0% 3406 100.0% 1125 100.0% 27q. Rate yourself on Lowest 10% 5 0.2% 15 0.4% 1 0.1% each trait compared Below average 69 2.2% 89 2.6% 13 1.2% with the average Average 1042 33.8% 1238 36.3% 351 31.2% person your age: Understanding of Above average 1508 48.9% 1553 45.5% 540 48.0% others Highest 10% 463 15.0% 515 15.1% 221 19.6% Total 3087 100.0% 3410 100.0% 1126 100.0% 27r. Rate yourself on Lowest 10% 30 1.0% 34 1.0% 13 1.2% each trait compared Below average 321 10.4% 345 10.1% 119 10.6% with the average Average 1347 43.6% 1468 43.1% 473 42.0% person your age: Above average 1075 34.8% 1218 35.7% 387 34.4% Writing ability Highest 10% 316 10.2% 343 10.1% 134 11.9% Total 3089 100.0% 3408 100.0% 1126 100.0% Office of Institutional Research 14 January 2009
- 15. Year 1999 2001 2008 Question Response Options Count Col % Count Col % Count Col % 28a. Rate yourself on Lowest 10% 2 0.2% each trait compared Below average 27 2.4% with the average person your age: Average 388 34.4% Ability to see the NA NA Above average 482 42.8% world from someone else's Highest 10% 228 20.2% perspective Total 1127 100.0% 28b. Rate yourself on Lowest 10% 1 0.1% each trait compared Below average 26 2.3% with the average person your age: Average 293 26.0% Tolerance of others NA NA Above average 511 45.3% with different beliefs Highest 10% 296 26.3% Total 1127 100.0% 28c. Rate yourself on Lowest 10% 4 0.4% each trait compared Below average 74 6.6% with the average person your age: Average 395 35.0% Openness to having NA NA Above average 443 39.3% my own views challenged Highest 10% 211 18.7% Total 1127 100.0% 28d. Rate yourself on Lowest 10% 3 0.3% each trait compared with the average Below average 60 5.3% person your age: Average 376 33.4% Ability to discuss NA NA and negotiate Above average 442 39.3% controversial issues Highest 10% 245 21.8% Total 1126 100.0% 28e. Rate yourself on Below average 11 1.0% each trait compared with the average Average 261 23.2% person your age: Ability to work Above average NA NA 527 46.8% cooperatively with Highest 10% 328 29.1% diverse people Total 1127 100.0% Office of Institutional Research 15 January 2009
- 16. Year 1999 2001 2008 Question Response Options Count Col % Count Col % Count Col % 29a. Father's highest level Grammar school or less 53 1.7% 31 0.9% 10 0.9% of education Some high school 123 4.0% 128 3.8% 31 2.8% High school graduate 906 29.5% 986 29.1% 276 24.6% Postsecondary school 152 5.0% 152 4.5% 61 5.4% other than college Some college 607 19.8% 721 21.3% 223 19.9% College degree 824 26.9% 891 26.3% 334 29.7% Some graduate school 41 1.3% 38 1.1% 24 2.1% Graduate degree 362 11.8% 437 12.9% 164 14.6% Total 3068 100.0% 3384 100.0% 1123 100.0% 29b. Mother's highest Grammar school or less 50 1.6% 26 0.8% 3 0.3% level of education Some high school 71 2.3% 60 1.8% 20 1.8% High school graduate 1031 33.4% 1063 31.2% 253 22.5% Postsecondary school 120 3.9% 134 3.9% 53 4.7% other than college Some college 670 21.7% 801 23.5% 269 23.9% College degree 797 25.8% 909 26.7% 369 32.8% Some graduate school 61 2.0% 48 1.4% 23 2.0% Graduate degree 284 9.2% 362 10.6% 135 12.0% Total 3084 100.0% 3403 100.0% 1125 100.0% 30a. How often in the Not at all 32 2.8% past year have you: Occasionally 536 47.6% NA NA Ask questions in Frequently 559 49.6% class Total 1127 100.0% 30b. How often in the Not at all 33 2.9% past year have you: Occasionally 479 42.5% Support your NA NA opinions with a Frequently 614 54.5% logical argument Total 1126 100.0% 30c. How often in the Not at all 35 3.1% past year have you: Seek solutions to Occasionally 520 46.2% NA NA problems and Frequently 571 50.7% explain them to others Total 1126 100.0% 30d. How often in the Not at all 45 4.0% past year have you: Occasionally 487 43.3% Revise your papers NA NA to improve your Frequently 594 52.8% writing Total 1126 100.0% Office of Institutional Research 16 January 2009
- 17. Year 1999 2001 2008 Question Response Options Count Col % Count Col % Count Col % 30e. How often in the Not at all 36 3.2% past year have you: Evaluate the quality Occasionally 647 57.5% or reliability of NA NA information you Frequently 443 39.3% received Total 1126 100.0% 30f. How often in the Not at all 63 5.6% past year have you: Occasionally 601 53.4% Take a risk because NA NA you felt you had Frequently 461 41.0% more to gain Total 1125 100.0% 30g. How often in the Not at all 28 2.5% past year have you: Occasionally 599 53.2% Seek alternative NA NA solutions to a Frequently 499 44.3% problem Total 1126 100.0% 30h. How often in the Not at all 271 24.1% past year have you: Occasionally 630 56.0% NA NA Look up scientific Frequently 224 19.9% research articles and Total 1125 100.0% 30i. How often in the Not at all 192 17.1% past year have you: Explore topics on Occasionally 635 56.4% NA NA your own, even Frequently 299 26.6% though it was not required for a class Total 1126 100.0% 30j. How often in the Not at all 29 2.6% past year have you: Occasionally 532 47.2% Accept mistakes as NA NA part of the learning Frequently 565 50.2% process Total 1126 100.0% 30k. How often in the Not at all 53 4.7% past year have you: Occasionally 556 49.4% Seek feedback on NA NA your academic work Frequently 517 45.9% Total 1126 100.0% 30l. How often in the Not at all 14 1.2% past year have you: Occasionally 337 29.9% NA NA Take notes during Frequently 775 68.8% class Total 1126 100.0% Office of Institutional Research 17 January 2009