
Recomendados
Recomendados
Más contenido relacionado
Destacado
Destacado (13)
Más de DutchEmbassy
Más de DutchEmbassy (18)
Marjolein de-lange
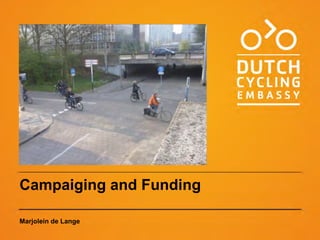
- 1. Campaiging and Funding Marjolein de Lange
- 2. Oudere plaatjes 1950’s and 1960’s: City building
- 3. 1950-1970 Spuistraat, Amsterdam More and more cars Congestion Road unsafety Parking problems
- 4. Safety and bicycle use 1975 - now: 1800 Development in time - Suburbanisation - Car use 50 1600 + Transport policy + Clean & Healthy 1400 40 Cycle fatalities per billion bicycle km 1200 Bicycle km pppy 1000 30 800 20 600 1950 –1975: • 400 - Suburbanisation - Car use 10 - Transport policy • 200 - Old fashioned • 0 0 1950 1955 1960 1965 1970 1975 1980 1985 1990 1995 2000 2005 ThinkBike workshop Washington Bicycle use Bicycle fatalities
- 5. Call for safety and liveability in many Dutch cities
- 6. The bicycle: The perfect vehicle in the city • clean • silent • affordable • healthy • saves energy • and
- 7. space
- 8. time Traffic lights at National Museum: ± 20 cars in 40 seconds > 50 cyclists in 10 seconds
- 9. Make cycling safe for all And easy and fast
- 10. From 1980’s The bicycle is taken more seriously: Local level: - cyclists groups - citizens call for safety, livable city and fewer cars - politicians follow - municipalities listen more to cyclists
- 11. Regional and national level - Bicycle Masterplan (1990): - examples - research - communication - design principles - Money for bicycle facilities: local and national - Parking of cars: parking fees are local taxes - Urban planning: - compact cities are good for cycling - urban sprawl is not
- 12. Safe, easy and fast Partial one-way street
- 13. Bicycle friendly speed hub
- 14. Short cuts for cyclists
- 15. Main roads: Through traffic 50 (or 70) km/h Seperate cycle paths
- 16. Safety and bicycle use 1975 - now: 1800 Development in time - Suburbanisation - Car use 50 1600 + Transport policy + Clean & Healthy 1400 40 Cycle fatalities per billion bicycle km 1200 Bicycle km pppy 1000 30 800 20 600 1950 –1975: • 400 - Suburbanisation - Car use 10 - Transport policy • 200 - Old fashioned • 0 0 1950 1955 1960 1965 1970 1975 1980 1985 1990 1995 2000 2005 ThinkBike workshop Washington Bicycle use Bicycle fatalities
- 17. Challenges Main roads with (too) many functions…
- 18. Challenges: Bicycle parking Longer distances Blue mopeds
- 19. The Dutch