The Energy Intelligence EI New Energy Green Utilities Report Infographic
•
0 recomendaciones•521 vistas

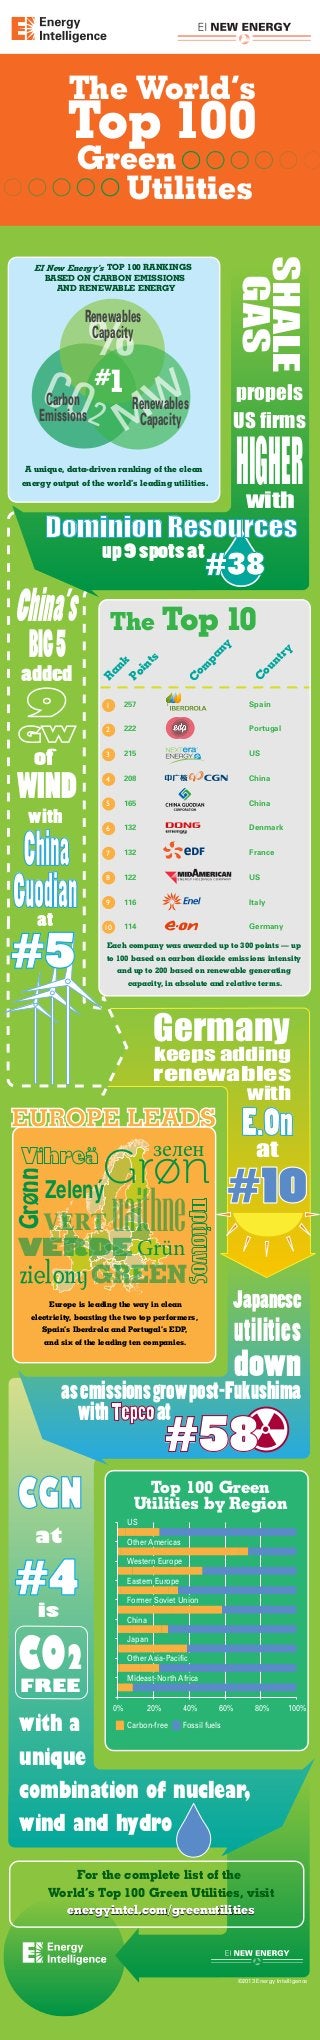
A unique ranking of the world's leading electric utilities based on their renewable energy portfolios and greenhouse gas emissions.
Recomendados

Recomendados
Más contenido relacionado
Más de Energy Intelligence
Más de Energy Intelligence (20)
Último
Último (20)
The Energy Intelligence EI New Energy Green Utilities Report Infographic
- 1. The World’s Top 100 Green Utilities SHALE GAS EI New Energy’s TOP 100 RANKINGS BASED ON CARBON EMISSIONS AND RENEWABLE ENERGY % #1 CO2 W M Renewables Capacity Carbon Emissions propels US firms Renewables Capacity HIGHER A unique, data-driven ranking of the clean energy output of the world’s leading utilities. with Dominion Resources up 9 spots at C ou n tr y ny C om pa ts Po in added nk BIG 5 The Top 10 Ra China’s #38 1 257 Spain 2 222 Portugal 3 215 US 4 208 China 5 165 China China Guodian 6 132 Denmark 7 132 France 8 122 US 9 116 Italy #5 10 114 Germany of WIND with at Each company was awarded up to 300 points — up to 100 based on carbon dioxide emissions intensity and up to 200 based on renewable generating capacity, in absolute and relative terms. Germany keeps adding renewables with E.On EUROPE LEADS at зелен Grønn Grøn #10 Zelený uaithne VERT VERDE Grün zielony GREEN Japanese Europe is leading the way in clean electricity, boasting the two top performers, utilities Spain’s Iberdrola and Portugal’s EDP, and six of the leading ten companies. down as emissions grow post-Fukushima with Tepco at #58 CGN Top 100 Green Utilities by Region US at Other Americas #4 Western Europe Eastern Europe Former Soviet Union is China CO2 Japan Other Asia-Pacific Mideast-North Africa FREE 0% 20% 40% 60% with a unique combination of nuclear, wind and hydro Carbon-free 80% 100% Fossil fuels For the complete list of the World’s Top 100 Green Utilities, visit energyintel.com/greenutilities ©2013 Energy Intelligence