Bathymetric Data Management
•
0 recomendaciones•1,015 vistas

Efficient workflow for comprehensive bathymetric data management

Recomendados
Más contenido relacionado
La actualidad más candente
La actualidad más candente (20)
Similar a Bathymetric Data Management
Similar a Bathymetric Data Management (20)
Más de Esri
Más de Esri (20)
Último
Último (20)
Bathymetric Data Management
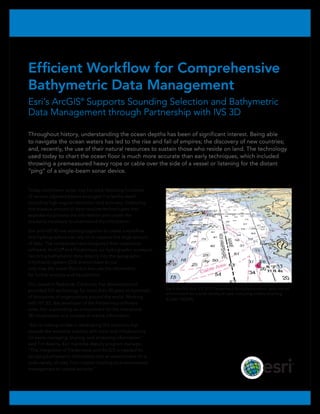
- 1. Efficient Workflow for Comprehensive Bathymetric Data Management Esri’s ArcGIS® Supports Sounding Selection and Bathymetric Data Management through Partnership with IVS 3D Throughout history, understanding the ocean depths has been of significant interest. Being able to navigate the ocean waters has led to the rise and fall of empires; the discovery of new countries; and, recently, the use of their natural resources to sustain those who reside on land. The technology used today to chart the ocean floor is much more accurate than early techniques, which included throwing a premeasured heavy rope or cable over the side of a vessel or listening for the distant “ping” of a single-beam sonar device. Today, multibeam sonar may be used, featuring hundreds of narrow, adjacent beams arranged in a fanlike swath, providing high angular resolution and accuracy. Capturing this massive amount of data requires technologies that expediently process the information and create the products necessary to understand the information. Esri and IVS 3D are working together to create a workflow that hydrographers can rely on to capture this large amount of data. The companies have integrated their respective software, ArcGIS® and Fledermaus, so hydrographic surveyors can bring bathymetric data directly into the geographic information system (GIS) environment to not only map the ocean floor but also use the information for further analysis and visualization. Esri, based in Redlands, California, has developed and Esri’s ArcGIS and IVS 3D’s Fledermaus bring bathymetric data into an provided GIS technology for more than 40 years to hundreds environment for a wide variety of uses, including coastal charting. of thousands of organizations around the world. Working (Credit: NOAA) with IVS 3D, the developer of the Fledermaus software suite, Esri is providing an environment for the interactive 3D visualization and analysis of marine information. “Esri is making strides in developing GIS solutions that provide the maritime industry with tools and infrastructure for easily managing, sharing, and accessing information,” said Tim Kearns, Esri maritime deputy program manager. “The integration of Fledermaus and ArcGIS is needed for bringing bathymetric information into an environment for a wide variety of uses, from coastal charting to environmental management to coastal security.”
- 2. GIS for Hydrographers Fledermaus is used internationally by government, commercial, and academic clients in all areas of ocean mapping. Scientists and engineers use the software for processing, quality control, and analysis of multibeam sonar and related data. Fledermaus provides significantly improved efficiency in nautical charting, geologic interpretation and assessment of seabed habitats, and identification of geohazards during engineering development work. Today, using a seamless workflow, Fledermaus software users can move bathymetric data from a traditional file-based desktop system directly into an ArcGIS geodatabase. They can then deploy the many capabilities of ArcGIS to analyze, author, and serve the data for charting and analysis. Using a bathymetric geodatabase brings many advantages to maritime GIS users. They can maintain a historical archive for comparing legacy survey data with modern data and updated charts. Bathymetric data can also be leveraged by using it with other databases for a wide range of purposes, such as oceanography, coastal zone management, and meteorology, that require seafloor information. In addition, users can easily edit their nautical products based on new and updated bathymetric information. Elevation surfaces and survey coverage extents created during editing in Fledermaus are easily transferred to a geodatabase for further analysis, charting, and delivery to clients. (Credit: Shallow Survey Conference 2001/2008 and NOAA)
- 3. “A majority of lidar products are created in ArcGIS formats, so the combination of ArcGIS and Fledermaus is great for our company,“ says Carol Lockhart, cofounder and commercial manager, Geomatics Data Solutions. “This integration allows us to further streamline our process to get from raw data to final product more seamlessly and efficiently than we could before.” Using ArcGIS, operators can identify areas of overlapping data to check for quality assurance. (Credit: Shallow Survey Conference 2001/2008 and NOAA) Creating Solutions Taking advantage of this integration is Geomatics Data Once created, the data can be viewed and edited in Solutions, a small organization with offices in British Fledermaus. Elevation surfaces and survey coverage Columbia, Canada, and San Diego, California. Focused on extents created during editing in Fledermaus are easily providing end-to-end geospatial processing applications for transferred to a geodatabase for further analysis, charting, organizations needing bathymetric data, the company takes and delivery to clients. For expedience as well as quality raw information and processes it to create final products such assurance issues, it is important to be able to do this in as nautical charts and geospatial databases. an automated way when dealing with datasets that span a large spatial and temporal extent. Geomatics Data Solutions uses Fledermaus and the company’s own add-on software solution, GreenC Solutions, Quality Assurance for bathymetric lidar data editing. Then, the data QA/QC Fledermaus and ArcGIS can be used for quality assurance team uses both Fledermaus and ArcGIS to process and and checking. All lidar projects are planned with some side analyze the data. overlap between adjacent flight lines to ensure accurate data collection. Using ArcGIS, operators can identify areas Geomatics Data Solutions uses ArcGIS and Fledermaus of overlapping data from adjacent lines, then do a statistical together in two important ways: comparison from one line’s surface to another. Geomatics Flight Line Editing Data Solutions uses either Fledermaus Cross Check or ArcGIS For areas of shoreline that are too shallow for traditional to compute the statistical comparison, depending on whether vessel-based technologies, airborne missions to collect a triangulated irregular network (TIN) or grid is used. flight lines are required. The acquired flight lines are stored in an ArcGIS geodatabase that also includes spatial areas defined as polygons to build custom Pure File Magic (PFM) files, the standard data structure developed at the U.S. Naval Oceanographic Office, for data editing. The polygons are used to define the PFM extent, and the flight lines identify which files need to be read to import data to the PFM.
- 4. Opening the Doors to a Marine Spatial Data Infrastructure “The very large volume of many of the oceanographic and bathymetric datasets makes export and import between software applications inefficient and prone to inaccuracies, and the partnership with Esri provides our clients—many of whom are ArcGIS users—with a seamless connection to the power of an enterprise GIS,” notes IVS 3D’s general manager Lindsay Gee. “This has benefits for many additional geoprocessing features and off-the-shelf tools for publishing products and distribution. Many governments around the world have recognized the benefits of establishing a national spatial data infrastructure, and our integration with ArcGIS allows clients in the marine environment Esri’s bathymetric information system will to be directly part of a national digital geospatial framework without support cloud computing mapping services via a maritime ArcGIS application and tools the need to build complicated connections between the marine and for updating navigational products. national SDIs.” (Credit: Shallow Survey Conference 2001/2008) Fledermaus software is valuable to bathymetric geodatabase design within the development of Esri’s bathymetric information system. This system is composed of a data model that helps users organize bathymetric and survey data and communicate with other data models such as Esri® Nautical Solution, Arc Marine, petroleum, and pipeline. Esri’s bathymetric information system will support cloud computing mapping services via a maritime ArcGIS application and tools for updating navigational products. For more information on Esri and how its GIS software is used in the hydrographic community, contact bathymetry@esri.com or visit esri.com/maritime. For more information, For more information on IVS 3D and how its call Esri at visualization and analysis software is used in 1-800-447-9778. the nautical industry, contact Lindsay Gee at Send e-mail inquiries to info@ivs3d.com or visit ivs3d.com. info@esri.com. For more information on Geomatics Visit Esri’s web page at Data Solutions, contact Carol Lockhart esri.com. at info@GeomaticsDS.com or visit GeomaticsDataSolutions.com. Copyright © 2011 Esri. All rights reserved. Esri, the Esri globe logo, ArcGIS, @esri.com, and esri.com are trademarks, registered trademarks, or service marks of Esri in the United States, the European Community, or certain other jurisdictions. Other companies and products mentioned herein may be trademarks or registered trademarks of their respective trademark owners. G47740ESRIxxC4/11gm