Urban Ag Scope (concept)
•
1 recomendación•254 vistas

A concept for an agricultural macroscope design to help monitor and make more efficient the global agricultural system.

Recomendados
Recomendados
Más contenido relacionado
La actualidad más candente
La actualidad más candente (20)
Similar a Urban Ag Scope (concept)
Similar a Urban Ag Scope (concept) (20)
Más de Kelly Kokaisel
Más de Kelly Kokaisel (20)
Urban Ag Scope (concept)
- 1. A Macroscopic Agriculture Design
- 2. #1: Visualize small scale, urban agriculture as part of its global system. #2: Integrate relevant current data to reveal global patterns. #3: Integrate relevant historical data to reveal global narrative. #4: Reveal personal impact to increase personal commitment. #5: Use AgScope as a tool to influence planning and implementation.
- 3. Weather Quality Policy Trade Astronomy Visualize small scale, urban agriculture as part of its global system. In 2007, the UN Food and Agriculture Organization asserted that a global agriculture monitoring strategy needs to be implemented in order to mitigate increasing malnutrition problems in the face of population growth and other food resource issues related to the UN’s Millennium Development Goals [2]. ‘A number of global trends suggest an urgent need for a comprehensive, systematic and accurate global agricultural monitoring system. More frequent extreme climate events such as floods, drought and frosts are adversely affecting agricultural production worldwide. The risk of food supply disruptions continues to grow as the earth continues to respond to pressures such as climate change, increasing energy needs, and population growth, on the land that sustains us. Understanding and monitoring global agriculture production is essential to combat both short-term and long-term threats to stable and reliable access to food for all’ [1]. The AgScope Biodome will integrate relevant global data into its monitoring and analysis program to help individual and community farmers understand their true place in the global agriculture system. Such data includes: • Global satellite information, including weather and astronomy. • Global land survey information, including oceanographic data and built environment development information. • National and foreign related government policy data and changes. • WTO and NAFTA import/export data. • Contamination and disease outbreak information.
- 4. Integrate relevant current data to reveal global patterns. Astronomy • Precession Weather Systems • Solar waves • Forecasts • Planetary alignment • Rainfall • Anomalies & new discoveries • Dew Point • Lunar phases • Barometer • Humidity Trade • Sunrise & Sunset • Import/export prices • Wind • Fair trade data • Evaopotransporation • Stock prices Quality Policy • Contamination warnings • Laws • Disease warnings • Regulations • Fertilizer and pesticide effectiveness • Treaties and Protocols
- 5. Integrate relevant historical data to reveal global narrative. Economic Data • Industry sector by GDP • Supply/demand data People Social Data • Information on health, jobs, and education trends • Finance and lending data Planet Profit • Energy resource information. Environmental Data • Weather impacts on crop seasons • Soil health • Water availability
- 6. Reveal personal impact to increase personal commitment. Personal Carbon Footprint • Compared to global carbon footprint Personal Water Footprint • Compared to global water footprint Personal Contribution to Demand • Needs being met Food Miles • Where your food is going
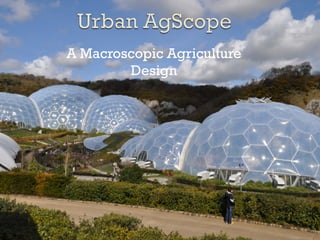
- 7. All of this data is compiled from monitoring systems around the world and integrated into the AgScope Biodomes. These biodomes are used by communities on a local level to determine strategy and implementation in regards to crop cycles, genetic selection, irrigation systems, and quantity decisions.
- 8. [1] Earthobservations.org | http://www.earthobservations.org/cop_ag_gams.shtml [2] UN.org | http://www.un.org/millenniumgoals/ [3] FAS.USDA.gov | http://www.fas.usda.gov/info/factsheets/reports.asp [4] https://learn.mcad.edu/@@/9FF3C12C462117DF3B56545FDB1543E1/courses/1/S DHS-3316-10- F10/content/_143797_1/5GOALS_WholeSystemsMacroscope_DeVarco.pdf [5] Buckminster Fuller, Your Private Sky, 1999 [6] Chris Zelov, Design Outlaws on the Ecological Frontier, 2001 [7] https://learn.mcad.edu/@@/9FF3C12C462117DF3B56545FDB1543E1/courses/1/S DHS-3316-10-F10/content/_143796_1/WDSD4_Excerpt_Geoscope_1.pdf
- 9. Kelly Kokaisel Design Rules Fall 2010