SlideShare una empresa de Scribd logo
1 de 13
Descargar para leer sin conexión
Monthly Indicators
A RESEARCH TOOL PROVIDED BY THE GREATER BOSTON ASSOCIATION OF REALTORS®


December 2012                                                                                                                   Quick Facts
It was largely a year of recovery for housing across our nation. Markets resolved
to shed their excess weight, appeal to both existing homeowners and renters
                                                                                                                                   + 14.5%                          + 11.8%                          + 17.5%
alike, and learn to play nicer with banks. Hey, three for three isn't too bad. But                                                  Year-Over-Year                  Year-Over-Year                   Year-Over-Year
there's more work to be done. Here's how the final month of 2012 finished up.                                                       (YoY) Change in                 (YoY) Change in                  (YoY) Change in
                                                                                                                                     Closed Sales                    Closed Sales                     Closed Sales
New Listings in the Greater Boston region were down 20.0 percent for detached                                                         All Properties               Single-Family Only               Condominium Only

homes and 19.3 percent for condominiums. Closed Sales increased 11.8
percent for detached homes and 17.5 percent for condominiums.
                                                                                                                               Single-Family Market Overview                                                                 2
The Median Sales Price was up 6.8 percent to $470,000 for single-family                                                        Condominium Market Overview                                                                   3
properties and 10.3 percent to $380,000 for condominiums. Months Supply of
Inventory decreased 44.0 percent for single-family units and 52.7 percent for
                                                                                                                               Closed Sales                                                                                  4
townhouse-condo units.                                                                                                         Median Sales Price                                                                            5
                                                                                                                               Housing Affordability Index                                                                   6
Economic growth is on an upward trend and several prominent housing indices
continue to showcase market turnaround. Momentum is on our side, though it
                                                                                                                               Inventory of Homes for Sale                                                                   7
won't necessarily be fast, consistent or universal. But after five or six                                                      Months Supply of Inventory                                                                    8
challenging years, it's a welcomed change of pace. Plenty of opportunity lies                                                  Days On Market Until Sale                                                                     9
ahead. Here's to a healthy and prosperous year!
                                                                                                                               Percent of Original List Price Received                                                      10
                                                                                                                               Pending Sales                                                                                11
                                                                                                                               New Listings                                                                                 12
                                                                                                                               City of Boston Overview                                                                      13
                                                                                                                               Click on desired metric to jump to that page.


                                                 Data is refreshed regularly to capture changes in market activity so figures shown may be different than previously reported. Current as of January 16, 2013. All data from MLS Property
                                                      Information Network, Inc. Provided by Greater Boston Association of REALTORS® and the Massachusetts Association of REALTORS®. Powered by 10K Research and Marketing.
Single-Family Market Overview
Key market metrics for the current month and year-to-date figures for Single-Family Homes Only.


 Key Metrics                                            Historical Sparklines                                                            Dec-2011 Dec-2012                      +/–            YTD 2011 YTD 2012                      +/–


 Closed Sales                                                                                                                                745               833            + 11.8%             9,069            10,886           + 20.0%
                                                       12-2009                 12-2010                12-2011                 12-2012


 Median Sales Price                                                                                                                      $440,000          $470,000            + 6.8%          $450,000          $457,500            + 1.7%
                                                       12-2009                 12-2010                12-2011                 12-2012


 Housing Affordability Index                                                                                                                 104               108             + 3.5%              102               110             + 8.0%
                                                       12-2009                 12-2010                12-2011                 12-2012


 Inventory of Homes for Sale                                                                                                                3,669             2,296           - 37.4%                --                --                --
                                                       12-2009                 12-2010                12-2011                 12-2012


 Months Supply of Inventory                                                                                                                   4.9               2.8           - 44.0%                --                --                --
                                                       12-2009                 12-2010                12-2011                 12-2012


 Days on Market Until Sale                                                                                                                   112                98            - 12.8%              104                98             - 5.9%
                                                       12-2009                 12-2010                12-2011                 12-2012


 Percent of Original
                                                                                                                                           92.1%             94.2%             + 2.3%            93.1%             94.4%             + 1.4%
 List Price Received
                                                       12-2009                 12-2010                12-2011                 12-2012


 Pending Sales                                                                                                                               570               624             + 9.5%             9,181            11,101           + 20.9%
                                                       12-2009                 12-2010                12-2011                 12-2012


 New Listings                                                                                                                                459               367            - 20.0%            15,386            14,926            - 3.0%
                                                       12-2009                 12-2010                12-2011                 12-2012


                     All data from MLS Property Information Network, Inc. Provided by the Greater Boston Association of REALTORS® and the Massachusetts Association of REALTORS®. Powered by 10K Research and Marketing. | Click for Cover Page | 2
Condominium Market Overview
Key market metrics for the current month and year-to-date figures for Condominium Properties Only.


 Key Metrics                                            Historical Sparklines                                                            Dec-2011 Dec-2012                      +/–            YTD 2011 YTD 2012                      +/–


 Closed Sales                                                                                                                                645               758            + 17.5%             7,941             9,680           + 21.9%
                                                       12-2009                 12-2010                12-2011                 12-2012


 Median Sales Price                                                                                                                      $344,500          $380,000           + 10.3%          $359,011          $379,000            + 5.6%
                                                       12-2009                 12-2010                12-2011                 12-2012


 Housing Affordability Index                                                                                                                 130               131             + 0.6%              125               131             + 4.4%
                                                       12-2009                 12-2010                12-2011                 12-2012


 Inventory of Homes for Sale                                                                                                                2,819             1,568           - 44.4%                --                --                --
                                                       12-2009                 12-2010                12-2011                 12-2012


 Months Supply of Inventory                                                                                                                   4.4               2.1           - 52.7%                --                --                --
                                                       12-2009                 12-2010                12-2011                 12-2012


 Days on Market Until Sale                                                                                                                   120                84            - 30.4%              105                87            - 17.8%
                                                       12-2009                 12-2010                12-2011                 12-2012


 Percent of Original
                                                                                                                                           93.0%             96.2%             + 3.4%            94.0%             95.8%             + 2.0%
 List Price Received
                                                       12-2009                 12-2010                12-2011                 12-2012


 Pending Sales                                                                                                                               471               515             + 9.3%             7,967             9,882           + 24.0%
                                                       12-2009                 12-2010                12-2011                 12-2012


 New Listings                                                                                                                                389               314            - 19.3%            13,649            12,511            - 8.3%
                                                       12-2009                 12-2010                12-2011                 12-2012


                     All data from MLS Property Information Network, Inc. Provided by the Greater Boston Association of REALTORS® and the Massachusetts Association of REALTORS®. Powered by 10K Research and Marketing. | Click for Cover Page | 3
Closed Sales
A count of the actual sales that have closed in a given month.


December                                                                     Year to Date                                                                                            Single-Family
                                                                                                                                                                                                          YoY
                                                                                                                                                                                                         Change
                                                                                                                                                                                                                      Condominium
                                                                                                                                                                                                                                           YoY
                                                                                                                                                                                                                                          Change

                                                                                                                                                                    Jan-2012               526          + 12.6%             414           + 3.0%
                       833                                                                            10,886                                                        Feb-2012               474          + 33.5%             385          + 12.2%
        736    745                                          758
                                                                                                                                            9,680                   Mar-2012               657          + 16.5%             608          + 10.9%
                                                                                  9,149 9,069
                                       655        645                                                                                                               Apr-2012               752          + 12.1%             759          + 19.7%
                                                                                                                       8,306
                                                                                                                                 7,941
                                                                                                                                                                    May-2012              1,017         + 20.4%            1,013         + 32.1%
                                                                                                                                                                    Jun-2012              1,529         + 21.4%            1,270         + 20.2%
                                                                                                                                                                    Jul-2012              1,293         + 25.4%            1,041         + 21.8%
                                                                                                                                                                    Aug-2012              1,316         + 26.7%            1,206         + 24.7%
                                                                                                                                                                    Sep-2012               773           - 1.4%             754          + 16.4%
                                                                                                                                                                    Oct-2012               798          + 28.9%             712          + 38.8%
                                                                                                                                                                    Nov-2012               918          + 33.0%             760          + 35.2%
        2010   2011     2012            2010      2011       2012                  2010       2011      2012            2010       2011       2012
                                                                                                                                                                    Dec-2012               833          + 11.8%             758          + 17.5%
               +1.2%   +11.8%                     -1.5%    +17.5%                            -0.9%    +20.0%                       -4.4%    +21.9%
                                                                                                                                                                    Total                10,886         + 20.0%            9,680         + 21.9%
          Single-Family                   Condominium                                 Single-Family                        Condominium


Historical Closed Sales Activity                                                                                                                                            Single-Family                        Condominium
1,800

1,600

1,400

1,200

1,000

 800

 600

 400

 200
  Jan-2003             Jan-2004                Jan-2005               Jan-2006               Jan-2007                Jan-2008                Jan-2009               Jan-2010                Jan-2011                Jan-2012


                        All data from MLS Property Information Network, Inc. Provided by the Greater Boston Association of REALTORS® and the Massachusetts Association of REALTORS®. Powered by 10K Research and Marketing. | Click for Cover Page | 4
Median Sales Price
Median price point for all closed sales, not accounting for seller concessions, in a given month.


December                                                                      Year to Date                                                                                            Single-Family
                                                                                                                                                                                                           YoY
                                                                                                                                                                                                          Change
                                                                                                                                                                                                                       Condominium
                                                                                                                                                                                                                                            YoY
                                                                                                                                                                                                                                           Change

                                                                                                                                                                     Jan-2012           $405,000          - 9.0%         $350,000           - 1.7%
                        $470,000
                                                                                  $450,000 $450,000 $457,500                                                         Feb-2012           $391,875          + 3.4%         $371,000          + 6.6%
   $435,000 $440,000
                                                                                                                                                                     Mar-2012           $411,000          - 1.3%         $340,000          + 4.8%
                                                            $380,000                                                                         $379,000
                                      $355,000                                                                         $349,900 $359,011                             Apr-2012           $414,850          - 3.3%         $370,750          + 5.0%
                                                 $344,500
                                                                                                                                                                     May-2012           $465,000          + 1.3%         $381,000          + 4.4%
                                                                                                                                                                     Jun-2012           $500,000          - 0.2%         $400,000          + 6.7%
                                                                                                                                                                     Jul-2012           $510,000          + 2.2%         $387,000          + 6.3%
                                                                                                                                                                     Aug-2012           $489,450          - 1.9%         $380,000          + 3.5%
                                                                                                                                                                     Sep-2012           $430,000          - 4.3%         $375,000          + 2.0%
                                                                                                                                                                     Oct-2012           $429,000         + 10.0%         $365,883          + 4.8%
                                                                                                                                                                     Nov-2012           $445,550          + 5.3%         $380,000          + 8.4%
     2010        2011    2012           2010       2011       2012                  2010       2011      2012            2010       2011       2012
                                                                                                                                                                     Dec-2012           $470,000          + 6.8%         $380,000         + 10.3%
             +1.1%      +6.8%                      -3.0%     +10.3%                            0.0%     +1.7%                      +2.6%      +5.6%
                                                                                                                                                                     Median             $457,500          + 1.7%         $379,000          + 5.6%
       Single-Family                       Condominium                                 Single-Family                        Condominium


Historical Median Sales Price                                                                                                                                                 Single-Family                        Condominium
$550,000


$500,000


$450,000


$400,000


$350,000


$300,000


$250,000
      Jan-2003             Jan-2004               Jan-2005               Jan-2006               Jan-2007               Jan-2008               Jan-2009               Jan-2010               Jan-2011               Jan-2012


                         All data from MLS Property Information Network, Inc. Provided by the Greater Boston Association of REALTORS® and the Massachusetts Association of REALTORS®. Powered by 10K Research and Marketing. | Click for Cover Page | 5
Housing Affordability Index
This index measures housing affordability for the region. An index of 120 means the median household income was 120% of what is necessary
to qualify for the median-priced home under prevailing interest rates. A higher number means greater affordability.


December                                                                  Year to Date                                                                                            Single-Family
                                                                                                                                                                                                       YoY
                                                                                                                                                                                                      Change
                                                                                                                                                                                                                   Condominium
                                                                                                                                                                                                                                        YoY
                                                                                                                                                                                                                                       Change
                                               130        131                                                                             131
                                                                                                                                125                              Jan-2012               113          + 17.4%             129           + 9.3%
                                    118                                                                              120
                                                                                                                                                                 Feb-2012               119           + 7.9%             125           + 4.9%
                     108                                                                             110
             104                                                                          102                                                                    Mar-2012               114          + 11.5%             135           + 5.6%
      98                                                                         95
                                                                                                                                                                 Apr-2012               112          + 13.1%             124           + 4.8%
                                                                                                                                                                 May-2012               102           + 7.2%             122           + 4.2%
                                                                                                                                                                 Jun-2012               97            + 8.5%             118           + 1.9%
                                                                                                                                                                 Jul-2012               96            + 7.9%             124           + 3.9%
                                                                                                                                                                 Aug-2012               100          + 11.0%             127           + 5.5%
                                                                                                                                                                 Sep-2012               116          + 15.2%             131           + 8.5%
                                                                                                                                                                 Oct-2012               115           - 0.4%             133           + 4.1%
                                                                                                                                                                 Nov-2012               112           + 4.1%             129           + 1.4%
      2010   2011    2012           2010       2011       2012                  2010       2011      2012            2010       2011       2012
                                                                                                                                                                 Dec-2012               108           + 3.5%             131           + 0.6%
             +5.9%   +3.5%                    +9.9%      +0.6%                            +7.0%      +8.0%                     +4.8%      +4.4%
                                                                                                                                                                 Average                109           +8.9%              127            +4.6%
        Single-Family                  Condominium                                 Single-Family                        Condominium


Historical Housing Affordability Index                                                                                                                                Single-Family                          Condominium
140

130

120

110

100

 90

 80

 70

 60
 Jan-2004            Jan-2005                  Jan-2006                   Jan-2007                  Jan-2008                  Jan-2009                   Jan-2010                  Jan-2011                   Jan-2012


                     All data from MLS Property Information Network, Inc. Provided by the Greater Boston Association of REALTORS® and the Massachusetts Association of REALTORS®. Powered by 10K Research and Marketing. | Click for Cover Page | 6
Inventory of Homes for Sale
The number of properties available for sale in active status at the end of a given month.


December                                                                                                                                                                            Single-Family
                                                                                                                                                                                                         YoY
                                                                                                                                                                                                        Change
                                                                                                                                                                                                                     Condominium
                                                                                                                                                                                                                                          YoY
                                                                                                                                                                                                                                         Change

                                                                                                                                                                   Jan-2012              3,708          - 2.4%            2,979          - 19.1%
              3,769              3,669                                                  3,546                                                                      Feb-2012              4,100          + 6.7%            3,270          - 16.5%
                                                                                                                                                                   Mar-2012              4,726          + 2.1%            3,700          - 21.1%
                                                                                                             2,819                                                 Apr-2012              5,074          - 4.7%            3,854          - 25.7%
                                                                                                                                                                   May-2012              5,178          - 9.7%            3,666          - 29.8%
                                                    2,296
                                                                                                                                                                   Jun-2012              4,857          - 15.3%           3,395          - 33.4%
                                                                                                                                                                   Jul-2012              4,423          - 21.0%           3,128          - 33.7%
                                                                                                                                 1,568
                                                                                                                                                                   Aug-2012              4,049          - 24.7%           2,716          - 35.6%
                                                                                                                                                                   Sep-2012              4,244          - 24.8%           2,831          - 34.6%
                                                                                                                                                                   Oct-2012              3,910          - 27.9%           2,585          - 37.0%
                                                                                                                                                                   Nov-2012              3,218          - 30.2%           2,155          - 40.1%
              2010               2011                2012                                 2010                2011                 2012                            Dec-2012              2,296          - 37.4%           1,568          - 44.4%
                             -2.7%                 -37.4%                                                 -20.5%                -44.4%                             Average               4,149          - 16.2%           2,987          - 30.5%
                          Single-Family                                                                Condominium


Historical Inventory of Homes for Sale                                                                                                                                     Single-Family                         Condominium
9,000

8,000

7,000

6,000

5,000

4,000

3,000

2,000

1,000
   Jan-2003           Jan-2004               Jan-2005               Jan-2006                Jan-2007               Jan-2008                Jan-2009               Jan-2010                Jan-2011               Jan-2012


                       All data from MLS Property Information Network, Inc. Provided by the Greater Boston Association of REALTORS® and the Massachusetts Association of REALTORS®. Powered by 10K Research and Marketing. | Click for Cover Page | 7
Months Supply of Inventory
The inventory of homes for sale at the end of a given month, divided by the average monthly pending sales from the last 12 months.


December                                                                                                                                                                          Single-Family
                                                                                                                                                                                                       YoY
                                                                                                                                                                                                      Change
                                                                                                                                                                                                                   Condominium
                                                                                                                                                                                                                                        YoY
                                                                                                                                                                                                                                       Change

                                                                                        5.4                                                                      Jan-2012               7.0           - 13.4%            7.2           - 21.4%
             5.1
                                4.9                                                                                                                              Feb-2012               8.6           - 20.1%            8.5           - 25.6%
                                                                                                             4.4                                                 Mar-2012               7.2           - 12.4%            6.1           - 28.9%
                                                                                                                                                                 Apr-2012               6.7           - 14.9%            5.1           - 37.9%
                                                                                                                                                                 May-2012               5.1           - 25.0%            3.6           - 46.9%
                                                                                                                                                                 Jun-2012               3.2           - 30.2%            2.7           - 44.6%
                                                    2.8
                                                                                                                                                                 Jul-2012               3.4           - 37.0%            3.0           - 45.5%
                                                                                                                                 2.1
                                                                                                                                                                 Aug-2012               3.1           - 40.5%            2.3           - 48.4%
                                                                                                                                                                 Sep-2012               5.5           - 23.8%            3.8           - 43.8%
                                                                                                                                                                 Oct-2012               4.9           - 44.1%            3.6           - 54.6%
                                                                                                                                                                 Nov-2012               3.5           - 47.5%            2.8           - 55.7%
             2010             2011                 2012                                 2010                2011                2012                             Dec-2012               2.8           - 44.0%            2.1           - 52.7%
                            -3.8%                -44.0%                                                -19.3%                 -52.7%                             Average                5.0           - 24.2%            4.2           - 36.5%
                        Single-Family                                                                Condominium


Historical Months Supply of Inventory                                                                                                                                 Single-Family                          Condominium
14


12


10


 8


 6


 4


 2
Jan-2004             Jan-2005                  Jan-2006                   Jan-2007                  Jan-2008                   Jan-2009                  Jan-2010                   Jan-2011                  Jan-2012


                     All data from MLS Property Information Network, Inc. Provided by the Greater Boston Association of REALTORS® and the Massachusetts Association of REALTORS®. Powered by 10K Research and Marketing. | Click for Cover Page | 8
Days on Market Until Sale
Average number of days between when a property is listed and when an offer is accepted in a given month.


December                                                                   Year to Date                                                                                            Single-Family
                                                                                                                                                                                                        YoY
                                                                                                                                                                                                       Change
                                                                                                                                                                                                                    Condominium
                                                                                                                                                                                                                                         YoY
                                                                                                                                                                                                                                        Change

                                                                                                                                                                  Jan-2012               130          + 15.0%             124            - 5.0%

                                                                                                                                 105                              Feb-2012               134           + 2.9%             123            - 9.8%
                                                120                                        104                        102
      113    112                                                                  95                   98                                                         Mar-2012               131           - 3.1%             118            - 4.2%
                                     107
                       98                                                                                                                   87                    Apr-2012               120           - 1.4%              98           - 16.9%

                                                           84                                                                                                     May-2012               96            - 6.4%              86           - 12.0%
                                                                                                                                                                  Jun-2012               90            - 0.1%              75           - 19.5%
                                                                                                                                                                  Jul-2012               81            - 4.5%              71           - 20.6%
                                                                                                                                                                  Aug-2012               88            - 5.4%              76           - 18.3%
                                                                                                                                                                  Sep-2012               89            - 12.1%             85           - 18.0%
                                                                                                                                                                  Oct-2012               91            - 16.4%             84           - 11.6%
                                                                                                                                                                  Nov-2012               90            - 17.7%             76           - 30.5%
      2010   2011     2012           2010       2011      2012                   2010      2011       2012            2010       2011      2012
                                                                                                                                                                  Dec-2012               98            - 12.8%             84           - 30.4%
             -0.3%   -12.8%                    +11.8%    -30.4%                            +9.6%      -5.9%                     +3.3%     -17.8%
                                                                                                                                                                  Total                  98            - 5.9%              80           - 16.2%
        Single-Family                   Condominium                                 Single-Family                        Condominium


Historical Days on Market Until Sale                                                                                                                                      Single-Family                        Condominium
160


140


120


100


 80


 60


 40
 Jan-2003            Jan-2004               Jan-2005               Jan-2006               Jan-2007                Jan-2008                Jan-2009                Jan-2010               Jan-2011                Jan-2012


                      All data from MLS Property Information Network, Inc. Provided by the Greater Boston Association of REALTORS® and the Massachusetts Association of REALTORS®. Powered by 10K Research and Marketing. | Click for Cover Page | 9
Percent of Original List Price Received
Percentage found when dividing a property’s sales price by its original list price, then taking the average for all properties sold in a given month,
not accounting for seller concessions.


December                                                                    Year to Date                                                                                            Single-Family
                                                                                                                                                                                                         YoY
                                                                                                                                                                                                        Change
                                                                                                                                                                                                                     Condominium
                                                                                                                                                                                                                                          YoY
                                                                                                                                                                                                                                         Change

                                                                                                                                                                   Jan-2012             90.5%           - 0.4%           92.8%           + 0.5%
                                                                                                                                                                   Feb-2012             91.2%           + 0.3%           93.4%           + 1.5%
                                                          96.2%                                                       94.4% 94.0% 95.8%                            Mar-2012             93.0%           + 0.8%           94.0%           + 0.9%
    91.3% 92.1% 94.2%                93.0% 93.0%                                93.6% 93.1% 94.4%
                                                                                                                                                                   Apr-2012             93.5%           + 0.9%           95.7%           + 2.0%
                                                                                                                                                                   May-2012             95.4%           + 1.2%           96.1%           + 1.0%
                                                                                                                                                                   Jun-2012             95.3%           + 0.8%           96.3%           + 1.7%
                                                                                                                                                                   Jul-2012             95.7%           + 1.5%           96.6%           + 1.7%
                                                                                                                                                                   Aug-2012             94.8%           + 1.5%           96.2%           + 2.2%
                                                                                                                                                                   Sep-2012             94.5%           + 1.5%           96.4%           + 2.4%
                                                                                                                                                                   Oct-2012             94.3%           + 2.8%           95.9%           + 2.4%
                                                                                                                                                                   Nov-2012             94.6%           + 2.3%           96.2%           + 2.5%
      2010    2011     2012            2010       2011      2012                  2010       2011      2012            2010       2011       2012
                                                                                                                                                                   Dec-2012             94.2%           + 2.3%           96.2%           + 3.4%
             +1.0%   +2.3%                        +0.1%    +3.4%                            -0.6%      +1.4%                      -0.4%     +2.0%
                                                                                                                                                                   Average              94.4%           + 1.4%           95.8%           + 2.0%
        Single-Family                    Condominium                                 Single-Family                        Condominium


Historical Percent of Original List Price Received                                                                                                                          Single-Family                        Condominium
99%

98%

97%

96%

95%

94%

93%

92%

91%

90%

89%
  Jan-2003           Jan-2004                 Jan-2005             Jan-2006               Jan-2007               Jan-2008                 Jan-2009             Jan-2010                Jan-2011               Jan-2012


                      All data from MLS Property Information Network, Inc. Provided by the Greater Boston Association of REALTORS® and the Massachusetts Association of REALTORS®. Powered by 10K Research and Marketing. | Click for Cover Page | 10
Pending Sales
A count of the properties in UAG status between the first and last day in a given month, regardless of current status (based on Off Market Date).


December                                                                     Year to Date                                                                                            Single-Family
                                                                                                                                                                                                          YoY
                                                                                                                                                                                                         Change
                                                                                                                                                                                                                      Condominium
                                                                                                                                                                                                                                           YoY
                                                                                                                                                                                                                                          Change

                                                                                                                                                                    Jan-2012               545          + 26.7%             484          + 18.6%
                                                                                                      11,101
                       624                                                                                                                                          Feb-2012               652          + 23.3%             635          + 24.0%
               570                                                                                                                          9,882                   Mar-2012               994          + 24.6%            1,012         + 32.3%
        542                                                                       9,132 9,181
                                                            515                                                                                                     Apr-2012              1,153         + 21.8%            1,049         + 24.3%
                                                  471                                                                  8,200 7,967
                                       442                                                                                                                          May-2012              1,339         + 23.1%            1,268         + 28.9%
                                                                                                                                                                    Jun-2012              1,269         + 13.4%            1,047         + 19.5%
                                                                                                                                                                    Jul-2012              1,057         + 26.6%             835           + 9.4%
                                                                                                                                                                    Aug-2012               912          + 18.0%             821          + 22.5%
                                                                                                                                                                    Sep-2012               855          + 28.8%             720          + 39.0%
                                                                                                                                                                    Oct-2012               896          + 20.4%             823          + 38.8%
                                                                                                                                                                    Nov-2012               805          + 17.7%             673          + 19.5%
        2010   2011     2012           2010       2011       2012                  2010       2011      2012            2010       2011       2012
                                                                                                                                                                    Dec-2012               624           + 9.5%             515           + 9.3%
               +5.2%   +9.5%                      +6.6%     +9.3%                            +0.5%     +20.9%                     -2.8%     +24.0%
                                                                                                                                                                    Total                11,101         + 20.9%            9,882         + 24.0%
          Single-Family                   Condominium                                 Single-Family                        Condominium


Historical Pending Sales Activity                                                                                                                                           Single-Family                        Condominium
1,400


1,200


1,000


 800


 600


 400


 200
  Jan-2003             Jan-2004               Jan-2005                Jan-2006               Jan-2007                Jan-2008                Jan-2009               Jan-2010                Jan-2011                Jan-2012


                       All data from MLS Property Information Network, Inc. Provided by the Greater Boston Association of REALTORS® and the Massachusetts Association of REALTORS®. Powered by 10K Research and Marketing. | Click for Cover Page | 11
New Listings
A count of the properties that have been newly listed on the market in a given month.


December                                                                     Year to Date                                                                                            Single-Family
                                                                                                                                                                                                          YoY
                                                                                                                                                                                                         Change
                                                                                                                                                                                                                      Condominium
                                                                                                                                                                                                                                           YoY
                                                                                                                                                                                                                                          Change

                                                                                                                                                                    Jan-2012               975          + 14.4%             958            - 1.8%

                                                                                 15,859 15,386                        15,937                                        Feb-2012              1,336         + 51.3%            1,145          + 5.8%
                                       489                                                     14,926                                                               Mar-2012              2,023          + 3.1%            1,741          - 12.0%
               459                                                                                                               13,649
        433                                                                                                                                                         Apr-2012              1,812          - 9.3%            1,504          - 13.1%
                                                                                                                                           12,511
                                                  389
                       367                                                                                                                                          May-2012              1,810          - 4.1%            1,391           - 7.5%
                                                            314                                                                                                     Jun-2012              1,371          - 15.2%           1,155          - 14.1%
                                                                                                                                                                    Jul-2012              1,036          - 13.1%            905            - 7.6%
                                                                                                                                                                    Aug-2012              1,012          - 8.5%             792            - 7.4%
                                                                                                                                                                    Sep-2012              1,440          - 9.4%            1,157           - 9.7%
                                                                                                                                                                    Oct-2012              1,087          - 6.2%             883            - 2.1%
                                                                                                                                                                    Nov-2012               657           - 3.7%             566            - 9.9%
        2010   2011     2012           2010       2011       2012                  2010       2011      2012            2010       2011       2012
                                                                                                                                                                    Dec-2012               367           - 20.0%            314           - 19.3%
               +6.0%   -20.0%                    -20.4%     -19.3%                           -3.0%      -3.0%                     -14.4%     -8.3%
                                                                                                                                                                    Total                14,926          - 3.0%           12,511           - 8.3%
          Single-Family                   Condominium                                 Single-Family                        Condominium


Historical New Listing Activity                                                                                                                                                 Single-Family                       Condominium
2,750

2,500

2,250

2,000

1,750

1,500

1,250

1,000

 750

 500

 250
  Jan-2003             Jan-2004               Jan-2005               Jan-2006                Jan-2007               Jan-2008                Jan-2009               Jan-2010                Jan-2011               Jan-2012


                       All data from MLS Property Information Network, Inc. Provided by the Greater Boston Association of REALTORS® and the Massachusetts Association of REALTORS®. Powered by 10K Research and Marketing. | Click for Cover Page | 12
City of Boston – Market Overview
Key market metrics for the current month and year-to-date figures for the City of Boston.


 Key Metrics                                             Historical Sparklines                                                            Dec-2011 Dec-2012                       +/–           YTD 2011 YTD 2012                      +/–


 Closed Sales                                                                                                                                  366               422           + 15.3%             4,397             5,436           + 23.6%
                                                        12-2009                 12-2010                12-2011                 12-2012


 Median Sales Price                                                                                                                       $389,750          $400,000            + 2.6%          $375,000          $400,000            + 6.7%
                                                        12-2009                 12-2010                12-2011                 12-2012


 Housing Affordability Index                                                                                                                   104               108            + 3.5%              102               110             + 8.0%
                                                        12-2009                 12-2010                12-2011                 12-2012


 Inventory of Homes for Sale                                                                                                                 1,464               700           - 52.2%                --                --                --
                                                        12-2009                 12-2010                12-2011                 12-2012


 Months Supply of Inventory                                                                                                                    4.0               1.7           - 58.5%                --                --                --
                                                        12-2009                 12-2010                12-2011                 12-2012


 Days on Market Until Sale                                                                                                                     114               76            - 33.3%              101                82            - 19.3%
                                                        12-2009                 12-2010                12-2011                 12-2012


 Percent of Original
                                                                                                                                            93.4%             95.6%             + 2.3%            93.8%             95.6%             + 2.0%
 List Price Received
                                                        12-2009                 12-2010                12-2011                 12-2012


 Pending Sales                                                                                                                                 286               268            - 6.3%             4,458             5,522           + 23.9%
                                                        12-2009                 12-2010                12-2011                 12-2012


 New Listings                                                                                                                                  251               157           - 37.5%             7,733             7,014            - 9.3%
                                                        12-2009                 12-2010                12-2011                 12-2012


                     All data from MLS Property Information Network, Inc. Provided by the Greater Boston Association of REALTORS® and the Massachusetts Association of REALTORS®. Powered by 10K Research and Marketing. | Click for Cover Page | 13

Más contenido relacionado

La actualidad más candente

This Month in Real Estate for Canada - December 2011
This Month in Real Estate for Canada - December 2011This Month in Real Estate for Canada - December 2011
This Month in Real Estate for Canada - December 2011Keller Williams Careers
 
Greater Princeton NJ Real Estate Update
Greater Princeton NJ Real Estate UpdateGreater Princeton NJ Real Estate Update
Greater Princeton NJ Real Estate UpdateAnn Harwood
 
3rd_Qtr_Report_2006
3rd_Qtr_Report_20063rd_Qtr_Report_2006
3rd_Qtr_Report_2006finance50
 
2006 03-30 Q2 2005/2006 Results
2006 03-30 Q2 2005/2006 Results2006 03-30 Q2 2005/2006 Results
2006 03-30 Q2 2005/2006 ResultsKappAhl
 
Greater Princeton NJ Real Estate Market Update 1 31 13
Greater Princeton NJ Real Estate Market Update 1 31 13Greater Princeton NJ Real Estate Market Update 1 31 13
Greater Princeton NJ Real Estate Market Update 1 31 13Ann Harwood
 
Greater Princeton Area Real Estate Trends March 14 2013
Greater Princeton Area Real Estate Trends March 14 2013Greater Princeton Area Real Estate Trends March 14 2013
Greater Princeton Area Real Estate Trends March 14 2013Ann Harwood
 
Big lots Research
Big lots ResearchBig lots Research
Big lots Researchjoajo
 
Cardinal Update September 2012
Cardinal Update September 2012Cardinal Update September 2012
Cardinal Update September 2012KimGibson
 
Toronto real estate statistics january 2012
Toronto real estate statistics january 2012Toronto real estate statistics january 2012
Toronto real estate statistics january 2012John Helfrich
 
Cardinal Update May 2012
Cardinal Update May 2012Cardinal Update May 2012
Cardinal Update May 2012KimGibson
 
Colliers International Highlights_Retail_na_2011_q4
Colliers International Highlights_Retail_na_2011_q4Colliers International Highlights_Retail_na_2011_q4
Colliers International Highlights_Retail_na_2011_q4Coy Davidson
 
Las Vegas Americas Market Beat Medical Office Q42011 In House
Las Vegas Americas Market Beat Medical Office Q42011 In HouseLas Vegas Americas Market Beat Medical Office Q42011 In House
Las Vegas Americas Market Beat Medical Office Q42011 In HouseJessica Parrish
 
2006 06-28 Q3 2005/2006 Results
2006 06-28 Q3 2005/2006 Results2006 06-28 Q3 2005/2006 Results
2006 06-28 Q3 2005/2006 ResultsKappAhl
 
Manufactured homes inc
Manufactured homes incManufactured homes inc
Manufactured homes incPramod Jindal
 

La actualidad más candente (17)

This Month in Real Estate for Canada - December 2011
This Month in Real Estate for Canada - December 2011This Month in Real Estate for Canada - December 2011
This Month in Real Estate for Canada - December 2011
 
Greater Princeton NJ Real Estate Update
Greater Princeton NJ Real Estate UpdateGreater Princeton NJ Real Estate Update
Greater Princeton NJ Real Estate Update
 
3rd_Qtr_Report_2006
3rd_Qtr_Report_20063rd_Qtr_Report_2006
3rd_Qtr_Report_2006
 
2006 03-30 Q2 2005/2006 Results
2006 03-30 Q2 2005/2006 Results2006 03-30 Q2 2005/2006 Results
2006 03-30 Q2 2005/2006 Results
 
TOL_1999_AR
TOL_1999_ARTOL_1999_AR
TOL_1999_AR
 
Greater Princeton NJ Real Estate Market Update 1 31 13
Greater Princeton NJ Real Estate Market Update 1 31 13Greater Princeton NJ Real Estate Market Update 1 31 13
Greater Princeton NJ Real Estate Market Update 1 31 13
 
Greater Princeton Area Real Estate Trends March 14 2013
Greater Princeton Area Real Estate Trends March 14 2013Greater Princeton Area Real Estate Trends March 14 2013
Greater Princeton Area Real Estate Trends March 14 2013
 
November 2011 Market Watch
November 2011 Market WatchNovember 2011 Market Watch
November 2011 Market Watch
 
Big lots Research
Big lots ResearchBig lots Research
Big lots Research
 
Cardinal Update September 2012
Cardinal Update September 2012Cardinal Update September 2012
Cardinal Update September 2012
 
Toronto real estate statistics january 2012
Toronto real estate statistics january 2012Toronto real estate statistics january 2012
Toronto real estate statistics january 2012
 
Cardinal Update May 2012
Cardinal Update May 2012Cardinal Update May 2012
Cardinal Update May 2012
 
Colliers International Highlights_Retail_na_2011_q4
Colliers International Highlights_Retail_na_2011_q4Colliers International Highlights_Retail_na_2011_q4
Colliers International Highlights_Retail_na_2011_q4
 
Las Vegas Americas Market Beat Medical Office Q42011 In House
Las Vegas Americas Market Beat Medical Office Q42011 In HouseLas Vegas Americas Market Beat Medical Office Q42011 In House
Las Vegas Americas Market Beat Medical Office Q42011 In House
 
2006 06-28 Q3 2005/2006 Results
2006 06-28 Q3 2005/2006 Results2006 06-28 Q3 2005/2006 Results
2006 06-28 Q3 2005/2006 Results
 
Market Watch August 2012
Market Watch August 2012Market Watch August 2012
Market Watch August 2012
 
Manufactured homes inc
Manufactured homes incManufactured homes inc
Manufactured homes inc
 

Similar a Market Data, December 2012

Greater Princeton NJ Real Estate Market October 2012
Greater Princeton NJ Real Estate Market October 2012Greater Princeton NJ Real Estate Market October 2012
Greater Princeton NJ Real Estate Market October 2012Ann Harwood
 
lowe's Annual Report2007
lowe's Annual Report2007lowe's Annual Report2007
lowe's Annual Report2007finance5
 
The Nest Report Q1 2012
The Nest Report Q1 2012The Nest Report Q1 2012
The Nest Report Q1 2012Jeremy Hart
 
NFIB: Small Business
NFIB: Small BusinessNFIB: Small Business
NFIB: Small BusinessBob Lowery
 
Minneapolis Saint Paul Twin Cities Metro Area Updated Weekly Real Estate Mark...
Minneapolis Saint Paul Twin Cities Metro Area Updated Weekly Real Estate Mark...Minneapolis Saint Paul Twin Cities Metro Area Updated Weekly Real Estate Mark...
Minneapolis Saint Paul Twin Cities Metro Area Updated Weekly Real Estate Mark...pattiann
 
This Month in Real Estate - Sept 2011
This Month in Real Estate - Sept  2011This Month in Real Estate - Sept  2011
This Month in Real Estate - Sept 2011pdrury
 
Construction White Paper
Construction White PaperConstruction White Paper
Construction White PaperBob Lowery
 
Annual Market Report (2012)
Annual Market Report (2012)Annual Market Report (2012)
Annual Market Report (2012)jasonwtolliver
 
Toronto real estate statistics november 2011
Toronto real estate statistics november 2011Toronto real estate statistics november 2011
Toronto real estate statistics november 2011John Helfrich
 
Small Business Economic Trends
Small Business Economic TrendsSmall Business Economic Trends
Small Business Economic TrendsJorge Portalea
 
Our Marketing Report
Our Marketing ReportOur Marketing Report
Our Marketing ReportRonPies1
 
The Nest Report Q3 2012
The Nest Report Q3 2012The Nest Report Q3 2012
The Nest Report Q3 2012Jeremy Hart
 
John Helfrich Real Estate Newsletter January February 2012
John Helfrich Real Estate Newsletter January February 2012John Helfrich Real Estate Newsletter January February 2012
John Helfrich Real Estate Newsletter January February 2012John Helfrich
 

Similar a Market Data, December 2012 (20)

Greater Princeton NJ Real Estate Market October 2012
Greater Princeton NJ Real Estate Market October 2012Greater Princeton NJ Real Estate Market October 2012
Greater Princeton NJ Real Estate Market October 2012
 
lowe's Annual Report2007
lowe's Annual Report2007lowe's Annual Report2007
lowe's Annual Report2007
 
The Nest Report Q1 2012
The Nest Report Q1 2012The Nest Report Q1 2012
The Nest Report Q1 2012
 
NFIB: Small Business
NFIB: Small BusinessNFIB: Small Business
NFIB: Small Business
 
Minneapolis Saint Paul Twin Cities Metro Area Updated Weekly Real Estate Mark...
Minneapolis Saint Paul Twin Cities Metro Area Updated Weekly Real Estate Mark...Minneapolis Saint Paul Twin Cities Metro Area Updated Weekly Real Estate Mark...
Minneapolis Saint Paul Twin Cities Metro Area Updated Weekly Real Estate Mark...
 
This Month in Real Estate - Sept 2011
This Month in Real Estate - Sept  2011This Month in Real Estate - Sept  2011
This Month in Real Estate - Sept 2011
 
July 2012 MLS Statistics
July 2012 MLS StatisticsJuly 2012 MLS Statistics
July 2012 MLS Statistics
 
Construction White Paper
Construction White PaperConstruction White Paper
Construction White Paper
 
Toronto Market Watch for February 2012
Toronto Market Watch for February 2012Toronto Market Watch for February 2012
Toronto Market Watch for February 2012
 
June 2012 MLS Statistics
June 2012 MLS StatisticsJune 2012 MLS Statistics
June 2012 MLS Statistics
 
Mw1204
Mw1204Mw1204
Mw1204
 
Annual Market Report (2012)
Annual Market Report (2012)Annual Market Report (2012)
Annual Market Report (2012)
 
Toronto real estate statistics november 2011
Toronto real estate statistics november 2011Toronto real estate statistics november 2011
Toronto real estate statistics november 2011
 
Small Business Economic Trends
Small Business Economic TrendsSmall Business Economic Trends
Small Business Economic Trends
 
Ok state 11 page average august 2012
Ok state 11 page average august 2012Ok state 11 page average august 2012
Ok state 11 page average august 2012
 
November 2012 MLS Statistics
November 2012 MLS StatisticsNovember 2012 MLS Statistics
November 2012 MLS Statistics
 
Our Marketing Report
Our Marketing ReportOur Marketing Report
Our Marketing Report
 
The Nest Report Q3 2012
The Nest Report Q3 2012The Nest Report Q3 2012
The Nest Report Q3 2012
 
December 2012 MLS Statistics
December 2012 MLS StatisticsDecember 2012 MLS Statistics
December 2012 MLS Statistics
 
John Helfrich Real Estate Newsletter January February 2012
John Helfrich Real Estate Newsletter January February 2012John Helfrich Real Estate Newsletter January February 2012
John Helfrich Real Estate Newsletter January February 2012
 

Más de Unit Realty Group

December 2015 multi family housing activity report – boston, ma real estate
December 2015 multi family housing activity report – boston, ma real estateDecember 2015 multi family housing activity report – boston, ma real estate
December 2015 multi family housing activity report – boston, ma real estateUnit Realty Group
 
October 2015 Greater Boston Real Estate Market Trends Report
October 2015 Greater Boston Real Estate Market Trends ReportOctober 2015 Greater Boston Real Estate Market Trends Report
October 2015 Greater Boston Real Estate Market Trends ReportUnit Realty Group
 
September 2015 Greater Boston Real Estate Market Trends Report
September 2015 Greater Boston Real Estate Market Trends ReportSeptember 2015 Greater Boston Real Estate Market Trends Report
September 2015 Greater Boston Real Estate Market Trends ReportUnit Realty Group
 
August 2015 Greater Boston Real Estate Market Trends Report
August 2015 Greater Boston Real Estate Market Trends ReportAugust 2015 Greater Boston Real Estate Market Trends Report
August 2015 Greater Boston Real Estate Market Trends ReportUnit Realty Group
 
February 2015 Greater Boston Real Estate Market Trends Report
February 2015 Greater Boston Real Estate Market Trends ReportFebruary 2015 Greater Boston Real Estate Market Trends Report
February 2015 Greater Boston Real Estate Market Trends ReportUnit Realty Group
 
January 2015′s Monthly Multi-family Housing Activity Report
January 2015′s Monthly Multi-family Housing Activity ReportJanuary 2015′s Monthly Multi-family Housing Activity Report
January 2015′s Monthly Multi-family Housing Activity ReportUnit Realty Group
 
January 2015 Greater Boston Real Estate Market Trends Report
January 2015 Greater Boston Real Estate Market Trends ReportJanuary 2015 Greater Boston Real Estate Market Trends Report
January 2015 Greater Boston Real Estate Market Trends ReportUnit Realty Group
 
December 2014 Greater Boston Real Estate Market Trends Report
December 2014 Greater Boston Real Estate Market Trends ReportDecember 2014 Greater Boston Real Estate Market Trends Report
December 2014 Greater Boston Real Estate Market Trends ReportUnit Realty Group
 
November 2014 Greater Boston Real Estate Market Trends Report
November 2014 Greater Boston Real Estate Market Trends ReportNovember 2014 Greater Boston Real Estate Market Trends Report
November 2014 Greater Boston Real Estate Market Trends ReportUnit Realty Group
 
November 2014 Multi-family Housing Activity Report – Boston, MA Real Estate
November 2014 Multi-family Housing Activity Report – Boston, MA Real EstateNovember 2014 Multi-family Housing Activity Report – Boston, MA Real Estate
November 2014 Multi-family Housing Activity Report – Boston, MA Real EstateUnit Realty Group
 
October 2014 Greater Boston Real Estate Market Trends Report
October 2014 Greater Boston Real Estate Market Trends ReportOctober 2014 Greater Boston Real Estate Market Trends Report
October 2014 Greater Boston Real Estate Market Trends ReportUnit Realty Group
 
September 2014 Multi-family Housing Activity Report – Boston, MA Real Estate
September 2014 Multi-family Housing Activity Report – Boston, MA Real EstateSeptember 2014 Multi-family Housing Activity Report – Boston, MA Real Estate
September 2014 Multi-family Housing Activity Report – Boston, MA Real EstateUnit Realty Group
 
Boston By The Numbers - Boston Housing Stock (Report)
Boston By The Numbers - Boston Housing Stock (Report)Boston By The Numbers - Boston Housing Stock (Report)
Boston By The Numbers - Boston Housing Stock (Report)Unit Realty Group
 
May 2014 Multi-family Housing Activity Report – Boston, MA Real Estate
May 2014 Multi-family Housing Activity Report – Boston, MA Real EstateMay 2014 Multi-family Housing Activity Report – Boston, MA Real Estate
May 2014 Multi-family Housing Activity Report – Boston, MA Real EstateUnit Realty Group
 
January 2014 Greater Boston Real Estate Market Trends Report
January 2014 Greater Boston Real Estate Market Trends ReportJanuary 2014 Greater Boston Real Estate Market Trends Report
January 2014 Greater Boston Real Estate Market Trends ReportUnit Realty Group
 
November 2013 Multi-family Housing Activity Report – Boston, MA Real Estate
November 2013 Multi-family Housing Activity Report – Boston, MA Real EstateNovember 2013 Multi-family Housing Activity Report – Boston, MA Real Estate
November 2013 Multi-family Housing Activity Report – Boston, MA Real EstateUnit Realty Group
 
October 2013 Multi-family Housing Activity Report – Boston, MA Real Estate
October 2013 Multi-family Housing Activity Report – Boston, MA Real EstateOctober 2013 Multi-family Housing Activity Report – Boston, MA Real Estate
October 2013 Multi-family Housing Activity Report – Boston, MA Real EstateUnit Realty Group
 
September 2013 Multifamily Housing Activity Report – Boston, MA Real Estate
September 2013 Multifamily Housing Activity Report – Boston, MA Real EstateSeptember 2013 Multifamily Housing Activity Report – Boston, MA Real Estate
September 2013 Multifamily Housing Activity Report – Boston, MA Real EstateUnit Realty Group
 
August 2013 Multifamily Housing Activity Report – Boston, MA Real Estate
August 2013 Multifamily Housing Activity Report – Boston, MA Real EstateAugust 2013 Multifamily Housing Activity Report – Boston, MA Real Estate
August 2013 Multifamily Housing Activity Report – Boston, MA Real EstateUnit Realty Group
 
July 2013 Multifamily Housing Activity Report – Boston, MA Real Estate
July 2013 Multifamily Housing Activity Report – Boston, MA Real EstateJuly 2013 Multifamily Housing Activity Report – Boston, MA Real Estate
July 2013 Multifamily Housing Activity Report – Boston, MA Real EstateUnit Realty Group
 

Más de Unit Realty Group (20)

December 2015 multi family housing activity report – boston, ma real estate
December 2015 multi family housing activity report – boston, ma real estateDecember 2015 multi family housing activity report – boston, ma real estate
December 2015 multi family housing activity report – boston, ma real estate
 
October 2015 Greater Boston Real Estate Market Trends Report
October 2015 Greater Boston Real Estate Market Trends ReportOctober 2015 Greater Boston Real Estate Market Trends Report
October 2015 Greater Boston Real Estate Market Trends Report
 
September 2015 Greater Boston Real Estate Market Trends Report
September 2015 Greater Boston Real Estate Market Trends ReportSeptember 2015 Greater Boston Real Estate Market Trends Report
September 2015 Greater Boston Real Estate Market Trends Report
 
August 2015 Greater Boston Real Estate Market Trends Report
August 2015 Greater Boston Real Estate Market Trends ReportAugust 2015 Greater Boston Real Estate Market Trends Report
August 2015 Greater Boston Real Estate Market Trends Report
 
February 2015 Greater Boston Real Estate Market Trends Report
February 2015 Greater Boston Real Estate Market Trends ReportFebruary 2015 Greater Boston Real Estate Market Trends Report
February 2015 Greater Boston Real Estate Market Trends Report
 
January 2015′s Monthly Multi-family Housing Activity Report
January 2015′s Monthly Multi-family Housing Activity ReportJanuary 2015′s Monthly Multi-family Housing Activity Report
January 2015′s Monthly Multi-family Housing Activity Report
 
January 2015 Greater Boston Real Estate Market Trends Report
January 2015 Greater Boston Real Estate Market Trends ReportJanuary 2015 Greater Boston Real Estate Market Trends Report
January 2015 Greater Boston Real Estate Market Trends Report
 
December 2014 Greater Boston Real Estate Market Trends Report
December 2014 Greater Boston Real Estate Market Trends ReportDecember 2014 Greater Boston Real Estate Market Trends Report
December 2014 Greater Boston Real Estate Market Trends Report
 
November 2014 Greater Boston Real Estate Market Trends Report
November 2014 Greater Boston Real Estate Market Trends ReportNovember 2014 Greater Boston Real Estate Market Trends Report
November 2014 Greater Boston Real Estate Market Trends Report
 
November 2014 Multi-family Housing Activity Report – Boston, MA Real Estate
November 2014 Multi-family Housing Activity Report – Boston, MA Real EstateNovember 2014 Multi-family Housing Activity Report – Boston, MA Real Estate
November 2014 Multi-family Housing Activity Report – Boston, MA Real Estate
 
October 2014 Greater Boston Real Estate Market Trends Report
October 2014 Greater Boston Real Estate Market Trends ReportOctober 2014 Greater Boston Real Estate Market Trends Report
October 2014 Greater Boston Real Estate Market Trends Report
 
September 2014 Multi-family Housing Activity Report – Boston, MA Real Estate
September 2014 Multi-family Housing Activity Report – Boston, MA Real EstateSeptember 2014 Multi-family Housing Activity Report – Boston, MA Real Estate
September 2014 Multi-family Housing Activity Report – Boston, MA Real Estate
 
Boston By The Numbers - Boston Housing Stock (Report)
Boston By The Numbers - Boston Housing Stock (Report)Boston By The Numbers - Boston Housing Stock (Report)
Boston By The Numbers - Boston Housing Stock (Report)
 
May 2014 Multi-family Housing Activity Report – Boston, MA Real Estate
May 2014 Multi-family Housing Activity Report – Boston, MA Real EstateMay 2014 Multi-family Housing Activity Report – Boston, MA Real Estate
May 2014 Multi-family Housing Activity Report – Boston, MA Real Estate
 
January 2014 Greater Boston Real Estate Market Trends Report
January 2014 Greater Boston Real Estate Market Trends ReportJanuary 2014 Greater Boston Real Estate Market Trends Report
January 2014 Greater Boston Real Estate Market Trends Report
 
November 2013 Multi-family Housing Activity Report – Boston, MA Real Estate
November 2013 Multi-family Housing Activity Report – Boston, MA Real EstateNovember 2013 Multi-family Housing Activity Report – Boston, MA Real Estate
November 2013 Multi-family Housing Activity Report – Boston, MA Real Estate
 
October 2013 Multi-family Housing Activity Report – Boston, MA Real Estate
October 2013 Multi-family Housing Activity Report – Boston, MA Real EstateOctober 2013 Multi-family Housing Activity Report – Boston, MA Real Estate
October 2013 Multi-family Housing Activity Report – Boston, MA Real Estate
 
September 2013 Multifamily Housing Activity Report – Boston, MA Real Estate
September 2013 Multifamily Housing Activity Report – Boston, MA Real EstateSeptember 2013 Multifamily Housing Activity Report – Boston, MA Real Estate
September 2013 Multifamily Housing Activity Report – Boston, MA Real Estate
 
August 2013 Multifamily Housing Activity Report – Boston, MA Real Estate
August 2013 Multifamily Housing Activity Report – Boston, MA Real EstateAugust 2013 Multifamily Housing Activity Report – Boston, MA Real Estate
August 2013 Multifamily Housing Activity Report – Boston, MA Real Estate
 
July 2013 Multifamily Housing Activity Report – Boston, MA Real Estate
July 2013 Multifamily Housing Activity Report – Boston, MA Real EstateJuly 2013 Multifamily Housing Activity Report – Boston, MA Real Estate
July 2013 Multifamily Housing Activity Report – Boston, MA Real Estate
 

Último

Manipur-Book-Final-2-compressed.pdfsal'rpk
Manipur-Book-Final-2-compressed.pdfsal'rpkManipur-Book-Final-2-compressed.pdfsal'rpk
Manipur-Book-Final-2-compressed.pdfsal'rpkbhavenpr
 
complaint-ECI-PM-media-1-Chandru.pdfra;;prfk
complaint-ECI-PM-media-1-Chandru.pdfra;;prfkcomplaint-ECI-PM-media-1-Chandru.pdfra;;prfk
complaint-ECI-PM-media-1-Chandru.pdfra;;prfkbhavenpr
 
Rohan Jaitley: Central Gov't Standing Counsel for Justice
Rohan Jaitley: Central Gov't Standing Counsel for JusticeRohan Jaitley: Central Gov't Standing Counsel for Justice
Rohan Jaitley: Central Gov't Standing Counsel for JusticeAbdulGhani778830
 
VIP Girls Available Call or WhatsApp 9711199012
VIP Girls Available Call or WhatsApp 9711199012VIP Girls Available Call or WhatsApp 9711199012
VIP Girls Available Call or WhatsApp 9711199012ankitnayak356677
 
IndiaWest: Your Trusted Source for Today's Global News
IndiaWest: Your Trusted Source for Today's Global NewsIndiaWest: Your Trusted Source for Today's Global News
IndiaWest: Your Trusted Source for Today's Global NewsIndiaWest2
 
Top 10 Wealthiest People In The World.pdf
Top 10 Wealthiest People In The World.pdfTop 10 Wealthiest People In The World.pdf
Top 10 Wealthiest People In The World.pdfauroraaudrey4826
 
Quiz for Heritage Indian including all the rounds
Quiz for Heritage Indian including all the roundsQuiz for Heritage Indian including all the rounds
Quiz for Heritage Indian including all the roundsnaxymaxyy
 
57 Bidens Annihilation Nation Policy.pdf
57 Bidens Annihilation Nation Policy.pdf57 Bidens Annihilation Nation Policy.pdf
57 Bidens Annihilation Nation Policy.pdfGerald Furnkranz
 
AP Election Survey 2024: TDP-Janasena-BJP Alliance Set To Sweep Victory
AP Election Survey 2024: TDP-Janasena-BJP Alliance Set To Sweep VictoryAP Election Survey 2024: TDP-Janasena-BJP Alliance Set To Sweep Victory
AP Election Survey 2024: TDP-Janasena-BJP Alliance Set To Sweep Victoryanjanibaddipudi1
 
Brief biography of Julius Robert Oppenheimer
Brief biography of Julius Robert OppenheimerBrief biography of Julius Robert Oppenheimer
Brief biography of Julius Robert OppenheimerOmarCabrera39
 
Opportunities, challenges, and power of media and information
Opportunities, challenges, and power of media and informationOpportunities, challenges, and power of media and information
Opportunities, challenges, and power of media and informationReyMonsales
 
Global Terrorism and its types and prevention ppt.
Global Terrorism and its types and prevention ppt.Global Terrorism and its types and prevention ppt.
Global Terrorism and its types and prevention ppt.NaveedKhaskheli1
 
Referendum Party 2024 Election Manifesto
Referendum Party 2024 Election ManifestoReferendum Party 2024 Election Manifesto
Referendum Party 2024 Election ManifestoSABC News
 

Último (13)

Manipur-Book-Final-2-compressed.pdfsal'rpk
Manipur-Book-Final-2-compressed.pdfsal'rpkManipur-Book-Final-2-compressed.pdfsal'rpk
Manipur-Book-Final-2-compressed.pdfsal'rpk
 
complaint-ECI-PM-media-1-Chandru.pdfra;;prfk
complaint-ECI-PM-media-1-Chandru.pdfra;;prfkcomplaint-ECI-PM-media-1-Chandru.pdfra;;prfk
complaint-ECI-PM-media-1-Chandru.pdfra;;prfk
 
Rohan Jaitley: Central Gov't Standing Counsel for Justice
Rohan Jaitley: Central Gov't Standing Counsel for JusticeRohan Jaitley: Central Gov't Standing Counsel for Justice
Rohan Jaitley: Central Gov't Standing Counsel for Justice
 
VIP Girls Available Call or WhatsApp 9711199012
VIP Girls Available Call or WhatsApp 9711199012VIP Girls Available Call or WhatsApp 9711199012
VIP Girls Available Call or WhatsApp 9711199012
 
IndiaWest: Your Trusted Source for Today's Global News
IndiaWest: Your Trusted Source for Today's Global NewsIndiaWest: Your Trusted Source for Today's Global News
IndiaWest: Your Trusted Source for Today's Global News
 
Top 10 Wealthiest People In The World.pdf
Top 10 Wealthiest People In The World.pdfTop 10 Wealthiest People In The World.pdf
Top 10 Wealthiest People In The World.pdf
 
Quiz for Heritage Indian including all the rounds
Quiz for Heritage Indian including all the roundsQuiz for Heritage Indian including all the rounds
Quiz for Heritage Indian including all the rounds
 
57 Bidens Annihilation Nation Policy.pdf
57 Bidens Annihilation Nation Policy.pdf57 Bidens Annihilation Nation Policy.pdf
57 Bidens Annihilation Nation Policy.pdf
 
AP Election Survey 2024: TDP-Janasena-BJP Alliance Set To Sweep Victory
AP Election Survey 2024: TDP-Janasena-BJP Alliance Set To Sweep VictoryAP Election Survey 2024: TDP-Janasena-BJP Alliance Set To Sweep Victory
AP Election Survey 2024: TDP-Janasena-BJP Alliance Set To Sweep Victory
 
Brief biography of Julius Robert Oppenheimer
Brief biography of Julius Robert OppenheimerBrief biography of Julius Robert Oppenheimer
Brief biography of Julius Robert Oppenheimer
 
Opportunities, challenges, and power of media and information
Opportunities, challenges, and power of media and informationOpportunities, challenges, and power of media and information
Opportunities, challenges, and power of media and information
 
Global Terrorism and its types and prevention ppt.
Global Terrorism and its types and prevention ppt.Global Terrorism and its types and prevention ppt.
Global Terrorism and its types and prevention ppt.
 
Referendum Party 2024 Election Manifesto
Referendum Party 2024 Election ManifestoReferendum Party 2024 Election Manifesto
Referendum Party 2024 Election Manifesto
 

Market Data, December 2012

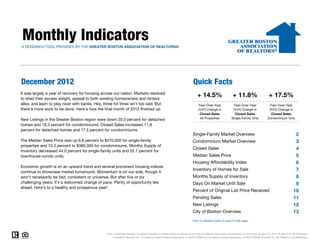
  • 1. Monthly Indicators A RESEARCH TOOL PROVIDED BY THE GREATER BOSTON ASSOCIATION OF REALTORS® December 2012 Quick Facts It was largely a year of recovery for housing across our nation. Markets resolved to shed their excess weight, appeal to both existing homeowners and renters + 14.5% + 11.8% + 17.5% alike, and learn to play nicer with banks. Hey, three for three isn't too bad. But Year-Over-Year Year-Over-Year Year-Over-Year there's more work to be done. Here's how the final month of 2012 finished up. (YoY) Change in (YoY) Change in (YoY) Change in Closed Sales Closed Sales Closed Sales New Listings in the Greater Boston region were down 20.0 percent for detached All Properties Single-Family Only Condominium Only homes and 19.3 percent for condominiums. Closed Sales increased 11.8 percent for detached homes and 17.5 percent for condominiums. Single-Family Market Overview 2 The Median Sales Price was up 6.8 percent to $470,000 for single-family Condominium Market Overview 3 properties and 10.3 percent to $380,000 for condominiums. Months Supply of Inventory decreased 44.0 percent for single-family units and 52.7 percent for Closed Sales 4 townhouse-condo units. Median Sales Price 5 Housing Affordability Index 6 Economic growth is on an upward trend and several prominent housing indices continue to showcase market turnaround. Momentum is on our side, though it Inventory of Homes for Sale 7 won't necessarily be fast, consistent or universal. But after five or six Months Supply of Inventory 8 challenging years, it's a welcomed change of pace. Plenty of opportunity lies Days On Market Until Sale 9 ahead. Here's to a healthy and prosperous year! Percent of Original List Price Received 10 Pending Sales 11 New Listings 12 City of Boston Overview 13 Click on desired metric to jump to that page. Data is refreshed regularly to capture changes in market activity so figures shown may be different than previously reported. Current as of January 16, 2013. All data from MLS Property Information Network, Inc. Provided by Greater Boston Association of REALTORS® and the Massachusetts Association of REALTORS®. Powered by 10K Research and Marketing.
  • 2. Single-Family Market Overview Key market metrics for the current month and year-to-date figures for Single-Family Homes Only. Key Metrics Historical Sparklines Dec-2011 Dec-2012 +/– YTD 2011 YTD 2012 +/– Closed Sales 745 833 + 11.8% 9,069 10,886 + 20.0% 12-2009 12-2010 12-2011 12-2012 Median Sales Price $440,000 $470,000 + 6.8% $450,000 $457,500 + 1.7% 12-2009 12-2010 12-2011 12-2012 Housing Affordability Index 104 108 + 3.5% 102 110 + 8.0% 12-2009 12-2010 12-2011 12-2012 Inventory of Homes for Sale 3,669 2,296 - 37.4% -- -- -- 12-2009 12-2010 12-2011 12-2012 Months Supply of Inventory 4.9 2.8 - 44.0% -- -- -- 12-2009 12-2010 12-2011 12-2012 Days on Market Until Sale 112 98 - 12.8% 104 98 - 5.9% 12-2009 12-2010 12-2011 12-2012 Percent of Original 92.1% 94.2% + 2.3% 93.1% 94.4% + 1.4% List Price Received 12-2009 12-2010 12-2011 12-2012 Pending Sales 570 624 + 9.5% 9,181 11,101 + 20.9% 12-2009 12-2010 12-2011 12-2012 New Listings 459 367 - 20.0% 15,386 14,926 - 3.0% 12-2009 12-2010 12-2011 12-2012 All data from MLS Property Information Network, Inc. Provided by the Greater Boston Association of REALTORS® and the Massachusetts Association of REALTORS®. Powered by 10K Research and Marketing. | Click for Cover Page | 2
  • 3. Condominium Market Overview Key market metrics for the current month and year-to-date figures for Condominium Properties Only. Key Metrics Historical Sparklines Dec-2011 Dec-2012 +/– YTD 2011 YTD 2012 +/– Closed Sales 645 758 + 17.5% 7,941 9,680 + 21.9% 12-2009 12-2010 12-2011 12-2012 Median Sales Price $344,500 $380,000 + 10.3% $359,011 $379,000 + 5.6% 12-2009 12-2010 12-2011 12-2012 Housing Affordability Index 130 131 + 0.6% 125 131 + 4.4% 12-2009 12-2010 12-2011 12-2012 Inventory of Homes for Sale 2,819 1,568 - 44.4% -- -- -- 12-2009 12-2010 12-2011 12-2012 Months Supply of Inventory 4.4 2.1 - 52.7% -- -- -- 12-2009 12-2010 12-2011 12-2012 Days on Market Until Sale 120 84 - 30.4% 105 87 - 17.8% 12-2009 12-2010 12-2011 12-2012 Percent of Original 93.0% 96.2% + 3.4% 94.0% 95.8% + 2.0% List Price Received 12-2009 12-2010 12-2011 12-2012 Pending Sales 471 515 + 9.3% 7,967 9,882 + 24.0% 12-2009 12-2010 12-2011 12-2012 New Listings 389 314 - 19.3% 13,649 12,511 - 8.3% 12-2009 12-2010 12-2011 12-2012 All data from MLS Property Information Network, Inc. Provided by the Greater Boston Association of REALTORS® and the Massachusetts Association of REALTORS®. Powered by 10K Research and Marketing. | Click for Cover Page | 3
  • 4. Closed Sales A count of the actual sales that have closed in a given month. December Year to Date Single-Family YoY Change Condominium YoY Change Jan-2012 526 + 12.6% 414 + 3.0% 833 10,886 Feb-2012 474 + 33.5% 385 + 12.2% 736 745 758 9,680 Mar-2012 657 + 16.5% 608 + 10.9% 9,149 9,069 655 645 Apr-2012 752 + 12.1% 759 + 19.7% 8,306 7,941 May-2012 1,017 + 20.4% 1,013 + 32.1% Jun-2012 1,529 + 21.4% 1,270 + 20.2% Jul-2012 1,293 + 25.4% 1,041 + 21.8% Aug-2012 1,316 + 26.7% 1,206 + 24.7% Sep-2012 773 - 1.4% 754 + 16.4% Oct-2012 798 + 28.9% 712 + 38.8% Nov-2012 918 + 33.0% 760 + 35.2% 2010 2011 2012 2010 2011 2012 2010 2011 2012 2010 2011 2012 Dec-2012 833 + 11.8% 758 + 17.5% +1.2% +11.8% -1.5% +17.5% -0.9% +20.0% -4.4% +21.9% Total 10,886 + 20.0% 9,680 + 21.9% Single-Family Condominium Single-Family Condominium Historical Closed Sales Activity Single-Family Condominium 1,800 1,600 1,400 1,200 1,000 800 600 400 200 Jan-2003 Jan-2004 Jan-2005 Jan-2006 Jan-2007 Jan-2008 Jan-2009 Jan-2010 Jan-2011 Jan-2012 All data from MLS Property Information Network, Inc. Provided by the Greater Boston Association of REALTORS® and the Massachusetts Association of REALTORS®. Powered by 10K Research and Marketing. | Click for Cover Page | 4
  • 5. Median Sales Price Median price point for all closed sales, not accounting for seller concessions, in a given month. December Year to Date Single-Family YoY Change Condominium YoY Change Jan-2012 $405,000 - 9.0% $350,000 - 1.7% $470,000 $450,000 $450,000 $457,500 Feb-2012 $391,875 + 3.4% $371,000 + 6.6% $435,000 $440,000 Mar-2012 $411,000 - 1.3% $340,000 + 4.8% $380,000 $379,000 $355,000 $349,900 $359,011 Apr-2012 $414,850 - 3.3% $370,750 + 5.0% $344,500 May-2012 $465,000 + 1.3% $381,000 + 4.4% Jun-2012 $500,000 - 0.2% $400,000 + 6.7% Jul-2012 $510,000 + 2.2% $387,000 + 6.3% Aug-2012 $489,450 - 1.9% $380,000 + 3.5% Sep-2012 $430,000 - 4.3% $375,000 + 2.0% Oct-2012 $429,000 + 10.0% $365,883 + 4.8% Nov-2012 $445,550 + 5.3% $380,000 + 8.4% 2010 2011 2012 2010 2011 2012 2010 2011 2012 2010 2011 2012 Dec-2012 $470,000 + 6.8% $380,000 + 10.3% +1.1% +6.8% -3.0% +10.3% 0.0% +1.7% +2.6% +5.6% Median $457,500 + 1.7% $379,000 + 5.6% Single-Family Condominium Single-Family Condominium Historical Median Sales Price Single-Family Condominium $550,000 $500,000 $450,000 $400,000 $350,000 $300,000 $250,000 Jan-2003 Jan-2004 Jan-2005 Jan-2006 Jan-2007 Jan-2008 Jan-2009 Jan-2010 Jan-2011 Jan-2012 All data from MLS Property Information Network, Inc. Provided by the Greater Boston Association of REALTORS® and the Massachusetts Association of REALTORS®. Powered by 10K Research and Marketing. | Click for Cover Page | 5
  • 6. Housing Affordability Index This index measures housing affordability for the region. An index of 120 means the median household income was 120% of what is necessary to qualify for the median-priced home under prevailing interest rates. A higher number means greater affordability. December Year to Date Single-Family YoY Change Condominium YoY Change 130 131 131 125 Jan-2012 113 + 17.4% 129 + 9.3% 118 120 Feb-2012 119 + 7.9% 125 + 4.9% 108 110 104 102 Mar-2012 114 + 11.5% 135 + 5.6% 98 95 Apr-2012 112 + 13.1% 124 + 4.8% May-2012 102 + 7.2% 122 + 4.2% Jun-2012 97 + 8.5% 118 + 1.9% Jul-2012 96 + 7.9% 124 + 3.9% Aug-2012 100 + 11.0% 127 + 5.5% Sep-2012 116 + 15.2% 131 + 8.5% Oct-2012 115 - 0.4% 133 + 4.1% Nov-2012 112 + 4.1% 129 + 1.4% 2010 2011 2012 2010 2011 2012 2010 2011 2012 2010 2011 2012 Dec-2012 108 + 3.5% 131 + 0.6% +5.9% +3.5% +9.9% +0.6% +7.0% +8.0% +4.8% +4.4% Average 109 +8.9% 127 +4.6% Single-Family Condominium Single-Family Condominium Historical Housing Affordability Index Single-Family Condominium 140 130 120 110 100 90 80 70 60 Jan-2004 Jan-2005 Jan-2006 Jan-2007 Jan-2008 Jan-2009 Jan-2010 Jan-2011 Jan-2012 All data from MLS Property Information Network, Inc. Provided by the Greater Boston Association of REALTORS® and the Massachusetts Association of REALTORS®. Powered by 10K Research and Marketing. | Click for Cover Page | 6
  • 7. Inventory of Homes for Sale The number of properties available for sale in active status at the end of a given month. December Single-Family YoY Change Condominium YoY Change Jan-2012 3,708 - 2.4% 2,979 - 19.1% 3,769 3,669 3,546 Feb-2012 4,100 + 6.7% 3,270 - 16.5% Mar-2012 4,726 + 2.1% 3,700 - 21.1% 2,819 Apr-2012 5,074 - 4.7% 3,854 - 25.7% May-2012 5,178 - 9.7% 3,666 - 29.8% 2,296 Jun-2012 4,857 - 15.3% 3,395 - 33.4% Jul-2012 4,423 - 21.0% 3,128 - 33.7% 1,568 Aug-2012 4,049 - 24.7% 2,716 - 35.6% Sep-2012 4,244 - 24.8% 2,831 - 34.6% Oct-2012 3,910 - 27.9% 2,585 - 37.0% Nov-2012 3,218 - 30.2% 2,155 - 40.1% 2010 2011 2012 2010 2011 2012 Dec-2012 2,296 - 37.4% 1,568 - 44.4% -2.7% -37.4% -20.5% -44.4% Average 4,149 - 16.2% 2,987 - 30.5% Single-Family Condominium Historical Inventory of Homes for Sale Single-Family Condominium 9,000 8,000 7,000 6,000 5,000 4,000 3,000 2,000 1,000 Jan-2003 Jan-2004 Jan-2005 Jan-2006 Jan-2007 Jan-2008 Jan-2009 Jan-2010 Jan-2011 Jan-2012 All data from MLS Property Information Network, Inc. Provided by the Greater Boston Association of REALTORS® and the Massachusetts Association of REALTORS®. Powered by 10K Research and Marketing. | Click for Cover Page | 7
  • 8. Months Supply of Inventory The inventory of homes for sale at the end of a given month, divided by the average monthly pending sales from the last 12 months. December Single-Family YoY Change Condominium YoY Change 5.4 Jan-2012 7.0 - 13.4% 7.2 - 21.4% 5.1 4.9 Feb-2012 8.6 - 20.1% 8.5 - 25.6% 4.4 Mar-2012 7.2 - 12.4% 6.1 - 28.9% Apr-2012 6.7 - 14.9% 5.1 - 37.9% May-2012 5.1 - 25.0% 3.6 - 46.9% Jun-2012 3.2 - 30.2% 2.7 - 44.6% 2.8 Jul-2012 3.4 - 37.0% 3.0 - 45.5% 2.1 Aug-2012 3.1 - 40.5% 2.3 - 48.4% Sep-2012 5.5 - 23.8% 3.8 - 43.8% Oct-2012 4.9 - 44.1% 3.6 - 54.6% Nov-2012 3.5 - 47.5% 2.8 - 55.7% 2010 2011 2012 2010 2011 2012 Dec-2012 2.8 - 44.0% 2.1 - 52.7% -3.8% -44.0% -19.3% -52.7% Average 5.0 - 24.2% 4.2 - 36.5% Single-Family Condominium Historical Months Supply of Inventory Single-Family Condominium 14 12 10 8 6 4 2 Jan-2004 Jan-2005 Jan-2006 Jan-2007 Jan-2008 Jan-2009 Jan-2010 Jan-2011 Jan-2012 All data from MLS Property Information Network, Inc. Provided by the Greater Boston Association of REALTORS® and the Massachusetts Association of REALTORS®. Powered by 10K Research and Marketing. | Click for Cover Page | 8
  • 9. Days on Market Until Sale Average number of days between when a property is listed and when an offer is accepted in a given month. December Year to Date Single-Family YoY Change Condominium YoY Change Jan-2012 130 + 15.0% 124 - 5.0% 105 Feb-2012 134 + 2.9% 123 - 9.8% 120 104 102 113 112 95 98 Mar-2012 131 - 3.1% 118 - 4.2% 107 98 87 Apr-2012 120 - 1.4% 98 - 16.9% 84 May-2012 96 - 6.4% 86 - 12.0% Jun-2012 90 - 0.1% 75 - 19.5% Jul-2012 81 - 4.5% 71 - 20.6% Aug-2012 88 - 5.4% 76 - 18.3% Sep-2012 89 - 12.1% 85 - 18.0% Oct-2012 91 - 16.4% 84 - 11.6% Nov-2012 90 - 17.7% 76 - 30.5% 2010 2011 2012 2010 2011 2012 2010 2011 2012 2010 2011 2012 Dec-2012 98 - 12.8% 84 - 30.4% -0.3% -12.8% +11.8% -30.4% +9.6% -5.9% +3.3% -17.8% Total 98 - 5.9% 80 - 16.2% Single-Family Condominium Single-Family Condominium Historical Days on Market Until Sale Single-Family Condominium 160 140 120 100 80 60 40 Jan-2003 Jan-2004 Jan-2005 Jan-2006 Jan-2007 Jan-2008 Jan-2009 Jan-2010 Jan-2011 Jan-2012 All data from MLS Property Information Network, Inc. Provided by the Greater Boston Association of REALTORS® and the Massachusetts Association of REALTORS®. Powered by 10K Research and Marketing. | Click for Cover Page | 9
  • 10. Percent of Original List Price Received Percentage found when dividing a property’s sales price by its original list price, then taking the average for all properties sold in a given month, not accounting for seller concessions. December Year to Date Single-Family YoY Change Condominium YoY Change Jan-2012 90.5% - 0.4% 92.8% + 0.5% Feb-2012 91.2% + 0.3% 93.4% + 1.5% 96.2% 94.4% 94.0% 95.8% Mar-2012 93.0% + 0.8% 94.0% + 0.9% 91.3% 92.1% 94.2% 93.0% 93.0% 93.6% 93.1% 94.4% Apr-2012 93.5% + 0.9% 95.7% + 2.0% May-2012 95.4% + 1.2% 96.1% + 1.0% Jun-2012 95.3% + 0.8% 96.3% + 1.7% Jul-2012 95.7% + 1.5% 96.6% + 1.7% Aug-2012 94.8% + 1.5% 96.2% + 2.2% Sep-2012 94.5% + 1.5% 96.4% + 2.4% Oct-2012 94.3% + 2.8% 95.9% + 2.4% Nov-2012 94.6% + 2.3% 96.2% + 2.5% 2010 2011 2012 2010 2011 2012 2010 2011 2012 2010 2011 2012 Dec-2012 94.2% + 2.3% 96.2% + 3.4% +1.0% +2.3% +0.1% +3.4% -0.6% +1.4% -0.4% +2.0% Average 94.4% + 1.4% 95.8% + 2.0% Single-Family Condominium Single-Family Condominium Historical Percent of Original List Price Received Single-Family Condominium 99% 98% 97% 96% 95% 94% 93% 92% 91% 90% 89% Jan-2003 Jan-2004 Jan-2005 Jan-2006 Jan-2007 Jan-2008 Jan-2009 Jan-2010 Jan-2011 Jan-2012 All data from MLS Property Information Network, Inc. Provided by the Greater Boston Association of REALTORS® and the Massachusetts Association of REALTORS®. Powered by 10K Research and Marketing. | Click for Cover Page | 10
  • 11. Pending Sales A count of the properties in UAG status between the first and last day in a given month, regardless of current status (based on Off Market Date). December Year to Date Single-Family YoY Change Condominium YoY Change Jan-2012 545 + 26.7% 484 + 18.6% 11,101 624 Feb-2012 652 + 23.3% 635 + 24.0% 570 9,882 Mar-2012 994 + 24.6% 1,012 + 32.3% 542 9,132 9,181 515 Apr-2012 1,153 + 21.8% 1,049 + 24.3% 471 8,200 7,967 442 May-2012 1,339 + 23.1% 1,268 + 28.9% Jun-2012 1,269 + 13.4% 1,047 + 19.5% Jul-2012 1,057 + 26.6% 835 + 9.4% Aug-2012 912 + 18.0% 821 + 22.5% Sep-2012 855 + 28.8% 720 + 39.0% Oct-2012 896 + 20.4% 823 + 38.8% Nov-2012 805 + 17.7% 673 + 19.5% 2010 2011 2012 2010 2011 2012 2010 2011 2012 2010 2011 2012 Dec-2012 624 + 9.5% 515 + 9.3% +5.2% +9.5% +6.6% +9.3% +0.5% +20.9% -2.8% +24.0% Total 11,101 + 20.9% 9,882 + 24.0% Single-Family Condominium Single-Family Condominium Historical Pending Sales Activity Single-Family Condominium 1,400 1,200 1,000 800 600 400 200 Jan-2003 Jan-2004 Jan-2005 Jan-2006 Jan-2007 Jan-2008 Jan-2009 Jan-2010 Jan-2011 Jan-2012 All data from MLS Property Information Network, Inc. Provided by the Greater Boston Association of REALTORS® and the Massachusetts Association of REALTORS®. Powered by 10K Research and Marketing. | Click for Cover Page | 11
  • 12. New Listings A count of the properties that have been newly listed on the market in a given month. December Year to Date Single-Family YoY Change Condominium YoY Change Jan-2012 975 + 14.4% 958 - 1.8% 15,859 15,386 15,937 Feb-2012 1,336 + 51.3% 1,145 + 5.8% 489 14,926 Mar-2012 2,023 + 3.1% 1,741 - 12.0% 459 13,649 433 Apr-2012 1,812 - 9.3% 1,504 - 13.1% 12,511 389 367 May-2012 1,810 - 4.1% 1,391 - 7.5% 314 Jun-2012 1,371 - 15.2% 1,155 - 14.1% Jul-2012 1,036 - 13.1% 905 - 7.6% Aug-2012 1,012 - 8.5% 792 - 7.4% Sep-2012 1,440 - 9.4% 1,157 - 9.7% Oct-2012 1,087 - 6.2% 883 - 2.1% Nov-2012 657 - 3.7% 566 - 9.9% 2010 2011 2012 2010 2011 2012 2010 2011 2012 2010 2011 2012 Dec-2012 367 - 20.0% 314 - 19.3% +6.0% -20.0% -20.4% -19.3% -3.0% -3.0% -14.4% -8.3% Total 14,926 - 3.0% 12,511 - 8.3% Single-Family Condominium Single-Family Condominium Historical New Listing Activity Single-Family Condominium 2,750 2,500 2,250 2,000 1,750 1,500 1,250 1,000 750 500 250 Jan-2003 Jan-2004 Jan-2005 Jan-2006 Jan-2007 Jan-2008 Jan-2009 Jan-2010 Jan-2011 Jan-2012 All data from MLS Property Information Network, Inc. Provided by the Greater Boston Association of REALTORS® and the Massachusetts Association of REALTORS®. Powered by 10K Research and Marketing. | Click for Cover Page | 12
  • 13. City of Boston – Market Overview Key market metrics for the current month and year-to-date figures for the City of Boston. Key Metrics Historical Sparklines Dec-2011 Dec-2012 +/– YTD 2011 YTD 2012 +/– Closed Sales 366 422 + 15.3% 4,397 5,436 + 23.6% 12-2009 12-2010 12-2011 12-2012 Median Sales Price $389,750 $400,000 + 2.6% $375,000 $400,000 + 6.7% 12-2009 12-2010 12-2011 12-2012 Housing Affordability Index 104 108 + 3.5% 102 110 + 8.0% 12-2009 12-2010 12-2011 12-2012 Inventory of Homes for Sale 1,464 700 - 52.2% -- -- -- 12-2009 12-2010 12-2011 12-2012 Months Supply of Inventory 4.0 1.7 - 58.5% -- -- -- 12-2009 12-2010 12-2011 12-2012 Days on Market Until Sale 114 76 - 33.3% 101 82 - 19.3% 12-2009 12-2010 12-2011 12-2012 Percent of Original 93.4% 95.6% + 2.3% 93.8% 95.6% + 2.0% List Price Received 12-2009 12-2010 12-2011 12-2012 Pending Sales 286 268 - 6.3% 4,458 5,522 + 23.9% 12-2009 12-2010 12-2011 12-2012 New Listings 251 157 - 37.5% 7,733 7,014 - 9.3% 12-2009 12-2010 12-2011 12-2012 All data from MLS Property Information Network, Inc. Provided by the Greater Boston Association of REALTORS® and the Massachusetts Association of REALTORS®. Powered by 10K Research and Marketing. | Click for Cover Page | 13