
Recomendados
Más contenido relacionado
Similar a Russell Ides
Similar a Russell Ides (20)
Más de FNian
Más de FNian (20)
Último
Último (20)
Russell Ides
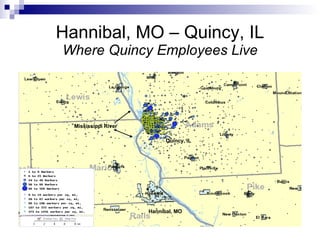
- 1. Hannibal, MO – Quincy, IL Where Quincy Employees Live Hannibal, MO Quincy, IL Mississippi River
- 2. Hannibal, MO – Quincy, IL Where Quincy Residents Work Quincy, IL Hannibal, MO Mississippi River
- 3. Scott Air Force Base, Illinois Scott AFB, IL Belleville, IL Fairview Heights, IL 10-mile radius around Scott AFB, IL East St. Louis, IL St Louis, MO Mississippi River
- 4. $4,606 $6,334 7.5% 185 13.1% 6,792 325 Chemical Manufacturing $3,967 $4,901 8.5% 180 16.0% 6,989 334 Computer and Electronic Manufacturing $990 $2,838 11.8% 189 23.1% 7,752 6112 Junior Colleges $2,641 $3,802 7.2% 418 11.0% 7,879 441 Motor Vehicle and Parts Dealers $3,056 $4,468 9.2% 445 14.8% 8,193 531 Real Estate $3,109 $4,030 9.4% 528 14.6% 9,929 484 Truck Transportation $3,172 $4,502 8.2% 412 13.6% 10,642 311 Food Manufacturing $7,596 $9,422 6.4% 353 12.5% 11,316 551 Management of Companies and Enterprises $4,214 $7,807 7.3% 363 14.8% 12,009 6211 Offices of Physicians $2,368 $3,727 8.1% 381 16.1% 12,264 813 Religious and Grantmaking Organizations $3,944 $5,174 7.2% 541 12.1% 13,069 424 Merchant Wholesalers, Nondurable Goods $5,087 $6,551 8.1% 534 13.2% 14,599 524 Insurance Carriers and Related Activities $3,805 $5,673 9.5% 478 18.1% 15,902 333 Machinery Manufacturing $5,156 $5,289 7.5% 1,256 11.0% 16,461 522 Credit Intermediation and Related Activities $3,208 $4,458 8.7% 616 15.7% 17,212 332 Fabricated Metal Product Manufacturing $2,663 $4,833 7.8% 375 18.4% 19,420 6113 Colleges, Universities, and Professional Schools $4,158 $5,626 7.7% 842 13.4% 22,312 423 Merchant Wholesalers, Durable Goods $3,552 $3,983 7.7% 1,021 14.4% 36,707 622 Hospitals $1,794 $3,509 8.4% 1,064 18.5% 56,671 6111 Elementary and Secondary Schools Average Monthly Earnings of Newly Hired Older Workers Average Monthly Earnings of Older Workers Percent of Newly Hired Older Workers Number of Newly Hired Older Workers Percent of Older Workers Number of Older Workers Industry July - September 2005 Best Industries for Employment of Older Workers (55-64 Years) in Illinois
- 5. $2,280 $3,489 5.3% 39 10.0% 930 321 Wood Product Manufacturing $1,429 $1,974 5.5% 65 9.2% 979 6116 Other Schools and Instruction $1,252 $2,671 9.9% 25 18.6% 1,000 315 Apparel Manufacturing $9,095 $6,398 4.3% 42 9.4% 1,201 518 Internet Service Providers and Data Processing Services $2,335 $3,182 3.6% 44 7.3% 1,206 492 Couriers and Messengers $1,623 $3,869 5.3% 64 8.9% 1,237 711 Performing Arts and Spectator Sports $2,635 $2,999 8.1% 64 14.0% 1,431 5615 Travel Arrangement and Reservation Services $3,235 $4,060 2.3% 67 5.5% 1,568 443 Electronics and Appliance Stores $2,391 $4,174 4.4% 84 8.6% 1,955 5419 Other Professional, Scientific, and Technical Services $1,420 $1,925 5.4% 168 8.6% 2,278 6244 Child Day Care Services $1,253 $2,037 4.9% 139 9.0% 2,420 451 Sporting Goods, Hobby, Book, and Music Stores $1,262 $1,756 6.7% 260 9.6% 2,612 447 Gasoline Stations $1,543 $2,167 3.2% 248 7.6% 4,334 448 Clothing and Clothing Accessories Stores $2,414 $3,540 4.3% 187 9.1% 4,524 446 Health and Personal Care Stores $1,468 $2,173 6.4% 349 9.8% 4,787 721 Accommodation $1,734 $2,662 6.2% 258 11.1% 5,342 444 Building Material and Garden Equipment $1,472 $2,164 5.3% 276 10.4% 5,805 812 Personal and Laundry Services $1,098 $2,060 5.4% 379 9.0% 7,648 713 Amusement, Gambling, and Recreation Industries $1,125 $1,626 2.8% 1,317 5.3% 19,623 722 Food Services and Drinking Places Average Monthly Earnings of Newly Hired Older Workers Average Monthly Earnings of Older Workers Percent of Newly Hired Older Workers Number of Newly Hired Older Workers Percent of Older Workers Number of Older Workers Industry July - September 2005 Worst Industries for Employment of Older Workers (55-64 Years) in Illinois