SlideShare una empresa de Scribd logo
1 de 13
Descargar para leer sin conexión
KANSAS 2012 DROUGHT UPDATE – March 2, 2012

Summary of Conditions and Changes for February 2012

        Although conditions are less severe than in January, Kansas drought declarations remain in effect due to
        significant moisture deficits reflected in very low soil moisture that has the potential to affect crops in the coming
        year.
        The U.S. Drought Monitor has remained constant for the past three weeks. Early February precipitation and the
        relatively low normal precipitation for this time of year have contributed to perceived improvement in central and
        eastern Kansas during early February. Despite improvements in regard to severity of drought, over 61 percent of
        the state remains abnormally dry.
        Administration of junior water rights to meet Minimum Desirable Stream flows remain in effect on the Little
        Arkansas above Alta Mills.  
         
Counties under Kansas drought stages and/or Federal Agriculture Disaster Declarations based on drought in 2011 are
shown on the map below. These remain in effect as the overall conditions for plant growth and deficits in precipitation
require careful consideration in planning for future water use and needs as well as crop and pasture conditions.


County Drought Declarations: A total of 100 counties are under state drought stages, with 40 counties in an emergency
stage, 23 in Warning and 37 in Watch. State Emergency allows public water suppliers aid and opportunities to supplement
their water supply, as well as provide opportunity for domestic and livestock water from emergency sources.
                                                                                                                            1 
 
Kansas Drought Emergency:
Allen, Barber, Barton, Butler, Chase, Clark, Coffey, Comanche, Cowley, Edwards, Finney, Ford, Grant, Gray,
Greenwood, Harper, Harvey, Haskell, Hodgeman, Kearny, Kingman, Kiowa, Lyon, Marion, McPherson, Meade, Morton,
Neosho, Pawnee, Pratt, Reno, Rice, Sedgwick, Seward, Stafford, Stanton, Stevens, Sumner, Wilson, Woodson

Kansas Drought Warning:
Anderson, Bourbon, Chautauqua, Cherokee, Crawford, Elk, Franklin, Gove, Greeley, Hamilton, Labette, Lane, Linn,
Logan, Miami, Montgomery, Morris, Ness, Osage, Scott, Trego, Wallace, Wichita

Kansas Drought Watch:
Cheyenne, Clay, Cloud, Decatur, Dickinson, Douglas, Ellis, Ellsworth, Geary, Graham, Jefferson, Jewel, Johnson,
Leavenworth, Lincoln, Marshall, Mitchell, Norton, Osborne, Ottawa, Phillips, Pottawatomie, Rawlins, Republic, Riley,
Rooks, Rush, Russell, Saline, Shawnee, Sheridan, Sherman, Smith, Thomas, Wabaunsee, Washington, Wyandotte

Federal: No federal agricultural disaster designations due to drought have been made so far in 2012. USDA agricultural
disaster declarations are based on anticipated crop losses, while Kansas drought stages are based primarily on water
resource conditions.

A total of 79 counties are designated federal agricultural disasters during 2011 (S3117, S3061, S3156, S3167 & S3189)
due to drought, high winds and excessive temperatures and are now eligible for federal programs, along with the
contiguous counties. The first 2011 designation (S3117) terminated January 10, 2012. The remaining 2011 designations
terminate throughout 2012 ending with S3198, centered in Oklahoma but including four Kansas counties as contiguous,
terminating July 9, 2012. Termination date refers to the deadline for applications for assistance such as loans for the
disaster. According to USDA, Kansas farmers have received $987.3 million for crops lost in 2011, with more claims
expected.

Major disaster declarations affecting Kansas:

Presidential Declarations
     Number               Description                                                               Termination Date
    • M4035               Flooding                                                                      05/23/2012
    • M4014               Severe Storms, Tornadoes, Straight-line Winds, and Flooding                   04/12/2012
    • M4012               Flooding                                                                      04/12/2012
    • M4010               Severe Storms, Straight-line Winds, Tornadoes, and Flooding                    03/29/2012

Secretarial Declarations
    Number                 Description                                                                 Termination Date
    • S3209                Severe storms with hail and high winds                                          08/08/2012
    • S3198                Drought and excessive heat                                                      07/09/2012
    • S3196                Severe storms with excessive rain, flash flooding, hail, and high winds         07/09/2012
    • S3189                Drought, excessive heat, and high winds                                         06/27/2012
    • S3186                Drought and excessive heat                                                      06/18/2012
    • S3173                High winds, hail, and a tornado                                                 05/29/2012
    • S3167                Drought, excessive heat, and high winds.                                        05/20/2012
    • S3164                Excessive rain and flooding                                                     05/15/2012
    • S3157                Excessive rain, high winds, hail, and flooding                                  04/25/2012
    • S3156                Drought, excessive heat, and high winds                                         04/25/2012
        S3139              The combined effects of drought, wildfires, excessive heat, excessive rain,
                             flooding, tornadoes, lightning, high winds, hail, blizzards, and freezes      03/27/2012
    •   S3134              Flooding                                                                        03/19/2012
    •   S3133              Drought                                                                         03/08/2012
    •   S3125              Drought                                                                         02/24/2012
    •   S3121              Drought, excessive heat, and high winds                                         02/23/2012

Up-to-date information regarding designated counties and assistance available due to these declarations is available here:
http://www.fema.gov/dhsusda/index.jsp.
                                                                                                                          2 
 
Brief explanations, program requirements and contact information for disaster relief programs are found at
http://www.disasterassistance.gov/federal-agency/2.

General Conditions
U.S. Drought Monitor for February 28 indicates near normal conditions in the northern portion of the State. This latest
Drought Monitor shows the same conditions as the previous two weeks, with the percentage of the state in each drought
category remaining the same. Biggest improvement during February was a reduction in the area covered by exceptional to
extreme drought (D3-D4) after the early month storms. The exceptional drought continues at 0.22 percent of the state.
Currently, just over 61 percent of the state is reported as abnormally dry to exceptional drought.

More information on the Drought Monitor categories can be found in a separate document under useful links on the KWO
drought page.

                                                               US Drought Monitor - February 28, 2012 


                                                               Climate (Precipitation and Temperature)
                                                               February was warmer than average. However, it was also
                                                               much wetter than normal across the state.

                                                                  Preliminary statewide average precipitation was 1.77
inches, which was 205 percent of normal. This makes it the 12th wettest February since 1895. The South Central division
was the wettest in overall precipitation at an average of 3.03 inches or 313 percent of normal. The Southwestern was the
driest, with an average precipitation of 0.60 inches or 113 percent of normal. Only five days saw no reports of
precipitation, and on 10 days the state-wide average was zero, with only isolated reports of moisture. Heaviest rains
occurred on February 3, with some flooding reported in South Central Kansas. This made substantial inroads on the
January deficits. Drought conditions changed little during the month.

Based on preliminary reports, the greatest total precipitation received in February from the National Weather Service
COOP network stations was 5.73 inches at Kingman, Kingman County. Greatest for the Community Collaborative Rain,
Hail and Snow Network (CoCoRaHS) in February was 4.60 inches at Medicine Lodge 0.4 WSW, Barber County. On the
low end of the NWS reporting stations, the lowest report was 0.24 inches at Sharon Springs in Wallace County. For the
CoCoRaHS network, the lowest amount was 0.21 inches at La Crosse 0.3 ENE in Rush County.

The month of February precipitation is summarized by the maps below by the High Plains Regional Climatic Center.


                                                                                                                      3 
 
The table below summarizes precipitation by climate division and various time periods. Please note that the data used in
  compiling is preliminary and comes from different sources. This may result in slight differences in the average or extreme
  values presented.

                                                  Kansas Climate Division Precipitation Summary (inches)

      Climate               February 1-29               January 1 to February 29        April 1 to February 29         September 1 to February 29
      Division    Actual    Normal    % Normal Actual         Normal    % Normal Actual      Normal    % Normal Actual         Normal    % Normal
Northwest            0.69      0.44         155        0.72     0.83        87       16.45     18.90       85           4.46    5.12         85
West Central         0.66      0.50         126        0.67     0.92        72       13.71     18.44       74           4.83    5.27         92
Southwest            0.60      0.52         113        0.62     0.91        67       10.63     18.12       59           5.51    5.22        107
North Central        1.50      0.68         217        1.61     1.21        131      22.75     24.92       90           5.61    8.10         67
Central              1.87      0.83         223        1.96     1.45        134      18.63     26.54       70           7.80    9.14         85
South Central        3.03      0.94         317        3.09     1.60        191      16.71     26.25       62           9.94    9.56        101
Northeast            2.31      0.91         253        2.37     1.77        134      26.15     32.87       79           9.51    12.19        78
East Central         2.40      1.02         242        2.43     2.05        123      21.72     34.18       64          10.05    13.25        78
Southeast            2.72      1.37         206        2.77     2.54        112      25.72     35.56       72          13.31    14.83        91
STATE                1.77      0.81         205        1.83     1.48        117      18.77     26.03       71          7.98      9.15       88
Note: 1971-2000 normal value, 100 % =normal
Source: KSU Weather Data Library


  The table below summarizes the period’s temperature conditions by climate division, compiled by KSU Weather Data
  library. Please note that the data used in compiling the table is preliminary and comes from different sources. This may
  result in slight differences in the average or extreme values presented.

                                        Kansas Climate Division Temperature Summary (degrees Fahrenheit)
                                                                           February 2012
                  Climate Division    Maximum     Minimum       Average Departure from Normal High               Day      Low      Day
                 Northwest              45.0        19.5          32.3             0.1             70            29        1       11
                 West Central           47.4        20.9          34.1             1.1             74            29        5       12
                 Southwest              49.4        24.3          36.8             1.7             77            29        8       11
                 North Central          37.9        18.0          28.0            -3.0             69            29        0        1
                 Central                49.1        24.2          36.6             3.5             72            29        4       12
                 South Central          49.7        26.2          37.9             2.6             75            23        9       11
                 Northeast              46.8        24.4          35.6             4.5             65            23        1       12
                 East Central           48.9        27.6          38.3             5.4             69            23        4       12
                 Southeast              51.4        28.8          40.1             4.5             71            23        9       11
                 STATE                  47.3        23.8          35.5             2.3             77            29        0        1
  The state-wide average temperature of 35.5 oF was 2.3 degrees warmer than normal. This marked it as the 43rd warmest
  February on record (1895-2011) for the state. The warmest February occurred in 1930, when the state-wide average
  temperature was 45.1 oF. February 1899 was the coolest with a statewide average temperature of 18.4 oF.

  The North Central division broke the above average pattern, with an average of 28 oF, which was 3 degrees cooler than
  normal. The Southeastern division, with an average of 40.1 oF was the warmest at 4.5 degrees above normal. The warmest
  temperatures were seen at the end of the month. The highest reading was 77 oF at Ashland (Clark County) on the 29th.
  Daily record high was set at only one location, Perry Lake (Jefferson County) on the 6th. On the low temperature side, no
  record lows were set, but 4 record high minimums were seen. The coldest reading for the month was 0 oF at Burr Oak
  (Jewell County) on the 1st.

  Average monthly temperatures at individual reporting locations ranged from 45.5 oF at Great Bend (Barton County) to
  30.4 oF at Norton (Norton County). The highest temperature recorded in Kansas during February was 77 oF at Ashland
  (Clark County) on the 29th. The coldest reading observed in the state during February was 0 oF at Burr Oak (Jewell
  County) on the 1st.

  The following maps show average monthly temperature and the departure from normal across Kansas during February.

                                                                                                                                                  4 


The table below summarizes February temperature and precipitation conditions by climate division while Appendix A provides the
February summary for principal reporting locations within and adjacent to Kansas. Please note that the data used in compiling Table 1
and Appendix A is preliminary and comes from different sources. This may result in slight differences in the average or extreme
values presented.

                                           Kansas Climate Division Summary-Departures from Normal
                                                      Precipitation (inches)                                      Temperature (oF)
                                     February 2012                      2012 through February                                 Monthly Extremes
                                      Departure                               Departure                        Departure
                                         from           %                        from         %                  from
    Climate Division       Total       Normal 1      Normal        Total       Normal 1    Normal    Ave       Normal 1          Max        Min
    Northwest                 0.69           0.25          155         0.72         -0.11        87  32.3               0.1          70         1
    West Central              0.66           0.16          126         0.67         -0.25        72  34.1               1.1          74         5
    Southwest                 0.60           0.08          113         0.62         -0.29        67  36.8               1.7          77         8
    North Central             1.50           0.82          217         1.61          0.40       131  28.0             -3.0           69         0
    Central                   1.87           1.04          223         1.96          0.51       134  36.6               3.5          72         4
    South Central             3.03           2.09          317         3.09          1.49       191  37.9               2.6          75         9
    Northeast                 2.31           1.40          253         2.37          0.60       134  35.6               4.5          65         1
    East Central              2.40           1.38          242         2.43          0.38       123  38.3               5.4          69         4
    Southeast                 2.72           1.35          206         2.77          0.23       112  40.1               4.5          71         9
    STATE                     1.77           0.96          205         1.83          0.35       117  35.5               2.3          77         0
    1. Departure from 1981-2010 normal value
    2. State Highest temperature: 77 oF at Ashland (Clark County) on the 29th.
    3. State Lowest temperature: 0 oF at Burr Oak (Jewell County) on the 1st.
    4. 4. Greatest 24hr rainfall: 4.30 inches on the 4th at Kingman 2.5 SW , Kingman County (CoCoRaHS); 3.35 inches on the 4th at Medicine Lodge
    1E, Barber County (NWS)
    Source: KSU Weather Data Library

The Palmer Drought Severity Index (PDSI) is a meteorological drought index, and it responds to weather conditions that
have been abnormally dry or abnormally wet. The PDSI is calculated based on precipitation and temperature data, as well
as the local Available Water Content (AWC) of the soil. The table below summarizes conditions by climate division.
Please note that the data used in compiling is preliminary and comes from different sources. This may result in slight
differences in the average or extreme values presented.

The statewide average PDSI for the week ending February 28th was 1.17 (near normal). Divisional PDSI values ranged
from -0.09 in the Southwestern division, which translates to near normal, to 2.17 in the South Central division, which
corresponds to unusually moist.


                                                                                                                                               5 
 
Public Water Supply Conditions
A Memorandum of Understanding (MOU) for emergency use of state fishing lake water under conditions of drought
emergency declared by the Governor is in place. This will allow communities and individuals within the emergency
counties category to pump water from named state fishing lakes if they are in dire need of water. Individuals and
communities need to contact the KWO for a water supply request and they will in turn be referred to the appropriate
Kansas Department of Wildlife, Parks and Tourism office to obtain the necessary permit to withdraw the water. The MOU
limits the types of water use and a fee may be set for use of the state fishing lakes’ water supply. This MOU establishes a
use priority of domestic, municipal and then livestock uses, while also protecting the lake’s fish population.

The State Fishing Lakes available for withdrawals for Emergency Declared counties include Atchison, Barber, Brown,
Bourbon, Butler, Chase, Clark, Crawford, Goodman, Jewell, Kingman, Leavenworth, Lyon, Pott#1, Pott#2, McPherson,
Miami, Mined Lands (Pits), Neosho, Osage, Ottawa, Saline, Scott, Shawnee, Sheridan, Washington, Wilson and Woodson
Lakes.

Additional water may also be available for Drought Emergency counties from federal lakes. Water from U.S. Army Corps
of Engineer lakes is available for domestic, industrial and livestock use but is prohibited for irrigation use. Requests from
applicants must go through the KWO. It may also be possible to obtain water under surplus contracts from State owned
storage in certain Corps lakes with water available for purchase. Bureau of Reclamation lake water may also be made
available by temporary contract under drought conditions

Local Public Water Supply Status
Throughout the past year of drought, at least 38 public water suppliers in 22 counties initiated conservation measures due
to drought conditions. These include municipal, rural water districts and a community college. Many of these have lifted
restrictions. Although some precipitation has occurred, suppliers are cautioned that supplies remain lower than normal for
the time of year. Review of existing supplies and conservation triggers is recommended to all public water suppliers in
drought affected counties.

Other Water Supply Conditions
In eastern Kansas, the primary source of water is surface water including: rivers, federal reservoirs, multipurpose small
lakes and municipal lakes. Many federal reservoirs store water for public water supply and other uses. The lakes which
have water supply through the Water Marketing and/or Water Assurance programs include Big Hill, Clinton, Council
Grove, Elk City, Hillsdale, John Redmond, Kanopolis, Marion, Melvern, Milford, Pomona, Perry and Tuttle Creek. Cedar
Bluff, Glen Elder and Keith Sebelius reservoirs also contain supply water for a community.

In lakes where all state owned water is not under contract, it may be possible to negotiate for an emergency water supply.

As of March 1, 2012 no releases are being made from state storage in federal reservoirs for downstream needs.

General Reservoir Conditions


                                                                                                                             6 
 
Kansas Federal Reservoir Conservation Pool Levels
                               Top of Multipurpose/Conservation Pool   Multipurpose/Conservation       Change from Top of
              Reservoir                       (Feet MSL)               Pool Elevation (Feet MSL)           Pool (Feet)
                            Kansas River Basin                                 3/01/2012
       Norton1                                  2304.3                          2298.90                       -5.40
       Harlan County, NE                         1946                           1947.21                        1.21
       Lovewell1                                1582.6                          1582.22                       -0.38
       Milford1                                 1144.4                          1144.66                        0.26
       Cedar Bluff                               2144                           2126.33                      -17.67
       Kanopolis1                                1463                           1463.15                        0.15
       Wilson1                                   1516                           1515.68                       -0.32
       Webster1                                 1892.5                          1888.22                       -4.28
       Kirwin1                                  1729.3                          1729.37                        0.07
       Waconda1                                 1455.6                          1454.48                       -1.12
       Tuttle Creek1                             1075                           1075.22                        0.22
       Perry1                                    891.5                           891.19                       -0.31
       Clinton1                                  875.5                           874.11                       -1.39
       Melvern1                                  1036                           1033.73                       -2.27
       Pomona1                                    974                            973.79                       -0.21
       Hillsdale1                                 917                            915.39                       -1.61
                           Arkansas River Basin                                3/01/2012
       Cheney                                   1421.6                          1418.75                       -2.85
       El Dorado                                 1339                           1336.67                       -2.33
       Toronto1                                  901.5                           901.93                       0.43
       Fall River1                               948.5                           950.01                       1.51
       Elk City1                                  796                            797.22                        1.22
       Big Hill                                   858                            857.56                       -0.44
       Council Grove1                            1274                           1274.59                        0.59
       Marion1                                  1350.5                          1348.71                       -1.79
       John Redmond1                             1039                           1041.52                        2.52
       1. Lake level management plan in place                                           Source: U.S. Army Corps of Engineers


Streamflow Conditions
The comparison of streamflow for March 1, 2012 for all days of the year is shown on the map below. Recent flow is
compared to the historical streamflow in Kansas for the past 45 days on the USGS graph. Both indicate below normal
streamflows.

USGS seven day average stream flow compared to normal flow values recorded for all days of the year during all years
measurements have been collected. In general, a streamflow which is greater than the 75 percentile is considered above
normal, a streamflow which is between 25 and 75 percentiles is considered normal and a streamflow which is less than
the 25 percentile is considered below normal. Color codes are for basins with streamflow averages less than 25 percent of
historic values.
                  Historical Stream Flow Compared to Year


                                                                                                                               7 
 
Water Right Administration/Minimum Desirable Streamflow (MDS)
Minimum Desirable Streamflow (MDS) administration has ended on all streams except a portion of the Little Arkansas
River above Alta Mills.

The table below shows the gage name for the location on the map where administration is occuring, as well as providing
flows in cubic feet per second (cfs) at selected gaging stations as of February 16 for streams where MDS is of interest.

                                           Streamflows in Cubic Feet per Second (cfs)
                                                                                         ADMINISTRATION
                                                            March 1, Flow   March MDS
                Gaging Station                                                               STATUS
                Republican River at Concordia                   411            150
                Republican River at Clay Center                 577            200
                Smoky Hill River at Ellsworth                   21             25
                Little Arkansas River at Alta Mills             704             8              5/12/11

Little Arkansas River: Orders were effective May 12 and July 13 requiring cessation of pumping on sections of the Little
Arkansas River. These orders pertain to the basin which drains to the Little Arkansas River between Alta Mills and Valley
Center respectively. The orders have been lifted above Valley Center but remain in effect for 8 water rights above Alta
Mills.

Burn Bans and Fires
Most counties require permits prior to a burn and are controlling burns through that process. A county issues a ban as they
deem necessary at any time, for a specific time period or until repealed. Dry conditions in much of Kansas allow fires to
start or spread easily. Please contact your county officials before you burn. Conditions continue that allow fires to start
easily. The outlooks change daily. See http://www.spc.noaa.gov/fire/ for current information.

Kansas Vegetative Conditions
                                                                            The green colors on the GreenReport map this
                                                                            week indicate areas where winter wheat is
                                                                            sitting dormant in the fields. Most areas in
                                                                            between remain in the yellow color/watch
                                                                            category, as dry conditions have prevailed thru
                                                                            the winter. (Kansas Applied Remote Sensing
                                                                            Program)

                                                                            Appendix B also shows the plant conditions.

                                                                            Crops, Feed and Livestock
                                                                            USDA Crop Progress and Condition reports
                                                                            are issued monthly during winter. The most
                                                                            recent report, February 27, 2012, reports
                                                                            topsoil moisture supplies improved during the
                                                                            month to 11 percent very short, 25 percent
                                                                            short, 62 percent adequate, and 2 percent
                                                                            surplus. A year ago, topsoil moisture supplies
                                                                            were 20 percent very short, 23 percent short,
                                                                            49 percent adequate, and 8 percent surplus.

The range and pasture condition was rated 29 percent very poor, 25 percent poor, 32 percent fair, and 14 percent good,
which indicated a slight increase from January but still significantly worse than last year at this time. Feed grain supplies
in Kansas were rated at 10 percent very short, 18 percent short, 69 percent adequate, and 3 percent surplus, while hay and
forage supplies were rated at 26 percent very short, 28 percent short, 44 percent adequate, and 2 percent surplus. The
stock water supplies improved to 10 percent very short, 19 percent short, 70 percent adequate, and 1 percent surplus.
                                                                                                                           8 
 
Emergency Haying and Grazing
Emergency haying and grazing of CRP acreage were authorized in 2011 to provide relief to livestock producers in areas
affected by a severe drought or similar natural disaster. If conditions warrant, authorization will need to be issued again in
2012 to allow emergency haying and grazing and other federal program aid for livestock feed.

USDA Risk Management Agency provides information on crop insurance and drought damaged crops can be found at
http://www.rma.usda.gov/fields/ks_rso/2011/droughtfaq.pdf.

Future Outlook
The March 1 – May 31, 2012 U.S. Seasonal Drought Outlook by the Climate Prediction Center (CPC) indicates drought
conditions are expected to continue in the southern portions of the state. The central and southern High Plains has been
fairly dry during the past few weeks. Some improvement is possible in extreme eastern and southeastern Kansas. For
precipitation, the updated CPC monthly outlook, as well as the seasonal outlook for March favors below-median
precipitation across the all but eastern Kansas, and above median temperatures. The La Niña continues and is expected to
influence the precipitation patterns into the spring, with drier than normal conditions expected across the Southern Plains.


                                                                                                                            9 
 
NOAA outlook for the next 14 days and three months:


The Kansas Weekly Climate Summary and Drought Report is compiled at least monthly, more frequently when
conditions warrant, by the Kansas Water Office (KWO). Information from various federal, state, local and academic
sources is used. Some of the data is preliminary and subject to change once final data is available. The KWO web site,
KWO Drought, contains additional drought information including links to other agencies with drought information and
past issues of the Kansas Climate Summary and Drought Report. Kansas State Climatologist, Mary Knapp, is the primary
source of the narrative on weather. She works closely with meteorologists throughout the state and region. Details of
current conditions at Evapotranspiration (ET) and Mesonet sites across Kansas are available at http://www.ksre.k-
state.edu/wdl/.


                                                                                                                   10 
 
RESOURCES and ACTIVITIES
The U.S. Drought Monitor, from the National Drought Mitigation Center at the University of Nebraska-Lincoln, provides
    a “big picture” perspective of conditions across the nation. In the Kansas county drought stage scheme, a Drought
    Watch equates roughly to moderate drought in the U.S. Drought Monitor, while a Drought Warning is the equivalent
    of severe drought. A Drought Emergency is reserved for extreme or exceptional drought. Palmer Drought Severity
    Index - The Palmer Index (PDSI) is one indicator used in the U.S. Drought Monitor.
The High Plains Regional Climate Center provides precipitation and temperature summary maps.
The U.S. Geological Survey (USGS) Drought Watch provides information on 7-day average streamflow measured at
    long-term gaging stations and compares them to normal flows.
The Kansas Department of Agriculture-Division of Water Resources monitors stream flow using the USGS gages for
    determination of administrative needs. Administration may be needed due to Minimum Desirable Streamflow (MDS)
    requirements, impairments, and reservoir release protection.
The water levels of the federal lakes fluctuate during a year according to the management plan. Lake level Management
    plans are posted on the Kansas Water Office web site www.kwo.org.
The Kansas Applied Remote Sensing Program (KARS) at the University of Kansas produces a Kansas Green Report each
    week during the growing season. For a full set of national and regional GreenReport® maps, go to:
    http://www.kars.ku.edu/products/greenreport/greenreport.shtml. This Kansas Vegetation Drought Response Index
    map is developed weekly by the Kansas Biological Survey using state drought triggers as its key. In addition the
    Vegetation Drought Response Index, by the National Drought Mitigation Center provides another a national
    perspective on vegetation conditions. VegDRI maps may be found at http://vegdri.unl.edu/
The National Weather Service (NWS) provides fire weather products and services for Kansas that include the Rangeland
    Fire Danger Index, Fire Weather Forecasts, Red Flag Watches/Warnings, and Spot Forecasts. The five NWS offices
    that serve Kansas websites may be accessed from the NWS Offices’ page.
The Seasonal Drought Outlook, developed by the NOAA Climate Prediction Center (NOAA CPC), assesses the
    likelihood for improvement, persistence or deterioration in drought conditions for areas currently experiencing
    drought as identified by the U.S. Drought Monitor. Also see:
       http://www.ncdc.noaa.gov/oa/climate/research/dm/weekly-dm-animations.html
Responding to Drought: A Guide for City, County and Water System Officials provides an overview of Kansas county
    drought stage declarations, local planning and coordination, disaster declarations, and available state and federal
    assistance. The 2007 Municipal Water Conservation Plan Guidelines and the Drought Vulnerability Assessment
    Report, both by Kansas Water Office, provide guidance regarding drought preparedness and response.
USDA has programs for agricultural producers and businesses for drought affected areas. In some cases a eligibility is
    dependent on a federal disaster declaration but other programs are triggered by specific conditions.

Please contact Diane Coe at the Kansas Water Office (785) 296-3185 or diane.coe@kwo.ks.gov should you have any
questions or suggestions.


                                                                                                                    11 
 
Appendix A


                                                   February 2012 Summary
                                       Precipitation (inches)                            Temperature oF
                                                                                                    Extreme (Date)
                                                          Percent
    Station1                      Total     Departure     Normal       Mean       Departure       Highest        Lowest
                West
    Burlington, CO                  0.43          0.01     102%          30.8           -0.8          65 (22)         6 (8)
    Dodge City                      0.96          0.28     141%          36.5            0.6          73 (28)        9 (11)
    Garden City                     0.37         -0.17       69%         35.7            0.9          72 (22)        9 (11)
    Goodland                        0.42         -0.07       86%         32.7            0.4          67 (22)        1 (11)
    Guymon, OK                      0.31         -0.16       66%         38.5           -0.1          76 (22)    16 (11, 8)
    Hill City                       0.67          0.15     129%          33.9            1.0      0.9671 (28)        3 (12)
    Lamar, CO                       0.20         -0.17       54%         35.5            1.9          75 (25)      12 (27)
    McCook, NE                      0.37         -0.25       60%         32.2            1.3          66 (28)        3 (11)
    Springfield, CO                 0.22         -0.22       50%         35.4            0.0          71 (22)        12 (8)
               Central
    Concordia                       2.28          1.49     289%          36.1            3.4          64 (22)    4 (12, 11)
    Hebron, NE
    Medicine Lodge                  4.96          3.92     447%          39.7            1.5          73 (22)        12 (11)
    Ponca City, OK                  2.48          1.14     185%          41.8            2.1          71 (22)        14 (12)
    Salina                          2.02          0.85     173%          37.6            2.1          69 (22)         7 (11)
    Wichita (ICT)                   3.57          2.39     303%          40.5            3.3          74 (22)        12 (11)
                East
    Bartlesville, OK                2.73          0.75     138%          42.3            2.5          75 (22)       9 (12)
    Chanute                         2.57          0.67     135%          40.8            3.4          68 (22)      10 (12)
    Fall City, NE                   1.95          1.01     207%          35.2            4.3            63 (1)      1 (12)
    Johnson Co. Exec. Apt           0.58         -0.99       37%         39.4            4.6          63 (28)       7 (12)
    Joplin, MO                      2.58          0.26     111%          42.7            2.9          72 (28)       8 (12)
    Kansas City (MCI), MO           3.13          1.67     214%          38.1            4.6            63 (1)   5 (12,11)
    St. Joseph, MO                  2.28          1.35     245%          36.4            4.4         63 (26,1)      2 (12)
    Topeka (TOP                     2.72           1.4     206%          39.9            5.5          66 (26)       8 (12)
    1. Airport Automated Observation Stations (NWS/FAA)
    2. Departure from 1981-2010 normal value
    T - Trace; M - Missing; --- no normal value from which to calculate departure or percent of normal
    Source: National Weather Service F-6 Climate Summaries


                                                                                                                               12 
 
Appendix B


Compared to the 23-year average at this time for Kansas, this year’s Vegetation Condition Report for February 17 – 30 from K-State’s
Ecology and Agriculture Spatial Analysis Laboratory shows that photosynthetic activity continues to be greater than would be expected.
This is especially true from Central to South Central KS, and parts of Southeastern KS. Warmer temperatures have resulted in more
photosynthetic activity than is common at this time of the year.


                                                                                                                                 13 
 

Más contenido relacionado

Similar a Kansas 2012 Drought Update - Kansas Water Office

Montana Fire Season Official Outlook 2013
Montana Fire Season Official Outlook 2013 Montana Fire Season Official Outlook 2013
Montana Fire Season Official Outlook 2013 Clark Fork Task Force
 
Derek Arndt - Water Crisis March 11, 2013
Derek Arndt  - Water Crisis March 11, 2013Derek Arndt  - Water Crisis March 11, 2013
Derek Arndt - Water Crisis March 11, 2013Celia Perkins
 
Evidences of climate change and drought
Evidences of climate change and droughtEvidences of climate change and drought
Evidences of climate change and droughtSunil Kumar
 
Climate Change Impact On Coffee Production Uganda
Climate Change   Impact On Coffee Production UgandaClimate Change   Impact On Coffee Production Uganda
Climate Change Impact On Coffee Production UgandaPaulo Henrique Leme
 
Climate Change Impact On Coffee Production Uganda
Climate Change   Impact On Coffee Production UgandaClimate Change   Impact On Coffee Production Uganda
Climate Change Impact On Coffee Production UgandaPaulo Henrique Leme
 
Climate Change Impact On Coffee Production Uganda
Climate Change   Impact On Coffee Production UgandaClimate Change   Impact On Coffee Production Uganda
Climate Change Impact On Coffee Production UgandaPaulo Henrique Leme
 
Climate Change: Implications for the Homeland
Climate Change: Implications for the HomelandClimate Change: Implications for the Homeland
Climate Change: Implications for the HomelandAmerican Security Project
 
Pacific Northwest Snowpack & Water Supply Update
Pacific Northwest Snowpack & Water Supply UpdatePacific Northwest Snowpack & Water Supply Update
Pacific Northwest Snowpack & Water Supply UpdateDRIscience
 
Local and global factors affecting vegetation growth
Local and global factors affecting vegetation growthLocal and global factors affecting vegetation growth
Local and global factors affecting vegetation growthjodiecmills
 
Monthly seasonal outlook
Monthly seasonal outlookMonthly seasonal outlook
Monthly seasonal outlookclimate central
 
Drought & Desertification measures of mitigation ,Types of drought
Drought & Desertification measures of mitigation ,Types of drought Drought & Desertification measures of mitigation ,Types of drought
Drought & Desertification measures of mitigation ,Types of drought SANDEEP PATRE
 
Maaz
MaazMaaz
Maazihsl
 
Rangeland Climate Change Information
Rangeland Climate Change InformationRangeland Climate Change Information
Rangeland Climate Change InformationNinti_One
 
El Nino, the Twisted Atlantic and the Effect on Global Agriculture
El Nino, the Twisted Atlantic and the Effect on Global AgricultureEl Nino, the Twisted Atlantic and the Effect on Global Agriculture
El Nino, the Twisted Atlantic and the Effect on Global AgricultureGrey Bruce Farmers Week
 
Research paper final draft
Research paper final draftResearch paper final draft
Research paper final draftAndrewJBaker
 

Similar a Kansas 2012 Drought Update - Kansas Water Office (20)

Montana Fire Season Official Outlook 2013
Montana Fire Season Official Outlook 2013 Montana Fire Season Official Outlook 2013
Montana Fire Season Official Outlook 2013
 
Unit 6 Climate in Rwanda.pptx
Unit 6 Climate in Rwanda.pptxUnit 6 Climate in Rwanda.pptx
Unit 6 Climate in Rwanda.pptx
 
Derek Arndt - Water Crisis March 11, 2013
Derek Arndt  - Water Crisis March 11, 2013Derek Arndt  - Water Crisis March 11, 2013
Derek Arndt - Water Crisis March 11, 2013
 
Evidences of climate change and drought
Evidences of climate change and droughtEvidences of climate change and drought
Evidences of climate change and drought
 
Climate Change Impact On Coffee Production Uganda
Climate Change   Impact On Coffee Production UgandaClimate Change   Impact On Coffee Production Uganda
Climate Change Impact On Coffee Production Uganda
 
Climate Change Impact On Coffee Production Uganda
Climate Change   Impact On Coffee Production UgandaClimate Change   Impact On Coffee Production Uganda
Climate Change Impact On Coffee Production Uganda
 
Climate Change Impact On Coffee Production Uganda
Climate Change   Impact On Coffee Production UgandaClimate Change   Impact On Coffee Production Uganda
Climate Change Impact On Coffee Production Uganda
 
Climate Change: Implications for the Homeland
Climate Change: Implications for the HomelandClimate Change: Implications for the Homeland
Climate Change: Implications for the Homeland
 
Pacific Northwest Snowpack & Water Supply Update
Pacific Northwest Snowpack & Water Supply UpdatePacific Northwest Snowpack & Water Supply Update
Pacific Northwest Snowpack & Water Supply Update
 
Local and global factors affecting vegetation growth
Local and global factors affecting vegetation growthLocal and global factors affecting vegetation growth
Local and global factors affecting vegetation growth
 
weather hazards
weather hazards weather hazards
weather hazards
 
Monthly seasonal outlook
Monthly seasonal outlookMonthly seasonal outlook
Monthly seasonal outlook
 
Drought & Desertification measures of mitigation ,Types of drought
Drought & Desertification measures of mitigation ,Types of drought Drought & Desertification measures of mitigation ,Types of drought
Drought & Desertification measures of mitigation ,Types of drought
 
2013 ATLANTIC BASIN HURRICANE SEASON 1 June – 30 December
2013  ATLANTIC BASIN HURRICANE SEASON   1 June – 30 December2013  ATLANTIC BASIN HURRICANE SEASON   1 June – 30 December
2013 ATLANTIC BASIN HURRICANE SEASON 1 June – 30 December
 
Maaz
MaazMaaz
Maaz
 
Rangeland Climate Change Information
Rangeland Climate Change InformationRangeland Climate Change Information
Rangeland Climate Change Information
 
Climate Change and Upper Michigan’s Forests: Risks, Opportunities, and Ways ...
Climate Change and Upper Michigan’s Forests: Risks, Opportunities, and Ways ...Climate Change and Upper Michigan’s Forests: Risks, Opportunities, and Ways ...
Climate Change and Upper Michigan’s Forests: Risks, Opportunities, and Ways ...
 
Connecticut Forestry in a Changing Climate
Connecticut Forestry in a Changing ClimateConnecticut Forestry in a Changing Climate
Connecticut Forestry in a Changing Climate
 
El Nino, the Twisted Atlantic and the Effect on Global Agriculture
El Nino, the Twisted Atlantic and the Effect on Global AgricultureEl Nino, the Twisted Atlantic and the Effect on Global Agriculture
El Nino, the Twisted Atlantic and the Effect on Global Agriculture
 
Research paper final draft
Research paper final draftResearch paper final draft
Research paper final draft
 

Más de Farica46m

How Dry Seasons Affect Landscape Plants - University of Kentucky
How Dry Seasons Affect Landscape Plants - University of KentuckyHow Dry Seasons Affect Landscape Plants - University of Kentucky
How Dry Seasons Affect Landscape Plants - University of KentuckyFarica46m
 
How to Garden During Drought Conditions - Penn State
How to Garden During Drought Conditions - Penn StateHow to Garden During Drought Conditions - Penn State
How to Garden During Drought Conditions - Penn StateFarica46m
 
How to Landscape with Native Plants at Home - James River Association, Virginia
How to Landscape with Native Plants at Home - James River Association, VirginiaHow to Landscape with Native Plants at Home - James River Association, Virginia
How to Landscape with Native Plants at Home - James River Association, VirginiaFarica46m
 
How to Reduce Drought Risk - University of Nebraska
How to Reduce Drought Risk - University of NebraskaHow to Reduce Drought Risk - University of Nebraska
How to Reduce Drought Risk - University of NebraskaFarica46m
 
Illinois Greenacres: Natural Landscaping Resource List
Illinois Greenacres: Natural Landscaping Resource ListIllinois Greenacres: Natural Landscaping Resource List
Illinois Greenacres: Natural Landscaping Resource ListFarica46m
 
Illinois Native Landscaping Book Recommendations
Illinois Native Landscaping Book RecommendationsIllinois Native Landscaping Book Recommendations
Illinois Native Landscaping Book RecommendationsFarica46m
 
Indiana Greenacres: Natural Landscaping Resource List
Indiana Greenacres: Natural Landscaping Resource ListIndiana Greenacres: Natural Landscaping Resource List
Indiana Greenacres: Natural Landscaping Resource ListFarica46m
 
Indigenous Gardening - South Africa
Indigenous Gardening - South AfricaIndigenous Gardening - South Africa
Indigenous Gardening - South AfricaFarica46m
 
Intensive Vegetable Gardening - New Hampshire University
Intensive Vegetable Gardening - New Hampshire University Intensive Vegetable Gardening - New Hampshire University
Intensive Vegetable Gardening - New Hampshire University Farica46m
 
Introduction to Rainharvesting Greywater Reuse Water-Efficient Gardening - Ne...
Introduction to Rainharvesting Greywater Reuse Water-Efficient Gardening - Ne...Introduction to Rainharvesting Greywater Reuse Water-Efficient Gardening - Ne...
Introduction to Rainharvesting Greywater Reuse Water-Efficient Gardening - Ne...Farica46m
 
Irrigate for the Future - Save, Cypriot
Irrigate for the Future - Save, CypriotIrrigate for the Future - Save, Cypriot
Irrigate for the Future - Save, CypriotFarica46m
 
Irrigating the Vegetable Garden - Colorado University
Irrigating the Vegetable Garden - Colorado UniversityIrrigating the Vegetable Garden - Colorado University
Irrigating the Vegetable Garden - Colorado UniversityFarica46m
 
Irrigation for A Growing World: the Intelligent Use of Water
Irrigation for A Growing World: the Intelligent Use of WaterIrrigation for A Growing World: the Intelligent Use of Water
Irrigation for A Growing World: the Intelligent Use of WaterFarica46m
 
Irrigation Systems and Irrigation Management in Xeric Gardens - New Mexico St...
Irrigation Systems and Irrigation Management in Xeric Gardens - New Mexico St...Irrigation Systems and Irrigation Management in Xeric Gardens - New Mexico St...
Irrigation Systems and Irrigation Management in Xeric Gardens - New Mexico St...Farica46m
 
Is Your Home Waterwise, It's Easy to Find Out - Redwood City, California
Is Your Home Waterwise, It's Easy to Find Out - Redwood City, CaliforniaIs Your Home Waterwise, It's Easy to Find Out - Redwood City, California
Is Your Home Waterwise, It's Easy to Find Out - Redwood City, CaliforniaFarica46m
 
Is Your Yard Water Efficient - Holliston, Massachusetts
Is Your Yard Water Efficient - Holliston, MassachusettsIs Your Yard Water Efficient - Holliston, Massachusetts
Is Your Yard Water Efficient - Holliston, MassachusettsFarica46m
 
Kansas Garden Guide Manual - Kansas State University
Kansas Garden Guide Manual - Kansas State UniversityKansas Garden Guide Manual - Kansas State University
Kansas Garden Guide Manual - Kansas State UniversityFarica46m
 
Kansas Native Plant Landscaping Fact Sheet
Kansas Native Plant Landscaping Fact SheetKansas Native Plant Landscaping Fact Sheet
Kansas Native Plant Landscaping Fact SheetFarica46m
 
Lady Banks Rose: A Waterwise Plant - Oregon
Lady Banks Rose: A Waterwise Plant - OregonLady Banks Rose: A Waterwise Plant - Oregon
Lady Banks Rose: A Waterwise Plant - OregonFarica46m
 
Landscape Design for Water Conservation - University of Florida
Landscape Design for Water Conservation - University of FloridaLandscape Design for Water Conservation - University of Florida
Landscape Design for Water Conservation - University of FloridaFarica46m
 

Más de Farica46m (20)

How Dry Seasons Affect Landscape Plants - University of Kentucky
How Dry Seasons Affect Landscape Plants - University of KentuckyHow Dry Seasons Affect Landscape Plants - University of Kentucky
How Dry Seasons Affect Landscape Plants - University of Kentucky
 
How to Garden During Drought Conditions - Penn State
How to Garden During Drought Conditions - Penn StateHow to Garden During Drought Conditions - Penn State
How to Garden During Drought Conditions - Penn State
 
How to Landscape with Native Plants at Home - James River Association, Virginia
How to Landscape with Native Plants at Home - James River Association, VirginiaHow to Landscape with Native Plants at Home - James River Association, Virginia
How to Landscape with Native Plants at Home - James River Association, Virginia
 
How to Reduce Drought Risk - University of Nebraska
How to Reduce Drought Risk - University of NebraskaHow to Reduce Drought Risk - University of Nebraska
How to Reduce Drought Risk - University of Nebraska
 
Illinois Greenacres: Natural Landscaping Resource List
Illinois Greenacres: Natural Landscaping Resource ListIllinois Greenacres: Natural Landscaping Resource List
Illinois Greenacres: Natural Landscaping Resource List
 
Illinois Native Landscaping Book Recommendations
Illinois Native Landscaping Book RecommendationsIllinois Native Landscaping Book Recommendations
Illinois Native Landscaping Book Recommendations
 
Indiana Greenacres: Natural Landscaping Resource List
Indiana Greenacres: Natural Landscaping Resource ListIndiana Greenacres: Natural Landscaping Resource List
Indiana Greenacres: Natural Landscaping Resource List
 
Indigenous Gardening - South Africa
Indigenous Gardening - South AfricaIndigenous Gardening - South Africa
Indigenous Gardening - South Africa
 
Intensive Vegetable Gardening - New Hampshire University
Intensive Vegetable Gardening - New Hampshire University Intensive Vegetable Gardening - New Hampshire University
Intensive Vegetable Gardening - New Hampshire University
 
Introduction to Rainharvesting Greywater Reuse Water-Efficient Gardening - Ne...
Introduction to Rainharvesting Greywater Reuse Water-Efficient Gardening - Ne...Introduction to Rainharvesting Greywater Reuse Water-Efficient Gardening - Ne...
Introduction to Rainharvesting Greywater Reuse Water-Efficient Gardening - Ne...
 
Irrigate for the Future - Save, Cypriot
Irrigate for the Future - Save, CypriotIrrigate for the Future - Save, Cypriot
Irrigate for the Future - Save, Cypriot
 
Irrigating the Vegetable Garden - Colorado University
Irrigating the Vegetable Garden - Colorado UniversityIrrigating the Vegetable Garden - Colorado University
Irrigating the Vegetable Garden - Colorado University
 
Irrigation for A Growing World: the Intelligent Use of Water
Irrigation for A Growing World: the Intelligent Use of WaterIrrigation for A Growing World: the Intelligent Use of Water
Irrigation for A Growing World: the Intelligent Use of Water
 
Irrigation Systems and Irrigation Management in Xeric Gardens - New Mexico St...
Irrigation Systems and Irrigation Management in Xeric Gardens - New Mexico St...Irrigation Systems and Irrigation Management in Xeric Gardens - New Mexico St...
Irrigation Systems and Irrigation Management in Xeric Gardens - New Mexico St...
 
Is Your Home Waterwise, It's Easy to Find Out - Redwood City, California
Is Your Home Waterwise, It's Easy to Find Out - Redwood City, CaliforniaIs Your Home Waterwise, It's Easy to Find Out - Redwood City, California
Is Your Home Waterwise, It's Easy to Find Out - Redwood City, California
 
Is Your Yard Water Efficient - Holliston, Massachusetts
Is Your Yard Water Efficient - Holliston, MassachusettsIs Your Yard Water Efficient - Holliston, Massachusetts
Is Your Yard Water Efficient - Holliston, Massachusetts
 
Kansas Garden Guide Manual - Kansas State University
Kansas Garden Guide Manual - Kansas State UniversityKansas Garden Guide Manual - Kansas State University
Kansas Garden Guide Manual - Kansas State University
 
Kansas Native Plant Landscaping Fact Sheet
Kansas Native Plant Landscaping Fact SheetKansas Native Plant Landscaping Fact Sheet
Kansas Native Plant Landscaping Fact Sheet
 
Lady Banks Rose: A Waterwise Plant - Oregon
Lady Banks Rose: A Waterwise Plant - OregonLady Banks Rose: A Waterwise Plant - Oregon
Lady Banks Rose: A Waterwise Plant - Oregon
 
Landscape Design for Water Conservation - University of Florida
Landscape Design for Water Conservation - University of FloridaLandscape Design for Water Conservation - University of Florida
Landscape Design for Water Conservation - University of Florida
 

Último

Judging the Relevance and worth of ideas part 2.pptx
Judging the Relevance  and worth of ideas part 2.pptxJudging the Relevance  and worth of ideas part 2.pptx
Judging the Relevance and worth of ideas part 2.pptxSherlyMaeNeri
 
How to Add Barcode on PDF Report in Odoo 17
How to Add Barcode on PDF Report in Odoo 17How to Add Barcode on PDF Report in Odoo 17
How to Add Barcode on PDF Report in Odoo 17Celine George
 
Science 7 Quarter 4 Module 2: Natural Resources.pptx
Science 7 Quarter 4 Module 2: Natural Resources.pptxScience 7 Quarter 4 Module 2: Natural Resources.pptx
Science 7 Quarter 4 Module 2: Natural Resources.pptxMaryGraceBautista27
 
ECONOMIC CONTEXT - LONG FORM TV DRAMA - PPT
ECONOMIC CONTEXT - LONG FORM TV DRAMA - PPTECONOMIC CONTEXT - LONG FORM TV DRAMA - PPT
ECONOMIC CONTEXT - LONG FORM TV DRAMA - PPTiammrhaywood
 
DATA STRUCTURE AND ALGORITHM for beginners
DATA STRUCTURE AND ALGORITHM for beginnersDATA STRUCTURE AND ALGORITHM for beginners
DATA STRUCTURE AND ALGORITHM for beginnersSabitha Banu
 
GRADE 4 - SUMMATIVE TEST QUARTER 4 ALL SUBJECTS
GRADE 4 - SUMMATIVE TEST QUARTER 4 ALL SUBJECTSGRADE 4 - SUMMATIVE TEST QUARTER 4 ALL SUBJECTS
GRADE 4 - SUMMATIVE TEST QUARTER 4 ALL SUBJECTSJoshuaGantuangco2
 
HỌC TỐT TIẾNG ANH 11 THEO CHƯƠNG TRÌNH GLOBAL SUCCESS ĐÁP ÁN CHI TIẾT - CẢ NĂ...
HỌC TỐT TIẾNG ANH 11 THEO CHƯƠNG TRÌNH GLOBAL SUCCESS ĐÁP ÁN CHI TIẾT - CẢ NĂ...HỌC TỐT TIẾNG ANH 11 THEO CHƯƠNG TRÌNH GLOBAL SUCCESS ĐÁP ÁN CHI TIẾT - CẢ NĂ...
HỌC TỐT TIẾNG ANH 11 THEO CHƯƠNG TRÌNH GLOBAL SUCCESS ĐÁP ÁN CHI TIẾT - CẢ NĂ...Nguyen Thanh Tu Collection
 
What is Model Inheritance in Odoo 17 ERP
What is Model Inheritance in Odoo 17 ERPWhat is Model Inheritance in Odoo 17 ERP
What is Model Inheritance in Odoo 17 ERPCeline George
 
ENGLISH 7_Q4_LESSON 2_ Employing a Variety of Strategies for Effective Interp...
ENGLISH 7_Q4_LESSON 2_ Employing a Variety of Strategies for Effective Interp...ENGLISH 7_Q4_LESSON 2_ Employing a Variety of Strategies for Effective Interp...
ENGLISH 7_Q4_LESSON 2_ Employing a Variety of Strategies for Effective Interp...JhezDiaz1
 
THEORIES OF ORGANIZATION-PUBLIC ADMINISTRATION
THEORIES OF ORGANIZATION-PUBLIC ADMINISTRATIONTHEORIES OF ORGANIZATION-PUBLIC ADMINISTRATION
THEORIES OF ORGANIZATION-PUBLIC ADMINISTRATIONHumphrey A Beña
 
Difference Between Search & Browse Methods in Odoo 17
Difference Between Search & Browse Methods in Odoo 17Difference Between Search & Browse Methods in Odoo 17
Difference Between Search & Browse Methods in Odoo 17Celine George
 
Q4 English4 Week3 PPT Melcnmg-based.pptx
Q4 English4 Week3 PPT Melcnmg-based.pptxQ4 English4 Week3 PPT Melcnmg-based.pptx
Q4 English4 Week3 PPT Melcnmg-based.pptxnelietumpap1
 
ENGLISH6-Q4-W3.pptxqurter our high choom
ENGLISH6-Q4-W3.pptxqurter our high choomENGLISH6-Q4-W3.pptxqurter our high choom
ENGLISH6-Q4-W3.pptxqurter our high choomnelietumpap1
 
Keynote by Prof. Wurzer at Nordex about IP-design
Keynote by Prof. Wurzer at Nordex about IP-designKeynote by Prof. Wurzer at Nordex about IP-design
Keynote by Prof. Wurzer at Nordex about IP-designMIPLM
 
ECONOMIC CONTEXT - PAPER 1 Q3: NEWSPAPERS.pptx
ECONOMIC CONTEXT - PAPER 1 Q3: NEWSPAPERS.pptxECONOMIC CONTEXT - PAPER 1 Q3: NEWSPAPERS.pptx
ECONOMIC CONTEXT - PAPER 1 Q3: NEWSPAPERS.pptxiammrhaywood
 
Field Attribute Index Feature in Odoo 17
Field Attribute Index Feature in Odoo 17Field Attribute Index Feature in Odoo 17
Field Attribute Index Feature in Odoo 17Celine George
 
ISYU TUNGKOL SA SEKSWLADIDA (ISSUE ABOUT SEXUALITY
ISYU TUNGKOL SA SEKSWLADIDA (ISSUE ABOUT SEXUALITYISYU TUNGKOL SA SEKSWLADIDA (ISSUE ABOUT SEXUALITY
ISYU TUNGKOL SA SEKSWLADIDA (ISSUE ABOUT SEXUALITYKayeClaireEstoconing
 
4.18.24 Movement Legacies, Reflection, and Review.pptx
4.18.24 Movement Legacies, Reflection, and Review.pptx4.18.24 Movement Legacies, Reflection, and Review.pptx
4.18.24 Movement Legacies, Reflection, and Review.pptxmary850239
 

Último (20)

Judging the Relevance and worth of ideas part 2.pptx
Judging the Relevance  and worth of ideas part 2.pptxJudging the Relevance  and worth of ideas part 2.pptx
Judging the Relevance and worth of ideas part 2.pptx
 
How to Add Barcode on PDF Report in Odoo 17
How to Add Barcode on PDF Report in Odoo 17How to Add Barcode on PDF Report in Odoo 17
How to Add Barcode on PDF Report in Odoo 17
 
Science 7 Quarter 4 Module 2: Natural Resources.pptx
Science 7 Quarter 4 Module 2: Natural Resources.pptxScience 7 Quarter 4 Module 2: Natural Resources.pptx
Science 7 Quarter 4 Module 2: Natural Resources.pptx
 
ECONOMIC CONTEXT - LONG FORM TV DRAMA - PPT
ECONOMIC CONTEXT - LONG FORM TV DRAMA - PPTECONOMIC CONTEXT - LONG FORM TV DRAMA - PPT
ECONOMIC CONTEXT - LONG FORM TV DRAMA - PPT
 
DATA STRUCTURE AND ALGORITHM for beginners
DATA STRUCTURE AND ALGORITHM for beginnersDATA STRUCTURE AND ALGORITHM for beginners
DATA STRUCTURE AND ALGORITHM for beginners
 
GRADE 4 - SUMMATIVE TEST QUARTER 4 ALL SUBJECTS
GRADE 4 - SUMMATIVE TEST QUARTER 4 ALL SUBJECTSGRADE 4 - SUMMATIVE TEST QUARTER 4 ALL SUBJECTS
GRADE 4 - SUMMATIVE TEST QUARTER 4 ALL SUBJECTS
 
HỌC TỐT TIẾNG ANH 11 THEO CHƯƠNG TRÌNH GLOBAL SUCCESS ĐÁP ÁN CHI TIẾT - CẢ NĂ...
HỌC TỐT TIẾNG ANH 11 THEO CHƯƠNG TRÌNH GLOBAL SUCCESS ĐÁP ÁN CHI TIẾT - CẢ NĂ...HỌC TỐT TIẾNG ANH 11 THEO CHƯƠNG TRÌNH GLOBAL SUCCESS ĐÁP ÁN CHI TIẾT - CẢ NĂ...
HỌC TỐT TIẾNG ANH 11 THEO CHƯƠNG TRÌNH GLOBAL SUCCESS ĐÁP ÁN CHI TIẾT - CẢ NĂ...
 
What is Model Inheritance in Odoo 17 ERP
What is Model Inheritance in Odoo 17 ERPWhat is Model Inheritance in Odoo 17 ERP
What is Model Inheritance in Odoo 17 ERP
 
ENGLISH 7_Q4_LESSON 2_ Employing a Variety of Strategies for Effective Interp...
ENGLISH 7_Q4_LESSON 2_ Employing a Variety of Strategies for Effective Interp...ENGLISH 7_Q4_LESSON 2_ Employing a Variety of Strategies for Effective Interp...
ENGLISH 7_Q4_LESSON 2_ Employing a Variety of Strategies for Effective Interp...
 
THEORIES OF ORGANIZATION-PUBLIC ADMINISTRATION
THEORIES OF ORGANIZATION-PUBLIC ADMINISTRATIONTHEORIES OF ORGANIZATION-PUBLIC ADMINISTRATION
THEORIES OF ORGANIZATION-PUBLIC ADMINISTRATION
 
FINALS_OF_LEFT_ON_C'N_EL_DORADO_2024.pptx
FINALS_OF_LEFT_ON_C'N_EL_DORADO_2024.pptxFINALS_OF_LEFT_ON_C'N_EL_DORADO_2024.pptx
FINALS_OF_LEFT_ON_C'N_EL_DORADO_2024.pptx
 
Difference Between Search & Browse Methods in Odoo 17
Difference Between Search & Browse Methods in Odoo 17Difference Between Search & Browse Methods in Odoo 17
Difference Between Search & Browse Methods in Odoo 17
 
Q4 English4 Week3 PPT Melcnmg-based.pptx
Q4 English4 Week3 PPT Melcnmg-based.pptxQ4 English4 Week3 PPT Melcnmg-based.pptx
Q4 English4 Week3 PPT Melcnmg-based.pptx
 
ENGLISH6-Q4-W3.pptxqurter our high choom
ENGLISH6-Q4-W3.pptxqurter our high choomENGLISH6-Q4-W3.pptxqurter our high choom
ENGLISH6-Q4-W3.pptxqurter our high choom
 
Keynote by Prof. Wurzer at Nordex about IP-design
Keynote by Prof. Wurzer at Nordex about IP-designKeynote by Prof. Wurzer at Nordex about IP-design
Keynote by Prof. Wurzer at Nordex about IP-design
 
YOUVE_GOT_EMAIL_PRELIMS_EL_DORADO_2024.pptx
YOUVE_GOT_EMAIL_PRELIMS_EL_DORADO_2024.pptxYOUVE_GOT_EMAIL_PRELIMS_EL_DORADO_2024.pptx
YOUVE_GOT_EMAIL_PRELIMS_EL_DORADO_2024.pptx
 
ECONOMIC CONTEXT - PAPER 1 Q3: NEWSPAPERS.pptx
ECONOMIC CONTEXT - PAPER 1 Q3: NEWSPAPERS.pptxECONOMIC CONTEXT - PAPER 1 Q3: NEWSPAPERS.pptx
ECONOMIC CONTEXT - PAPER 1 Q3: NEWSPAPERS.pptx
 
Field Attribute Index Feature in Odoo 17
Field Attribute Index Feature in Odoo 17Field Attribute Index Feature in Odoo 17
Field Attribute Index Feature in Odoo 17
 
ISYU TUNGKOL SA SEKSWLADIDA (ISSUE ABOUT SEXUALITY
ISYU TUNGKOL SA SEKSWLADIDA (ISSUE ABOUT SEXUALITYISYU TUNGKOL SA SEKSWLADIDA (ISSUE ABOUT SEXUALITY
ISYU TUNGKOL SA SEKSWLADIDA (ISSUE ABOUT SEXUALITY
 
4.18.24 Movement Legacies, Reflection, and Review.pptx
4.18.24 Movement Legacies, Reflection, and Review.pptx4.18.24 Movement Legacies, Reflection, and Review.pptx
4.18.24 Movement Legacies, Reflection, and Review.pptx
 

Kansas 2012 Drought Update - Kansas Water Office

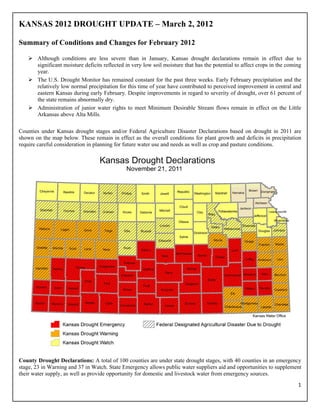
  • 1. KANSAS 2012 DROUGHT UPDATE – March 2, 2012 Summary of Conditions and Changes for February 2012 Although conditions are less severe than in January, Kansas drought declarations remain in effect due to significant moisture deficits reflected in very low soil moisture that has the potential to affect crops in the coming year. The U.S. Drought Monitor has remained constant for the past three weeks. Early February precipitation and the relatively low normal precipitation for this time of year have contributed to perceived improvement in central and eastern Kansas during early February. Despite improvements in regard to severity of drought, over 61 percent of the state remains abnormally dry. Administration of junior water rights to meet Minimum Desirable Stream flows remain in effect on the Little Arkansas above Alta Mills.     Counties under Kansas drought stages and/or Federal Agriculture Disaster Declarations based on drought in 2011 are shown on the map below. These remain in effect as the overall conditions for plant growth and deficits in precipitation require careful consideration in planning for future water use and needs as well as crop and pasture conditions. County Drought Declarations: A total of 100 counties are under state drought stages, with 40 counties in an emergency stage, 23 in Warning and 37 in Watch. State Emergency allows public water suppliers aid and opportunities to supplement their water supply, as well as provide opportunity for domestic and livestock water from emergency sources. 1   
  • 2. Kansas Drought Emergency: Allen, Barber, Barton, Butler, Chase, Clark, Coffey, Comanche, Cowley, Edwards, Finney, Ford, Grant, Gray, Greenwood, Harper, Harvey, Haskell, Hodgeman, Kearny, Kingman, Kiowa, Lyon, Marion, McPherson, Meade, Morton, Neosho, Pawnee, Pratt, Reno, Rice, Sedgwick, Seward, Stafford, Stanton, Stevens, Sumner, Wilson, Woodson Kansas Drought Warning: Anderson, Bourbon, Chautauqua, Cherokee, Crawford, Elk, Franklin, Gove, Greeley, Hamilton, Labette, Lane, Linn, Logan, Miami, Montgomery, Morris, Ness, Osage, Scott, Trego, Wallace, Wichita Kansas Drought Watch: Cheyenne, Clay, Cloud, Decatur, Dickinson, Douglas, Ellis, Ellsworth, Geary, Graham, Jefferson, Jewel, Johnson, Leavenworth, Lincoln, Marshall, Mitchell, Norton, Osborne, Ottawa, Phillips, Pottawatomie, Rawlins, Republic, Riley, Rooks, Rush, Russell, Saline, Shawnee, Sheridan, Sherman, Smith, Thomas, Wabaunsee, Washington, Wyandotte Federal: No federal agricultural disaster designations due to drought have been made so far in 2012. USDA agricultural disaster declarations are based on anticipated crop losses, while Kansas drought stages are based primarily on water resource conditions. A total of 79 counties are designated federal agricultural disasters during 2011 (S3117, S3061, S3156, S3167 & S3189) due to drought, high winds and excessive temperatures and are now eligible for federal programs, along with the contiguous counties. The first 2011 designation (S3117) terminated January 10, 2012. The remaining 2011 designations terminate throughout 2012 ending with S3198, centered in Oklahoma but including four Kansas counties as contiguous, terminating July 9, 2012. Termination date refers to the deadline for applications for assistance such as loans for the disaster. According to USDA, Kansas farmers have received $987.3 million for crops lost in 2011, with more claims expected. Major disaster declarations affecting Kansas: Presidential Declarations Number Description Termination Date • M4035 Flooding 05/23/2012 • M4014 Severe Storms, Tornadoes, Straight-line Winds, and Flooding 04/12/2012 • M4012 Flooding 04/12/2012 • M4010 Severe Storms, Straight-line Winds, Tornadoes, and Flooding 03/29/2012 Secretarial Declarations Number Description Termination Date • S3209 Severe storms with hail and high winds 08/08/2012 • S3198 Drought and excessive heat 07/09/2012 • S3196 Severe storms with excessive rain, flash flooding, hail, and high winds 07/09/2012 • S3189 Drought, excessive heat, and high winds 06/27/2012 • S3186 Drought and excessive heat 06/18/2012 • S3173 High winds, hail, and a tornado 05/29/2012 • S3167 Drought, excessive heat, and high winds. 05/20/2012 • S3164 Excessive rain and flooding 05/15/2012 • S3157 Excessive rain, high winds, hail, and flooding 04/25/2012 • S3156 Drought, excessive heat, and high winds 04/25/2012 S3139 The combined effects of drought, wildfires, excessive heat, excessive rain, flooding, tornadoes, lightning, high winds, hail, blizzards, and freezes 03/27/2012 • S3134 Flooding 03/19/2012 • S3133 Drought 03/08/2012 • S3125 Drought 02/24/2012 • S3121 Drought, excessive heat, and high winds 02/23/2012 Up-to-date information regarding designated counties and assistance available due to these declarations is available here: http://www.fema.gov/dhsusda/index.jsp. 2   
  • 3. Brief explanations, program requirements and contact information for disaster relief programs are found at http://www.disasterassistance.gov/federal-agency/2. General Conditions U.S. Drought Monitor for February 28 indicates near normal conditions in the northern portion of the State. This latest Drought Monitor shows the same conditions as the previous two weeks, with the percentage of the state in each drought category remaining the same. Biggest improvement during February was a reduction in the area covered by exceptional to extreme drought (D3-D4) after the early month storms. The exceptional drought continues at 0.22 percent of the state. Currently, just over 61 percent of the state is reported as abnormally dry to exceptional drought. More information on the Drought Monitor categories can be found in a separate document under useful links on the KWO drought page. US Drought Monitor - February 28, 2012  Climate (Precipitation and Temperature) February was warmer than average. However, it was also much wetter than normal across the state. Preliminary statewide average precipitation was 1.77 inches, which was 205 percent of normal. This makes it the 12th wettest February since 1895. The South Central division was the wettest in overall precipitation at an average of 3.03 inches or 313 percent of normal. The Southwestern was the driest, with an average precipitation of 0.60 inches or 113 percent of normal. Only five days saw no reports of precipitation, and on 10 days the state-wide average was zero, with only isolated reports of moisture. Heaviest rains occurred on February 3, with some flooding reported in South Central Kansas. This made substantial inroads on the January deficits. Drought conditions changed little during the month. Based on preliminary reports, the greatest total precipitation received in February from the National Weather Service COOP network stations was 5.73 inches at Kingman, Kingman County. Greatest for the Community Collaborative Rain, Hail and Snow Network (CoCoRaHS) in February was 4.60 inches at Medicine Lodge 0.4 WSW, Barber County. On the low end of the NWS reporting stations, the lowest report was 0.24 inches at Sharon Springs in Wallace County. For the CoCoRaHS network, the lowest amount was 0.21 inches at La Crosse 0.3 ENE in Rush County. The month of February precipitation is summarized by the maps below by the High Plains Regional Climatic Center. 3   
  • 4. The table below summarizes precipitation by climate division and various time periods. Please note that the data used in compiling is preliminary and comes from different sources. This may result in slight differences in the average or extreme values presented. Kansas Climate Division Precipitation Summary (inches) Climate February 1-29 January 1 to February 29 April 1 to February 29 September 1 to February 29 Division Actual Normal % Normal Actual Normal % Normal Actual Normal % Normal Actual Normal % Normal Northwest 0.69 0.44 155 0.72 0.83 87 16.45 18.90 85 4.46 5.12 85 West Central 0.66 0.50 126 0.67 0.92 72 13.71 18.44 74 4.83 5.27 92 Southwest 0.60 0.52 113 0.62 0.91 67 10.63 18.12 59 5.51 5.22 107 North Central 1.50 0.68 217 1.61 1.21 131 22.75 24.92 90 5.61 8.10 67 Central 1.87 0.83 223 1.96 1.45 134 18.63 26.54 70 7.80 9.14 85 South Central 3.03 0.94 317 3.09 1.60 191 16.71 26.25 62 9.94 9.56 101 Northeast 2.31 0.91 253 2.37 1.77 134 26.15 32.87 79 9.51 12.19 78 East Central 2.40 1.02 242 2.43 2.05 123 21.72 34.18 64 10.05 13.25 78 Southeast 2.72 1.37 206 2.77 2.54 112 25.72 35.56 72 13.31 14.83 91 STATE 1.77 0.81 205 1.83 1.48 117 18.77 26.03 71 7.98 9.15 88 Note: 1971-2000 normal value, 100 % =normal Source: KSU Weather Data Library The table below summarizes the period’s temperature conditions by climate division, compiled by KSU Weather Data library. Please note that the data used in compiling the table is preliminary and comes from different sources. This may result in slight differences in the average or extreme values presented. Kansas Climate Division Temperature Summary (degrees Fahrenheit) February 2012 Climate Division Maximum Minimum Average Departure from Normal High Day Low Day Northwest 45.0 19.5 32.3 0.1 70 29 1 11 West Central 47.4 20.9 34.1 1.1 74 29 5 12 Southwest 49.4 24.3 36.8 1.7 77 29 8 11 North Central 37.9 18.0 28.0 -3.0 69 29 0 1 Central 49.1 24.2 36.6 3.5 72 29 4 12 South Central 49.7 26.2 37.9 2.6 75 23 9 11 Northeast 46.8 24.4 35.6 4.5 65 23 1 12 East Central 48.9 27.6 38.3 5.4 69 23 4 12 Southeast 51.4 28.8 40.1 4.5 71 23 9 11 STATE 47.3 23.8 35.5 2.3 77 29 0 1 The state-wide average temperature of 35.5 oF was 2.3 degrees warmer than normal. This marked it as the 43rd warmest February on record (1895-2011) for the state. The warmest February occurred in 1930, when the state-wide average temperature was 45.1 oF. February 1899 was the coolest with a statewide average temperature of 18.4 oF. The North Central division broke the above average pattern, with an average of 28 oF, which was 3 degrees cooler than normal. The Southeastern division, with an average of 40.1 oF was the warmest at 4.5 degrees above normal. The warmest temperatures were seen at the end of the month. The highest reading was 77 oF at Ashland (Clark County) on the 29th. Daily record high was set at only one location, Perry Lake (Jefferson County) on the 6th. On the low temperature side, no record lows were set, but 4 record high minimums were seen. The coldest reading for the month was 0 oF at Burr Oak (Jewell County) on the 1st. Average monthly temperatures at individual reporting locations ranged from 45.5 oF at Great Bend (Barton County) to 30.4 oF at Norton (Norton County). The highest temperature recorded in Kansas during February was 77 oF at Ashland (Clark County) on the 29th. The coldest reading observed in the state during February was 0 oF at Burr Oak (Jewell County) on the 1st. The following maps show average monthly temperature and the departure from normal across Kansas during February. 4   
  • 5.      The table below summarizes February temperature and precipitation conditions by climate division while Appendix A provides the February summary for principal reporting locations within and adjacent to Kansas. Please note that the data used in compiling Table 1 and Appendix A is preliminary and comes from different sources. This may result in slight differences in the average or extreme values presented. Kansas Climate Division Summary-Departures from Normal Precipitation (inches) Temperature (oF) February 2012 2012 through February Monthly Extremes Departure Departure Departure from % from % from Climate Division Total Normal 1 Normal Total Normal 1 Normal Ave Normal 1 Max Min Northwest 0.69 0.25 155 0.72 -0.11 87 32.3 0.1 70 1 West Central 0.66 0.16 126 0.67 -0.25 72 34.1 1.1 74 5 Southwest 0.60 0.08 113 0.62 -0.29 67 36.8 1.7 77 8 North Central 1.50 0.82 217 1.61 0.40 131 28.0 -3.0 69 0 Central 1.87 1.04 223 1.96 0.51 134 36.6 3.5 72 4 South Central 3.03 2.09 317 3.09 1.49 191 37.9 2.6 75 9 Northeast 2.31 1.40 253 2.37 0.60 134 35.6 4.5 65 1 East Central 2.40 1.38 242 2.43 0.38 123 38.3 5.4 69 4 Southeast 2.72 1.35 206 2.77 0.23 112 40.1 4.5 71 9 STATE 1.77 0.96 205 1.83 0.35 117 35.5 2.3 77 0 1. Departure from 1981-2010 normal value 2. State Highest temperature: 77 oF at Ashland (Clark County) on the 29th. 3. State Lowest temperature: 0 oF at Burr Oak (Jewell County) on the 1st. 4. 4. Greatest 24hr rainfall: 4.30 inches on the 4th at Kingman 2.5 SW , Kingman County (CoCoRaHS); 3.35 inches on the 4th at Medicine Lodge 1E, Barber County (NWS) Source: KSU Weather Data Library The Palmer Drought Severity Index (PDSI) is a meteorological drought index, and it responds to weather conditions that have been abnormally dry or abnormally wet. The PDSI is calculated based on precipitation and temperature data, as well as the local Available Water Content (AWC) of the soil. The table below summarizes conditions by climate division. Please note that the data used in compiling is preliminary and comes from different sources. This may result in slight differences in the average or extreme values presented. The statewide average PDSI for the week ending February 28th was 1.17 (near normal). Divisional PDSI values ranged from -0.09 in the Southwestern division, which translates to near normal, to 2.17 in the South Central division, which corresponds to unusually moist. 5   
  • 6. Public Water Supply Conditions A Memorandum of Understanding (MOU) for emergency use of state fishing lake water under conditions of drought emergency declared by the Governor is in place. This will allow communities and individuals within the emergency counties category to pump water from named state fishing lakes if they are in dire need of water. Individuals and communities need to contact the KWO for a water supply request and they will in turn be referred to the appropriate Kansas Department of Wildlife, Parks and Tourism office to obtain the necessary permit to withdraw the water. The MOU limits the types of water use and a fee may be set for use of the state fishing lakes’ water supply. This MOU establishes a use priority of domestic, municipal and then livestock uses, while also protecting the lake’s fish population. The State Fishing Lakes available for withdrawals for Emergency Declared counties include Atchison, Barber, Brown, Bourbon, Butler, Chase, Clark, Crawford, Goodman, Jewell, Kingman, Leavenworth, Lyon, Pott#1, Pott#2, McPherson, Miami, Mined Lands (Pits), Neosho, Osage, Ottawa, Saline, Scott, Shawnee, Sheridan, Washington, Wilson and Woodson Lakes. Additional water may also be available for Drought Emergency counties from federal lakes. Water from U.S. Army Corps of Engineer lakes is available for domestic, industrial and livestock use but is prohibited for irrigation use. Requests from applicants must go through the KWO. It may also be possible to obtain water under surplus contracts from State owned storage in certain Corps lakes with water available for purchase. Bureau of Reclamation lake water may also be made available by temporary contract under drought conditions Local Public Water Supply Status Throughout the past year of drought, at least 38 public water suppliers in 22 counties initiated conservation measures due to drought conditions. These include municipal, rural water districts and a community college. Many of these have lifted restrictions. Although some precipitation has occurred, suppliers are cautioned that supplies remain lower than normal for the time of year. Review of existing supplies and conservation triggers is recommended to all public water suppliers in drought affected counties. Other Water Supply Conditions In eastern Kansas, the primary source of water is surface water including: rivers, federal reservoirs, multipurpose small lakes and municipal lakes. Many federal reservoirs store water for public water supply and other uses. The lakes which have water supply through the Water Marketing and/or Water Assurance programs include Big Hill, Clinton, Council Grove, Elk City, Hillsdale, John Redmond, Kanopolis, Marion, Melvern, Milford, Pomona, Perry and Tuttle Creek. Cedar Bluff, Glen Elder and Keith Sebelius reservoirs also contain supply water for a community. In lakes where all state owned water is not under contract, it may be possible to negotiate for an emergency water supply. As of March 1, 2012 no releases are being made from state storage in federal reservoirs for downstream needs. General Reservoir Conditions 6   
  • 7. Kansas Federal Reservoir Conservation Pool Levels Top of Multipurpose/Conservation Pool Multipurpose/Conservation Change from Top of Reservoir (Feet MSL) Pool Elevation (Feet MSL) Pool (Feet) Kansas River Basin 3/01/2012 Norton1 2304.3 2298.90 -5.40 Harlan County, NE 1946 1947.21 1.21 Lovewell1 1582.6 1582.22 -0.38 Milford1 1144.4 1144.66 0.26 Cedar Bluff 2144 2126.33 -17.67 Kanopolis1 1463 1463.15 0.15 Wilson1 1516 1515.68 -0.32 Webster1 1892.5 1888.22 -4.28 Kirwin1 1729.3 1729.37 0.07 Waconda1 1455.6 1454.48 -1.12 Tuttle Creek1 1075 1075.22 0.22 Perry1 891.5 891.19 -0.31 Clinton1 875.5 874.11 -1.39 Melvern1 1036 1033.73 -2.27 Pomona1 974 973.79 -0.21 Hillsdale1 917 915.39 -1.61 Arkansas River Basin 3/01/2012 Cheney 1421.6 1418.75 -2.85 El Dorado 1339 1336.67 -2.33 Toronto1 901.5 901.93 0.43 Fall River1 948.5 950.01 1.51 Elk City1 796 797.22 1.22 Big Hill 858 857.56 -0.44 Council Grove1 1274 1274.59 0.59 Marion1 1350.5 1348.71 -1.79 John Redmond1 1039 1041.52 2.52 1. Lake level management plan in place Source: U.S. Army Corps of Engineers Streamflow Conditions The comparison of streamflow for March 1, 2012 for all days of the year is shown on the map below. Recent flow is compared to the historical streamflow in Kansas for the past 45 days on the USGS graph. Both indicate below normal streamflows. USGS seven day average stream flow compared to normal flow values recorded for all days of the year during all years measurements have been collected. In general, a streamflow which is greater than the 75 percentile is considered above normal, a streamflow which is between 25 and 75 percentiles is considered normal and a streamflow which is less than the 25 percentile is considered below normal. Color codes are for basins with streamflow averages less than 25 percent of historic values. Historical Stream Flow Compared to Year 7   
  • 8. Water Right Administration/Minimum Desirable Streamflow (MDS) Minimum Desirable Streamflow (MDS) administration has ended on all streams except a portion of the Little Arkansas River above Alta Mills. The table below shows the gage name for the location on the map where administration is occuring, as well as providing flows in cubic feet per second (cfs) at selected gaging stations as of February 16 for streams where MDS is of interest. Streamflows in Cubic Feet per Second (cfs) ADMINISTRATION March 1, Flow March MDS Gaging Station STATUS Republican River at Concordia 411 150 Republican River at Clay Center 577 200 Smoky Hill River at Ellsworth 21 25 Little Arkansas River at Alta Mills 704 8 5/12/11 Little Arkansas River: Orders were effective May 12 and July 13 requiring cessation of pumping on sections of the Little Arkansas River. These orders pertain to the basin which drains to the Little Arkansas River between Alta Mills and Valley Center respectively. The orders have been lifted above Valley Center but remain in effect for 8 water rights above Alta Mills. Burn Bans and Fires Most counties require permits prior to a burn and are controlling burns through that process. A county issues a ban as they deem necessary at any time, for a specific time period or until repealed. Dry conditions in much of Kansas allow fires to start or spread easily. Please contact your county officials before you burn. Conditions continue that allow fires to start easily. The outlooks change daily. See http://www.spc.noaa.gov/fire/ for current information. Kansas Vegetative Conditions The green colors on the GreenReport map this week indicate areas where winter wheat is sitting dormant in the fields. Most areas in between remain in the yellow color/watch category, as dry conditions have prevailed thru the winter. (Kansas Applied Remote Sensing Program) Appendix B also shows the plant conditions. Crops, Feed and Livestock USDA Crop Progress and Condition reports are issued monthly during winter. The most recent report, February 27, 2012, reports topsoil moisture supplies improved during the month to 11 percent very short, 25 percent short, 62 percent adequate, and 2 percent surplus. A year ago, topsoil moisture supplies were 20 percent very short, 23 percent short, 49 percent adequate, and 8 percent surplus. The range and pasture condition was rated 29 percent very poor, 25 percent poor, 32 percent fair, and 14 percent good, which indicated a slight increase from January but still significantly worse than last year at this time. Feed grain supplies in Kansas were rated at 10 percent very short, 18 percent short, 69 percent adequate, and 3 percent surplus, while hay and forage supplies were rated at 26 percent very short, 28 percent short, 44 percent adequate, and 2 percent surplus. The stock water supplies improved to 10 percent very short, 19 percent short, 70 percent adequate, and 1 percent surplus. 8   
  • 9. Emergency Haying and Grazing Emergency haying and grazing of CRP acreage were authorized in 2011 to provide relief to livestock producers in areas affected by a severe drought or similar natural disaster. If conditions warrant, authorization will need to be issued again in 2012 to allow emergency haying and grazing and other federal program aid for livestock feed. USDA Risk Management Agency provides information on crop insurance and drought damaged crops can be found at http://www.rma.usda.gov/fields/ks_rso/2011/droughtfaq.pdf. Future Outlook The March 1 – May 31, 2012 U.S. Seasonal Drought Outlook by the Climate Prediction Center (CPC) indicates drought conditions are expected to continue in the southern portions of the state. The central and southern High Plains has been fairly dry during the past few weeks. Some improvement is possible in extreme eastern and southeastern Kansas. For precipitation, the updated CPC monthly outlook, as well as the seasonal outlook for March favors below-median precipitation across the all but eastern Kansas, and above median temperatures. The La Niña continues and is expected to influence the precipitation patterns into the spring, with drier than normal conditions expected across the Southern Plains. 9   
  • 10. NOAA outlook for the next 14 days and three months: The Kansas Weekly Climate Summary and Drought Report is compiled at least monthly, more frequently when conditions warrant, by the Kansas Water Office (KWO). Information from various federal, state, local and academic sources is used. Some of the data is preliminary and subject to change once final data is available. The KWO web site, KWO Drought, contains additional drought information including links to other agencies with drought information and past issues of the Kansas Climate Summary and Drought Report. Kansas State Climatologist, Mary Knapp, is the primary source of the narrative on weather. She works closely with meteorologists throughout the state and region. Details of current conditions at Evapotranspiration (ET) and Mesonet sites across Kansas are available at http://www.ksre.k- state.edu/wdl/. 10   
  • 11. RESOURCES and ACTIVITIES The U.S. Drought Monitor, from the National Drought Mitigation Center at the University of Nebraska-Lincoln, provides a “big picture” perspective of conditions across the nation. In the Kansas county drought stage scheme, a Drought Watch equates roughly to moderate drought in the U.S. Drought Monitor, while a Drought Warning is the equivalent of severe drought. A Drought Emergency is reserved for extreme or exceptional drought. Palmer Drought Severity Index - The Palmer Index (PDSI) is one indicator used in the U.S. Drought Monitor. The High Plains Regional Climate Center provides precipitation and temperature summary maps. The U.S. Geological Survey (USGS) Drought Watch provides information on 7-day average streamflow measured at long-term gaging stations and compares them to normal flows. The Kansas Department of Agriculture-Division of Water Resources monitors stream flow using the USGS gages for determination of administrative needs. Administration may be needed due to Minimum Desirable Streamflow (MDS) requirements, impairments, and reservoir release protection. The water levels of the federal lakes fluctuate during a year according to the management plan. Lake level Management plans are posted on the Kansas Water Office web site www.kwo.org. The Kansas Applied Remote Sensing Program (KARS) at the University of Kansas produces a Kansas Green Report each week during the growing season. For a full set of national and regional GreenReport® maps, go to: http://www.kars.ku.edu/products/greenreport/greenreport.shtml. This Kansas Vegetation Drought Response Index map is developed weekly by the Kansas Biological Survey using state drought triggers as its key. In addition the Vegetation Drought Response Index, by the National Drought Mitigation Center provides another a national perspective on vegetation conditions. VegDRI maps may be found at http://vegdri.unl.edu/ The National Weather Service (NWS) provides fire weather products and services for Kansas that include the Rangeland Fire Danger Index, Fire Weather Forecasts, Red Flag Watches/Warnings, and Spot Forecasts. The five NWS offices that serve Kansas websites may be accessed from the NWS Offices’ page. The Seasonal Drought Outlook, developed by the NOAA Climate Prediction Center (NOAA CPC), assesses the likelihood for improvement, persistence or deterioration in drought conditions for areas currently experiencing drought as identified by the U.S. Drought Monitor. Also see: http://www.ncdc.noaa.gov/oa/climate/research/dm/weekly-dm-animations.html Responding to Drought: A Guide for City, County and Water System Officials provides an overview of Kansas county drought stage declarations, local planning and coordination, disaster declarations, and available state and federal assistance. The 2007 Municipal Water Conservation Plan Guidelines and the Drought Vulnerability Assessment Report, both by Kansas Water Office, provide guidance regarding drought preparedness and response. USDA has programs for agricultural producers and businesses for drought affected areas. In some cases a eligibility is dependent on a federal disaster declaration but other programs are triggered by specific conditions. Please contact Diane Coe at the Kansas Water Office (785) 296-3185 or diane.coe@kwo.ks.gov should you have any questions or suggestions. 11   
  • 12. Appendix A February 2012 Summary Precipitation (inches) Temperature oF Extreme (Date) Percent Station1 Total Departure Normal Mean Departure Highest Lowest West Burlington, CO 0.43 0.01 102% 30.8 -0.8 65 (22) 6 (8) Dodge City 0.96 0.28 141% 36.5 0.6 73 (28) 9 (11) Garden City 0.37 -0.17 69% 35.7 0.9 72 (22) 9 (11) Goodland 0.42 -0.07 86% 32.7 0.4 67 (22) 1 (11) Guymon, OK 0.31 -0.16 66% 38.5 -0.1 76 (22) 16 (11, 8) Hill City 0.67 0.15 129% 33.9 1.0 0.9671 (28) 3 (12) Lamar, CO 0.20 -0.17 54% 35.5 1.9 75 (25) 12 (27) McCook, NE 0.37 -0.25 60% 32.2 1.3 66 (28) 3 (11) Springfield, CO 0.22 -0.22 50% 35.4 0.0 71 (22) 12 (8) Central Concordia 2.28 1.49 289% 36.1 3.4 64 (22) 4 (12, 11) Hebron, NE Medicine Lodge 4.96 3.92 447% 39.7 1.5 73 (22) 12 (11) Ponca City, OK 2.48 1.14 185% 41.8 2.1 71 (22) 14 (12) Salina 2.02 0.85 173% 37.6 2.1 69 (22) 7 (11) Wichita (ICT) 3.57 2.39 303% 40.5 3.3 74 (22) 12 (11) East Bartlesville, OK 2.73 0.75 138% 42.3 2.5 75 (22) 9 (12) Chanute 2.57 0.67 135% 40.8 3.4 68 (22) 10 (12) Fall City, NE 1.95 1.01 207% 35.2 4.3 63 (1) 1 (12) Johnson Co. Exec. Apt 0.58 -0.99 37% 39.4 4.6 63 (28) 7 (12) Joplin, MO 2.58 0.26 111% 42.7 2.9 72 (28) 8 (12) Kansas City (MCI), MO 3.13 1.67 214% 38.1 4.6 63 (1) 5 (12,11) St. Joseph, MO 2.28 1.35 245% 36.4 4.4 63 (26,1) 2 (12) Topeka (TOP 2.72 1.4 206% 39.9 5.5 66 (26) 8 (12) 1. Airport Automated Observation Stations (NWS/FAA) 2. Departure from 1981-2010 normal value T - Trace; M - Missing; --- no normal value from which to calculate departure or percent of normal Source: National Weather Service F-6 Climate Summaries 12   
  • 13. Appendix B Compared to the 23-year average at this time for Kansas, this year’s Vegetation Condition Report for February 17 – 30 from K-State’s Ecology and Agriculture Spatial Analysis Laboratory shows that photosynthetic activity continues to be greater than would be expected. This is especially true from Central to South Central KS, and parts of Southeastern KS. Warmer temperatures have resulted in more photosynthetic activity than is common at this time of the year. 13