SlideShare una empresa de Scribd logo
1 de 35
 
               	
  「グローバルな活躍のすすめ」

    ~国際エネルギー機関事務局長の経験から~	


  2012/4/14	
  WASEDA	
  University	
  
Nobuo	
  TANAKA	


  Former	
  Execu0ve	
  Director	
  of	
  the	
  IEA	


  Global	
  Associate	
  of	
  Energy	
  Security	
  and	
  Sustainability,	
  IEEJ	


                                                                                      ©	
  OECD/IEA	
  2011	
  
A Time of Unprecedented Uncertainties.	

            Uncertainty	
  No.1
                              	
—  Growing Asian economies, especially China, will
 shape the global energy future – where will their
 policy decisions lead us ?
China	
  is	
  already	
  	
  the	
  largest	
  consumer	
  of	
  
energy	
  and	
  will	
  be	
  the	
  largest	
  oil	
  consumer	
  in	
  
2035.	
  
                                       Growth	
  in	
  primary	
  energy	
  demand	
  	
  
                                                                                                                       IEA WEO 2011	
             4	
  500	
  
  Mtoe	


             4	
  000	
                                                                                                   China	
  
             3	
  500	
                                                                                                   India	
  
             3	
  000	
                                                                                                   Other	
  developing	
  Asia	
  

             2	
  500	
                                                                                                   Russia	
  
                                                                                                                          Middle	
  East	
  
             2	
  000	
  
                                                                                                                          Rest	
  of	
  world	
  
             1	
  500	
  
                                                                                                                          OECD	
  
             1	
  000	
  
                500	
  
                     0	
  
                     2010	
            2015	
           2020	
           2025	
            2030	
           2035	


                          Global	
  energy	
  demand	
  increases	
  by	
  one-­‐third	
  from	
  2010	
  to	
  2035,	
  	
  
                       with	
  China,	
  India	
  and	
  other	
  Asia	
  accoun@ng	
  for	
  two	
  thirds	
  	
  of	
  the	
  growth	
  	
  
                                                                                                                                                            3
Oil	
  demand	
  is	
  driven	
  higher	
  	
  
by	
  soaring	
  car	
  ownership	
  
                                                                                                              IEA WEO 2011	
                                Vehicles	
  per	
  1000	
  people	
  in	
  selected	
  markets	
  
    800	
  
                                                                                                                                        2010	
  
    700	
                                                                                                                               2035	
  
    600	
  
    500	
  
    400	
  
    300	
  
    200	
  
    100	
  
        0	
  
                United	
  States	
     European	
                China	
                 India	
           Middle	
  East	
  
                                        Union	
  
  The	
  passenger	
  vehicle	
  fleet	
  doubles	
  to	
  1.7	
  billion	
  in	
  2035;	
  more	
  cars	
  are	
  built	
  and	
  sold	
  	
  
     outside	
  the	
  OECD	
  by	
  2020,	
  making	
  non-­‐OECD	
  policies	
  key	
  to	
  global	
  oil	
  demand	
  
shift concerns security	
  isecurity
  Petroleum	
   about oil s	
  parRcularly	
  	
  the	
  
    issue	
  for	
  Asia	
  in	
  the	
  21st	
  Century.	
  
                                                         Net imports of oil
                                                                                                      IEA WEO 2011	
          14
   Mb/d


                                                                                                                           2000
          12                                                                                                               2010
          10                                                                                                               2035
          8

          6

          4

          2

          0
               European           United           Japan            China             India           ASEAN
                Union             States

 US	
  oil	
  imports	
  drop	
  due	
  to	
  rising	
  domes0c	
  output	
  &	
  improved	
  transport	
  efficiency:	
  EU	
  imports	
  
US oil imports dropf	
  the	
  US	
  rising domestic output & improved transport around	
  2020 im
    overtake	
  those	
  o due to around	
  2015;	
  China	
  becomes	
  the	
  largest	
  importer	
   efficiency: EU
                                                                                                                    	
  
  overtake those of the US around 2015; China becomes the largest importer around 20
Uncertainty	
  No.2
                              	
—  Does political unrest in producing regions make
 oil market tighter? What will be the longer term
 market structure? What will be the impact of Iran
 Sanction?
Figure 3.21                                        Breakeven costs, budget breakeven and commercially
                                                     attractive prices for current oil production for selected
                                                     producers, mid-2011                        IEA WEO 2011	
                     120                                                                                                               Budget
Dollars per barrel


                                                                                                                                       breakeven


                                                                                                       Venezuala
                     100


                                                                     Ecuador
                                                                                              Russia                                   Commercially


                                                                      Nigeria
                                                                                  Iran


                                                                    Angola
                                                                   Algeria
                                                          Saudi                                                                        aƩracƟve


                                                                     Iraq
                                             Libya
                     80                                   Arabia                                                        Super          Breakeven
                                                                                                                        majors
                                       UAE


                                                                                                                                       cost
                     60
                              Kuwait
                           Qatar


                     40


                     20


                       0
                           0           5             10     15     20   25   30          35     40     45            0     5      10
                                                                                                               Oil producƟon (mb/d)
‘Deferred	
  Investment	
  Case’	
  looks	
  at	
  near-­‐term	
  investment	
  falling	
  short	
  by	
  one-­‐ and
 Notes: Only OPEC countries, Russia and the aggregation of the five super-majors (BP, Chevron, ExxonMobil, Shell
 Total) are included. The breakeven cost is the realised oil price at which all operating expenses (excluding taxes) and
third.	
  MENA	
  output	
  falls	
  3discount rate),y	
  2015	
  recovered.
 capital costs (including a 10% capital
                                        .4	
  mb/d	
  b are fully and	
  Consumers	
  face	
  a	
  near-­‐term	
  rise	
  in	
  
oil	
  prices	
  to	
  $150/barrel.	
   based on industry sources: APICORP (2011), Deutsche Bank (2011), Credit Suisse
 Sources: IEA databases and analysis
  (2011), IMF (2011), PFC (2011) and CGES (2011).
Iran	
  Crisis	
  and	
  the	
  Hormuz	
  Strait	
                                      	
            1700 B/D
                                      85% of Japanese2oil
                                      import	
           85%
                                      20% of Japanese
                                         LNG        8260
                                      LNG importLNG        3
                                      But if no nuclear
                                                LNG      18%
                                      reactors are
                                             2010

                                      running,,,,,,?	
                                             UAE


  17 mbd of petroleum
                      2
  (20% of global demand )

                2
  82 million tons of LNG pa
  (30% of global demand)
  	
                                                          8
Uncertainty	
  No.	
  3
                               	
Shale gas in the
US brings Natural
Gas Revolution."
Is the Golden age
of Natural Gas a
solution for
security? "
The	
  Golden	
  Age	
  for	
  Natural	
  Gas	
  ?	
  
                                                                                                    IEA WEO 2011	
                                Largest	
  natural	
  gas	
  producers	
  in	
  2035	
  

           Russia	
                                                                                             ConvenRonal	
  
 United	
  States	
                                                                                             UnconvenRonal	
  
            China	
  
              Iran	
  
          Qatar	
  
         Canada	
  
        Algeria	
  
       Australia	
  
             India	
  
         Norway	


  0	
       	
  200	
       	
  400	
       	
  600	
       	
  800	
      1	
  000	
  
                                                                                                bcm	
  
      Unconven@onal	
  natural	
  gas	
  supplies	
  40%	
  of	
  the	
  1.7	
  tcm	
  increase	
  in	
  global	
  supply,	
  
      but	
  best	
  prac@ces	
  are	
  essen@al	
  to	
  successfully	
  address	
  environmental	
  challenges	
  
                                                                                                                                    10
Uncertainty	
  No.	
  4


—  Strategic	
  Role	
  of	
  
  Russia	
  as	
  the	
  key	
  
  exporter	
  of	
  fossil	
  
  fuels	
  especially	
  
  Natural	
  Gas 
Russia’s	
  focus	
  will	
  move	
  to	
  the	
  East	
  	
  
                                                                                                               IEA WEO 2011	
                                         Russian	
  revenue	
  from	
  fossil	
  fuel	
  exports
                                                                                               	
  
                           2010	
                                                                    2035	
  
                        $255	
  billion	
                                                         $420	
  billion	


                                                                                            Other	
  
                    Other	
                                                                  17%	
  
China	
  	
          21%	
                                                                                       European	
  
                                   European	
  
 2%	
                                                                               China	
                       Union	
  
                 Other	
            Union	
  
                Europe	
             61%	
                                           20%	
                         48%	
  
                 16%	
  
                                                                                                 Other	
  
                                                                                                Europe	
  
                                                                                                  15%	


                       An	
  increasing	
  share	
  of	
  Russian	
  exports	
  go	
  eastwards	
  to	
  Asia, 	
  
                         providing	
  Russia	
  with	
  diversity	
  of	
  markets	
  and	
  revenues     	
  
                                                                                                                                12
Uncertainty	
  No.	
  5
                              	

— What is the implication of the Fukushima
 Nuclear accident to the global energy
 market and security?	
  
the New Policies Scenario).

Low	
  Nbuilt from 1980 onwards are retired after a lifetime of 50 years on average
   Reactors uclear	
  Case

   (55 years in the New Policies Scenario).
                                                                IEA WEO 2011	
	
Table 12.3               Key projections for nuclear power in the New Policies Scenario
                         and the Low Nuclear Case
                                                            Low Nuclear Case                    New Policies Scenario
                                                    OECD       Non-OECD        World       OECD       Non-OECD     World

Gross installed capacity (GW)
  in 2010                                             326           68          393          326           68       393
  in 2035                                             171          164          335          380          252       633

Share in electricity generation
  in 2010                                            21%           4%          13%          21%           4%        13%
  in 2035                                              9%          5%           7%          21%           8%        13%

Gross capacity under construction (GW)*                14           54           69           14           54           69

New additions in 2011-2035 (GW)**                       6           84           91          111          167       277

Retirements in 2011-2035 (GW)                         176           42          218           71           36       107
*At the start of 2011. **Includes new plants and uprates, but excludes capacity currently under construction.

                                                                                                                             14
Less	
  nuclear	
  means	
  	
  
more	
  of	
  everything	
  else	
  
                                                                                                          IEA WEO 2011	
                    Power	
  generation	
  by	
  fuel	
  in	
  the	
  New	
  Policies	
  Scenario	
  
                                       and	
  Low	
  Nuclear	
  Case	
  

                     14	
  000	
  
          TWh	


                                                                                                       2009	
  
                     12	
  000	
                                                                       2035:	
  
                     10	
  000	
                                                                       New	
  Policies	
  Scenario	
  
                                                                                                       2035:	
  
                      8	
  000	
  
                                                                                                       Low	
  Nuclear	
  Case	
  
                      6	
  000	
  
                      4	
  000	
  
                      2	
  000	
  
                            	
  0	
  
                                        Nuclear	
     Coal	
     Gas	
     Renewables	
  

The	
  biggest	
  chunk	
  of	
  the	
  lost	
  nuclear	
  generation	
  is	
  replaced	
  by	
  power	
  generation	
  from	
  gas	
  
   and	
  	
  coal,	
  	
  leading	
  to	
  a	
  6%	
  or	
  0.9	
  GT	
  increase	
  in	
  CO2	
  emissions	
  in	
  the	
  power	
  sector	
  
Germany	
  may	
  needs	
  much	
  more	
  Gas	
  to	
  phase	
  
        out	
  Nuclear	
  by	
  2022	
  
      700
twh


      600
                                                                                                            others
      500
                                                                                                            Renewables
      400
                                                                                                            nuclear

      300                                                                                                   Gas

      200                                                                                                   Coal


      100

        0
                             Current                                     Policy 2022


  Germany	
  needs	
  to	
  import	
  16	
  BCM	
  of	
  gas	
  to	
  achieve	
  	
  electricity	
  mix	
  with	
  10%	
  
  demand	
  reduc0on,	
  no	
  nuclear,	
  35%	
  renewables	
  and	
  CO2	
  at	
  the	
  target	
  level	
  	
  
                                                                                                                             16
Lessons	
  from	
  the	
  Fukushima	
—  Fukushima	
  accident	
  was	
  caused	
  by	
  human	
  error	
  and	
  should	
  have	
  been	
  
      avoided.	
  (Mr.	
  Hatamura ,	
  Chair	
  of	
  The	
  Investigation	
  Committee	
  on	
  the	
  
      Accident	
  at	
  the	
  Fukushima	
  Nuclear	
  Power	
  Stations)	
  
—    Think	
  about	
  the	
  unthinkable;	
  Tsunami	
  and	
  Station	
  Black	
  Out.	
  	
  Change	
  
      total	
  mind	
  set	
  for	
  “Safety”.	
  
—    Prepare	
  for	
  the	
  severe	
  accidents,	
  common	
  cause	
  failure	
  &	
  compound	
  
      disasters.	
  	
  
—    Recovery	
  from	
  disaster	
  is	
  at	
  least	
  as	
  important	
  as	
  preparing	
  for	
  it.	
  
—    Independent	
  Regulatory	
  authority	
  ;	
  Reduce	
  risk	
  of	
  too	
  much	
  political	
  
      involvement;	
  Transparency	
  and	
  Trust,	
  “Back	
  Fitting”	
  of	
  regulation	
  
—    Organization	
  and	
  training	
  of	
  the	
  nuclear	
  emergency	
  staff	
  including	
  the	
  
      self	
  defense	
  force	
  ;	
  integration	
  of	
  safety	
  and	
  security.	
  
—    International	
  Cooperation	
  :	
  A	
  nuclear	
  accident	
  anywhere	
  is	
  an	
  accident	
  
      everywhere.	
  
—    Further	
  clarification	
  needed	
  why	
  it	
  happened	
  only	
  to	
  Fukushima	
  Daiichi	
  
      and	
  NOT	
  to	
  Fukushima	
  Daini,	
  Onagawa	
  nor	
  Tokai	
  daini.	
  
ネルギー、            、エネルギ                        には EU の
                    スペインは        エネルギー
                                       技術のテー
                                                       ー供給のセ                          エネルギー
                            特に地中海                                   キュリティ
                    入れている         太陽計画(           マを議論し                        、再生可能
                                       Mediterra               、2日目の                      エネルギ

   Uncertainty	
  No.	
  6
                            。

                         	
                  IEA のプレ                         nean Sola                大臣会合に
                          ゼンテーシ                               r Plan)と                  報告した。
                                ョン:                                      電気自動車
                                      http://www                                     の推進に力
                                                .iea.org/sp                                 を
                                                            eech/2010
                                                                      /Tanaka/Se
                                                                                ville.pdf


Electric Power Grid and Renewable Energy. "   26


Will Renewables be a solution ? Challenge to the
  Grid for stable supply of the electricity."
Power	
  grid	
  in	
  Europe	
 
                                                                                                                                                          ノ orwayー    ルウェ	


  N
                                                                                                                                                          Max	
  Capacity	
         3.6	
  GW
                                                                                                                                                          最大発電容量
                                                                                                                     オランダ


  Netherlands	
  
                                                                                                                                                              29.8GW
                                                                                                           Max	
  Capacity	
  
                                                                                                           最大発電容量
                              イギリス


  UK	
                                           2.4	
  GW
                                                                                                              19.8GW
                                                                                                                                         3GW                    3.9	
  GW
                              Max	
  Capacity	
  
                              最大発電容量
                                 75.5GW                                   2.4	
  GW
                                                                                                                          3.6	
  GW                                          スウェ 	
         ーデン


  Sweden
                                                   2	
  GW                                       Belgium	
  
                                                                                                 ベルギー                                                         0.6	
  GW          Max	
  Capacity	
  
                                                                                                                                                                                最大発電容量
                                                                                                   Max	
  Capacity	
  
                                2 GW
                                                                                                   最大発電容量                                                                          32.6GW
                                                                                                      15.8GW
                                                                                                                                                                                    0.6	
  GW
                                                        France	
  
                                                                                               2.7	
  GW
                                                        フランス                                                                             Germany	
  
                                                                                                                                            ドイツ
                                                        Max	
  Capacity	
  
                                                        最大発電容量                                                                                 Max	
  Capacity	
  
                                                                                                                                               最大発電容量
                                                          110.9GW                                                    3.2	
  GW
                              0.5	
  GW                                              3.2	
  GW                                                   129.1GW
                                                                                                        3.5GW
                                                                                                                                                                                                       :GeneraRon	
  capacity	
             Spain	
  
             スペイン                         1.3	
  GW
                                                                                                   Swiss	
  
                                                                                                  スイス
                                                                                                                                  1.5	
  GW
                                                                                 1.1	
  GW                                                                       2.2	
  GW                             :maximum	
  powerflow	
             Max	
  Capacity	
  
             最大発電容量                                                                             Max	
  Capacity	
  
                                                                                               最大発電容量                             1.2	
  GW
                93.5GW                        1	
  GW                                            17.9GW                                                           2	
  GW
                                                                        1.8	
  GW
                                        2.6	
  GW
                                                                                                                        0.5	
  GW


  Italy	
  
                                                         イタリア                         4.2	
  GW
                                                                                                        0.3	
  GW                      Austria	
   リ
                                                                                                                                       オースト ア
                                               Max	
  Capacity	
  
                                               最大発電容量                                                                                     Max	
  Capacity	
  
                                                                                                                                         最大発電容量
                                                   93.1GW                                                                                     18.9GW
                                                                                                              0.2	
  GW


           Source:	
  IEA 「Electricity	
  InformaRon	
  2010」	


  IndicaRve	
  value	
  for	
  Net	
  Transfer	
  CapaciRes	
  (NTC)	
  in	
  ConRnental	
  Europe	


                                                                                                                                                                                                                                  19
Power	
  grid	
  in	
  Japan	
 
  	
    Hydro              Gas	
            Coal	
  
                                                                    GeneraRng	
  
                                                                    company	
  
                                                                                                                           Hokkaido	


                           Nuclear	
  
        	
  Oil	
                           Other	
                 In-­‐house	
  
             Power	
  uRlity	
  company	
                           generaRon	
  
                                                                                                  Tohoku	
  

                                   60 hz <-------	
                Chugoku	
              Kansai	
               Hokuriku	


                                                                                                         Tokyo	


   Kyushu	
  
   29GW	
  
                  Shikoku	
  
                  	
  12GW	
  

  Okinawa	
                                                    Chubu	
                      ---à 50 hz	
   2GW	
                                                       40GW	
  
                                            Source: Agency	
  for	
  Natural	
  Resources	
  and	
  Energy,	
  The	
  Federation	
  of	
  Electric	
  Power	
  Companies	
  
                                            of	
  Japan, Electric	
  Power	
  System	
  Council	
  of	
  Japan,	
  The	
  International	
  Energy	
  Agency	
  	
                                                                                                                                                                               20
Not	
  only	
  Feed-­‐in-­‐tariffs	
  but	
  Grid	
  integraRon	
  !	
  
          Snapshot	
  of	
  present	
  penetraRon	
  potenRals	
  
Uncertainty	
  No.	
  7
                                            	
第 15 回締約国会議(COP15)(12 月 7-18 日、コペンハーゲン)

 12/14)、IEA デー
、450ppm シナリオ、省エ
   —  Climate Change
術ロードマップ、再生可能
       Mitigation: Where
々な分析成果を発信した。
       are we going"
  —  and what does this
ゼンテーション
      mean to energy
 eech/2009/tanaka/cop15.pdf
     security? 	
 ームページ
 rk/workshopdetail.asp?WS_ID
highlight briefly why the scenario is needed. It is because (as illustrated in Figure 6.2) neither
the New Policies Scenario, our central scenario, nor the Current Policies Scenario puts us on


 450	
  ppm	
  Scenmario	
  :	
  what	
  we	
  need	
  and	
  where	
  .	
a future trajectory for greenhouse-gas emissions that is consistent with limiting the increase
in global temperature to no more than 2°C, the level climate scientists say is likely to avoid
catastrophic climate change. The 450 Scenario illustrates one plausible path to that objective.
                                                                                    Energy efficiency measures account for half the cumulative CO2 abatement achieved in the
Figure 6.2            World energy-related CO2 emissions by scenario2
                                                                                    450 Scenario, relative to the New Policies Scenario, over the Outlook period (Figure 6.4).
     45                                                                             The scale of this reduction underlines the importance of strong policy action to ensure
                                                                                                                                                         IEA WEO 2011	
Gt


                   OECD
                                                                                    that potential efficiency gains are realised, in such forms as building standards, vehicle fuel
                                                                                                  28%
     40
                   Non-OECD                              Current Policies           economy mandatesGtand insistence on widespread use in industry of the best-available
                                                                                                  71%    7
                                                         Scenario                   technologies (Box 6.3). After the cheaper energy efficiency measures are exploited early in
     35
                                                                                    the Outlook period, more expensive abatement options take a larger share, and the annual
                                                                          New Policies            33%
                                                                          Scenario
     30
                                                                                    share in abatement of efficiency measures falls to 44% in 2035. The increased adoption of
                                                                                                        15 Gt
                                                                450 Scenario
                                                                                    renewable energy (including biofuels) is the second-most important source of CO2 abatement,
                                                                                                  65%
     25                                                                             relative to the New Policies Scenario, growing from a combined 19% in 2020 to 25% in 2035, or
                                                                                    a cumulative 24% over the period as a whole. Nuclear power grows rapidly in importance and
     20                                                                             accounts for a cumulative 9%, while CCS also accounts for an increasing share, growing from
       1990               2000              2010              2020                 2030   2035
                                                                                    only 3% of total abatement in 2020 to 22% in 2035, or a cumulative 18%.
Note: There is also some abatement of inter-regional (bunker) emissions which, at less than 2% of the difference between
scenarios, is not visible in the 2035 shares.

                                                                 Figure 6.4 World
In line with practice in previous World Energy Outlooks, we have estimated greenhouse-gasenergy-related CO2 emissions abatement in the
emissionsfromallsourcesandforallscenarios(Table6.1).Wehavethenassessedtheconsequences  450 Scenario relative to the New Policies Scenario
for long-term concentrations and temperature increases of such emissions trajectories.
                                                                                        38
                                                                                 Gt


The New Policies Scenario, which takes account of both existing government policies and                                   New Policies Scenario                             Abatement
                                                                     36
declared policy intentions (including cautious implementation of the Copenhagen Accord and                                                                                2020     2035
                                                                     34
Cancun Agreements), would result in a level of emissions that is consistent with a long-term                                                             Efficiency         72%      44%
average temperature increase of more than 3.5°C (see Chapter 2 for energy trends in the New
                                                                     32                                                                                  Renewables       17%      21%
Policies Scenario). The outlook in the Current Policies Scenario, which assumes no change in
                                                                     30                                                                                  Biofuels          2%       4%
government policies and measures beyond those that were enacted or adopted by mid-2011,
is considerably worse, and is consistent with a long term temperature28
                                                                      increase of 6°C or more.                                                           Nuclear           5%       9%
                                                                                        26                                                               CCS               3%      22%
The trends and implications of the 450 Scenario, a scenario based on achieving an emissions
                                                                    24
trajectory consistent with an average temperature increase of 2°C, are sometimes presented                                                               Total (Gt CO2)    2.5     14.8
here against the baseline of the New Policies Scenario to help demonstrate what more                                               450 Scenario
                                                                    22
needs to be done, particularly in terms of carbon abatement. The main changes to the
                                                                    20
450 Scenario in WEO-2011 relate to the policy assumptions, which reflect changes in 2020
                                                                      2010       2015                                       2025          2030    2035
domestic and international energy and climate policies (Box 6.2). Non-policy assumptions
relating to energy and CO2 prices, GDP and population are presented in Chapter 1.
                                                                                  Box 6.3             Reaping abatement through efficiency in the 450 Scenario                            23
2. In 2009, energy-related CO emissions contributed 61% to total greenhouse-gas emissions.
Russia                     n.a.            136       166          168            173        203            150         96
 World                           2 560        4 705        5 833     5 859             6 308     7 742           5 309     3 309
 Share of non-OECD                46%             69%       74%          80%            74%       79%             74%       81%
Coal	
  is	
  abundant	
  but	
  CO2	
  intensive.	
 Share of China
 Share of India
                                  17%
                                   3%
                                                  46%
                                                  8%
                                                            49%
                                                            11%
                                                                         48%
                                                                         15%
                                                                                        49%
                                                                                        11%
                                                                                                  48%
                                                                                                  15%
                                                                                                                  49%
                                                                                                                  10%
                                                                                                                            46%
                                                                                                                            16%
                                                                                                         IEA WEO 2011	

 Figure 10.3                      Incremental world primary coal demand by region and scenario
                                                                                                                          China
                1990-2009                                                                                                 India
                                                                                                                          Other
            Current Policies                                                                                              non-OECD
              Scenario                                                                                                    OECD
2009-2035


                New Policies
                 Scenario


             450 Scenario


                               -1 800    -1 200     -600    0      600         1 200   1 800   2 400     3 000    3 600
                                                                                                                 Mtce
 The power sector remains the main driver of global coal demand over the projection period
                                                                                                                                     24
The	
  door	
  to	
  2°C	
  is	
  closing,	
  
but	
  will	
  we	
  be	
  “locked-­‐in”	
  ?	
  
                                                                                                                     IEA WEO 2011	
          CO2	
  emissions	
  (giggatonnes)	
  

                                                  45
                                                                    6°C	
  trajectory	
  
                                                  40
                                                  35
                                                  30
                                                                                            2°C	
  trajectory	
  
                                                  25
                                                  20                                                                Delay	
  unRl	
  2017
                                                                                                                    Delay	
  unRl	
  2015
                                                  15
                                                  10                                                                Emissions	
  from	
  	
  
                                                                                                                    exisRng	
  
                                                   5                                                                infrastructure	
  	
  
                                                   0
                                                    2010   2015   2020        2025           2030          2035


      Without	
  further	
  ac0on,	
  by	
  2017	
  all	
  CO2	
  emissions	
  permi]ed	
  in	
  the	
  450	
  Scenario	
  
           will	
  be	
  “locked-­‐in”	
  by	
  exis0ng	
  power	
  plants,	
  factories,	
  buildings,	
  etc   	
  
Energy	
  poverty	
  is	
  widespread	


                                                                                           Source International Energy Agency	


—  1.3	
  billion	
  people	
  in	
  the	
  world	
  live	
  without	
  electricity	
  
—  and	
  2.7	
  billion	
  live	
  without	
  clean	
  cooking	
  faciliRes	
  	
  
What	
  is	
  Energy	
  Security	
  in	
  
the	
  21st	
  Century?
Diversity : Energy mix as Energy
      Security Mix


                                                                ASEAN	
                                        96%	
                                   30%	
   0%	


                                                                    IEA	
                        51%	
                8%	
   11%	


                                                                 EU	
  27	
            26%	
        10%	
   14%	


                                                                              0%	
         20%	
           40%	
         60%	
         80%	
     100%	
     120%	
      140%	


                                                                                       Self sufficiency
                                                                                       =inland production / tpes
                                                                                       (2010 estimates)


Nuclear	
  is	
  an	
  important	
  op0on	
  for	
  countries	
  with	
  limited	
  indigenous	
  energy	
  
  resources	
  (low	
  energy	
  sustainability).	
                                                                                                                          28
Strategic	
  Petroleum	
  Reserve:	
  	
  Does	
  the	
  
                   current	
  IEA	
  system	
  conRnue	
  to	
  work?	
  
                                                         IEA	
  stockholding	
  cover	
  of	
  global	
  oil	
  demand	
  
                                             60%                                                                                    40	
  

                                                                                                                                    35	
                                                      Growing	
  share	
  of	
  
                                             50%
                                                                                                                                                                                                non-­‐OECD	
  oil	


                                                                                                                                             days	
  of	
  world	
  oil	
  demand	
  cover
                                                                                                                                    30	
  
%	
  share	
  of	
  world	
  oil	
  demand


                                             40%                                                                                                                                             demand	
  results	
  in	
  
                                                                                                                                    25	
  
                                                                                                                                                                                               declining	
  global	
  
                                             30%                                                                                    20	
  
                                                                                                                                                                                                demand	
  cover	
  
                                             20%
                                                                                                                                    15	
                                                     from	
  IEA	
  oil	
  stocks	
  
                                                                                                                                    10	
  
                                             10%
                                                                                                                                    5	
  

                                             0%                                                                                     -­‐


                                                   IEA	
  90	
  days	
  of	
  stockholding,	
  share	
  of	
  world	
  demand	
  
                                                   with	
  China
                                                   with	
  India
                                                   with	
  A SEAN
                                                   Share	
  of	
  non-­‐OECD	
  in	
  global	
  oil	
  demand


                                                                                                                                                                                                                            29
Overseas Investments by Chinese National Oil Companies: Assessing the Drivers and Impacts
	
                                                                                      30
ConnecRng	
  MENA	
  and	
  Europe:	


  "	
  Desertec"	
  as	
  	
  “Energy	
  for	
  Peace"	


                                                                 Source:	
  DESRETEC	
  FoundaRon	
  
                                                                                                        31
Existing and proposed ASEAN Power Grid
Interconnections


                                         32
Energy for Peace in Asia ? A New Vision	
Demand Leveling (Time Zone & Climate Difference)
Stable Supply (through regional interdependence)
Fair Electricity Price
                                                    Vladivostok
                                                    Vladivostok
                        Gobi Desert
                        Gobi Desert

                              Beijing
                              Beijing        Seoul
                                             Seoul                     Phase 3
                        Chengdu
                        Chengdu                            Tokyo

                                                                     Asia
                                                            Tokyo
 Delhi
 Delhi       Bhutan
             Bhutan                        Shanghai
                                           Shanghai
                               Hong Kong

                                                                  Super Grid
                   Dacca
                   Dacca       Hong Kong   Taipei
                                           Taipei

                        Bangkok
                        Bangkok            Manila
Mumbai
Mumbai                                     Manila


         Kuala Lumpur
         Kuala Lumpur
                Singapore
                                                                    Total 36,000km
                Singapore


                                              Presentation by Mr. Masayoshi SON	
                                                                                     33
One cannot enhance energy security by
risking someone else‘s: Role of International
Organizations in Energy Sector         	
  
 -IEA vs IAEA: energy vs nuclear security and safety
 -IEA vs IRENA: energy vs Renewables in developing
 countries
 -IEA vs OPEC: oil consumer vs producer
 -IEA vs EU, ASEAN, APEC: global vs regional
 -IEA vs UNFCCC: energy vs Climate change
 -IEA vs OECD: energy security vs economy
 -IEA vs WB: security vs development
 -IEA vs WTO: security vs trade
 -IEA vs G8, G20: energy security vs global governance
 -IEA vs UN: energy security vs energy access
Thank	
  You,	
  AIESEC.

Más contenido relacionado

La actualidad más candente

The uk economy in black and white 2012
The uk economy in black and white 2012The uk economy in black and white 2012
The uk economy in black and white 2012John Ashcroft
 
Utilization of wind energy in indonesia
Utilization of wind energy in indonesiaUtilization of wind energy in indonesia
Utilization of wind energy in indonesiaDickdick Maulana
 
The UK economy in black and white may 2012
The UK economy in black and white   may 2012The UK economy in black and white   may 2012
The UK economy in black and white may 2012John Ashcroft
 
Analyst day timminco investor presentation october 12 fin
Analyst day timminco investor presentation october 12 finAnalyst day timminco investor presentation october 12 fin
Analyst day timminco investor presentation october 12 finTimminco
 
Connecting Dubai to Global Markets-Dubai Exports
Connecting Dubai to Global Markets-Dubai  ExportsConnecting Dubai to Global Markets-Dubai  Exports
Connecting Dubai to Global Markets-Dubai ExportsDubaiExports
 
Economic Overview Australia Sept 2010rev1
Economic Overview Australia Sept 2010rev1Economic Overview Australia Sept 2010rev1
Economic Overview Australia Sept 2010rev1Paul Mracek
 
Biscari safe 11 maggio 2012
Biscari safe   11 maggio 2012Biscari safe   11 maggio 2012
Biscari safe 11 maggio 2012canaleenergia
 
Financial times petrobras_190607
Financial times petrobras_190607Financial times petrobras_190607
Financial times petrobras_190607Petrobras
 
Has china lost its low cost edge?
Has china lost its low cost edge?Has china lost its low cost edge?
Has china lost its low cost edge?IHS
 
2012 Reenergize the Americas Keynote: Abbas Ghassemi
2012 Reenergize the Americas Keynote: Abbas Ghassemi2012 Reenergize the Americas Keynote: Abbas Ghassemi
2012 Reenergize the Americas Keynote: Abbas GhassemiReenergize
 
Energy in green building and the carbon imperative
Energy in green building and the carbon imperativeEnergy in green building and the carbon imperative
Energy in green building and the carbon imperativeJohn Shurtz
 
2013 weather forecast january 2013
2013 weather forecast january 20132013 weather forecast january 2013
2013 weather forecast january 2013Samantha James
 
Evs indian economy_opportunities
Evs indian economy_opportunitiesEvs indian economy_opportunities
Evs indian economy_opportunitiesShankar Thakaria
 
Andrew Sentence: The "New Normal" for the global economy
Andrew Sentence: The "New Normal" for the global economyAndrew Sentence: The "New Normal" for the global economy
Andrew Sentence: The "New Normal" for the global economyNuffield Trust
 

La actualidad más candente (18)

The uk economy in black and white 2012
The uk economy in black and white 2012The uk economy in black and white 2012
The uk economy in black and white 2012
 
Utilization of wind energy in indonesia
Utilization of wind energy in indonesiaUtilization of wind energy in indonesia
Utilization of wind energy in indonesia
 
Novozymes Trend Posters
Novozymes Trend PostersNovozymes Trend Posters
Novozymes Trend Posters
 
The UK economy in black and white may 2012
The UK economy in black and white   may 2012The UK economy in black and white   may 2012
The UK economy in black and white may 2012
 
Analyst day timminco investor presentation october 12 fin
Analyst day timminco investor presentation october 12 finAnalyst day timminco investor presentation october 12 fin
Analyst day timminco investor presentation october 12 fin
 
Connecting Dubai to Global Markets-Dubai Exports
Connecting Dubai to Global Markets-Dubai  ExportsConnecting Dubai to Global Markets-Dubai  Exports
Connecting Dubai to Global Markets-Dubai Exports
 
Economic Overview Australia Sept 2010rev1
Economic Overview Australia Sept 2010rev1Economic Overview Australia Sept 2010rev1
Economic Overview Australia Sept 2010rev1
 
Biscari safe 11 maggio 2012
Biscari safe   11 maggio 2012Biscari safe   11 maggio 2012
Biscari safe 11 maggio 2012
 
Setawwa presentation shale as a cost driver
Setawwa presentation   shale as a cost driverSetawwa presentation   shale as a cost driver
Setawwa presentation shale as a cost driver
 
Financial times petrobras_190607
Financial times petrobras_190607Financial times petrobras_190607
Financial times petrobras_190607
 
Has china lost its low cost edge?
Has china lost its low cost edge?Has china lost its low cost edge?
Has china lost its low cost edge?
 
2012 Reenergize the Americas Keynote: Abbas Ghassemi
2012 Reenergize the Americas Keynote: Abbas Ghassemi2012 Reenergize the Americas Keynote: Abbas Ghassemi
2012 Reenergize the Americas Keynote: Abbas Ghassemi
 
World Energy Outlook: The role of nuclear & renewables
World Energy Outlook: The role of nuclear & renewablesWorld Energy Outlook: The role of nuclear & renewables
World Energy Outlook: The role of nuclear & renewables
 
Macroeconomía: To BRIC or not to BRIC
Macroeconomía: To BRIC or not to BRICMacroeconomía: To BRIC or not to BRIC
Macroeconomía: To BRIC or not to BRIC
 
Energy in green building and the carbon imperative
Energy in green building and the carbon imperativeEnergy in green building and the carbon imperative
Energy in green building and the carbon imperative
 
2013 weather forecast january 2013
2013 weather forecast january 20132013 weather forecast january 2013
2013 weather forecast january 2013
 
Evs indian economy_opportunities
Evs indian economy_opportunitiesEvs indian economy_opportunities
Evs indian economy_opportunities
 
Andrew Sentence: The "New Normal" for the global economy
Andrew Sentence: The "New Normal" for the global economyAndrew Sentence: The "New Normal" for the global economy
Andrew Sentence: The "New Normal" for the global economy
 

Destacado

Greenfield shimoga exe_eng
Greenfield shimoga exe_engGreenfield shimoga exe_eng
Greenfield shimoga exe_engSharath Veerappa
 
The Essence of Leadership
The Essence of LeadershipThe Essence of Leadership
The Essence of Leadershipauthenticdan
 
facility layout paper
 facility layout paper facility layout paper
facility layout paperSaurabh Tiwary
 
Research in French Feminist Literary Theory
Research in French Feminist Literary TheoryResearch in French Feminist Literary Theory
Research in French Feminist Literary Theoryorrinali
 
20160226新宿エコ市民大学
20160226新宿エコ市民大学20160226新宿エコ市民大学
20160226新宿エコ市民大学Fusaji Hayasaka
 
2010要旨(酒井)(改)
2010要旨(酒井)(改)2010要旨(酒井)(改)
2010要旨(酒井)(改)Fusaji Hayasaka
 
20120809福島第一原子力発電所の現況
20120809福島第一原子力発電所の現況20120809福島第一原子力発電所の現況
20120809福島第一原子力発電所の現況Fusaji Hayasaka
 
20100413持続的社会構築を考える
20100413持続的社会構築を考える20100413持続的社会構築を考える
20100413持続的社会構築を考えるFusaji Hayasaka
 
Albano martine 2010-11_eserecizio4
Albano martine 2010-11_eserecizio4Albano martine 2010-11_eserecizio4
Albano martine 2010-11_eserecizio4martine_albano
 
Albano martine 2010-11_eserecizio4
Albano martine 2010-11_eserecizio4Albano martine 2010-11_eserecizio4
Albano martine 2010-11_eserecizio4martine_albano
 
Esthetica presentatie werkjes zesdejaars 2014-2015
Esthetica presentatie werkjes zesdejaars 2014-2015Esthetica presentatie werkjes zesdejaars 2014-2015
Esthetica presentatie werkjes zesdejaars 2014-2015Veerle Rowies
 

Destacado (19)

Greenfield shimoga exe_eng
Greenfield shimoga exe_engGreenfield shimoga exe_eng
Greenfield shimoga exe_eng
 
200908暖房のepr
200908暖房のepr200908暖房のepr
200908暖房のepr
 
E. histolytica
E. histolyticaE. histolytica
E. histolytica
 
The Essence of Leadership
The Essence of LeadershipThe Essence of Leadership
The Essence of Leadership
 
facility layout paper
 facility layout paper facility layout paper
facility layout paper
 
Research in French Feminist Literary Theory
Research in French Feminist Literary TheoryResearch in French Feminist Literary Theory
Research in French Feminist Literary Theory
 
20160226新宿エコ市民大学
20160226新宿エコ市民大学20160226新宿エコ市民大学
20160226新宿エコ市民大学
 
Lecture 4 2.2_ascaris
Lecture 4 2.2_ascarisLecture 4 2.2_ascaris
Lecture 4 2.2_ascaris
 
2010要旨(酒井)(改)
2010要旨(酒井)(改)2010要旨(酒井)(改)
2010要旨(酒井)(改)
 
20110725早坂
20110725早坂20110725早坂
20110725早坂
 
20120910レジュメ
20120910レジュメ20120910レジュメ
20120910レジュメ
 
20120809福島第一原子力発電所の現況
20120809福島第一原子力発電所の現況20120809福島第一原子力発電所の現況
20120809福島第一原子力発電所の現況
 
20100608早坂房次
20100608早坂房次20100608早坂房次
20100608早坂房次
 
20130226配布資料
20130226配布資料20130226配布資料
20130226配布資料
 
20100413持続的社会構築を考える
20100413持続的社会構築を考える20100413持続的社会構築を考える
20100413持続的社会構築を考える
 
20120706レジュメ
20120706レジュメ20120706レジュメ
20120706レジュメ
 
Albano martine 2010-11_eserecizio4
Albano martine 2010-11_eserecizio4Albano martine 2010-11_eserecizio4
Albano martine 2010-11_eserecizio4
 
Albano martine 2010-11_eserecizio4
Albano martine 2010-11_eserecizio4Albano martine 2010-11_eserecizio4
Albano martine 2010-11_eserecizio4
 
Esthetica presentatie werkjes zesdejaars 2014-2015
Esthetica presentatie werkjes zesdejaars 2014-2015Esthetica presentatie werkjes zesdejaars 2014-2015
Esthetica presentatie werkjes zesdejaars 2014-2015
 

Similar a 20120414tanaka presentation

World Energy Outlook 2011
World Energy Outlook 2011World Energy Outlook 2011
World Energy Outlook 2011mfrank74
 
World energy outlook presentationto press
World energy outlook presentationto pressWorld energy outlook presentationto press
World energy outlook presentationto pressAnochi.com.
 
World Energy Outlook 2012 (Released on 12 November 2012)
World Energy Outlook 2012 (Released on 12 November 2012)World Energy Outlook 2012 (Released on 12 November 2012)
World Energy Outlook 2012 (Released on 12 November 2012)Vera Leonik-Shilyaeva
 
World Energy Outlook 2012 - Press Presentation
World Energy Outlook 2012 - Press PresentationWorld Energy Outlook 2012 - Press Presentation
World Energy Outlook 2012 - Press PresentationMarcellus Drilling News
 
Shale Revolution and Energy Security : Role of LNG
Shale Revolution and Energy Security: Role  of LNGShale Revolution and Energy Security: Role  of LNG
Shale Revolution and Energy Security : Role of LNGIPPAI
 
Le monde en 2050 : les perspectives de PwC (2013)
Le monde en 2050 : les perspectives de PwC (2013)Le monde en 2050 : les perspectives de PwC (2013)
Le monde en 2050 : les perspectives de PwC (2013)PwC France
 
Mk presentation rome 14 nov 2012
Mk presentation rome 14 nov 2012Mk presentation rome 14 nov 2012
Mk presentation rome 14 nov 2012Elsevier Events
 
World Energy Outlook 2010 London Nov9
World Energy Outlook 2010 London Nov9World Energy Outlook 2010 London Nov9
World Energy Outlook 2010 London Nov9Gareth Johnston
 
China Tire industry to reach USD 3,28,461 million by 2017: Ken Research
China Tire industry to reach USD 3,28,461 million by 2017: Ken ResearchChina Tire industry to reach USD 3,28,461 million by 2017: Ken Research
China Tire industry to reach USD 3,28,461 million by 2017: Ken ResearchAnkur Gupta
 
Tsing Capital Presentation by Daniel Zhu
Tsing Capital Presentation by Daniel ZhuTsing Capital Presentation by Daniel Zhu
Tsing Capital Presentation by Daniel Zhuongreeninc
 
Automotive and-auto-parts-industry-uruguay-xxi-apr-2011 final
Automotive and-auto-parts-industry-uruguay-xxi-apr-2011 finalAutomotive and-auto-parts-industry-uruguay-xxi-apr-2011 final
Automotive and-auto-parts-industry-uruguay-xxi-apr-2011 finalinvestinuruguay
 

Similar a 20120414tanaka presentation (20)

World Energy Outlook 2011
World Energy Outlook 2011World Energy Outlook 2011
World Energy Outlook 2011
 
World energy outlook presentationto press
World energy outlook presentationto pressWorld energy outlook presentationto press
World energy outlook presentationto press
 
World Energy Outlook 2012 (Released on 12 November 2012)
World Energy Outlook 2012 (Released on 12 November 2012)World Energy Outlook 2012 (Released on 12 November 2012)
World Energy Outlook 2012 (Released on 12 November 2012)
 
World Energy Outlook 2012 - Press Presentation
World Energy Outlook 2012 - Press PresentationWorld Energy Outlook 2012 - Press Presentation
World Energy Outlook 2012 - Press Presentation
 
Dec 14 rome fatih birol
Dec 14 rome fatih birolDec 14 rome fatih birol
Dec 14 rome fatih birol
 
Shale Revolution and Energy Security : Role of LNG
Shale Revolution and Energy Security: Role  of LNGShale Revolution and Energy Security: Role  of LNG
Shale Revolution and Energy Security : Role of LNG
 
Golden rules for a Golden Age of Gas
Golden rules for a Golden Age of GasGolden rules for a Golden Age of Gas
Golden rules for a Golden Age of Gas
 
Le monde en 2050 : les perspectives de PwC (2013)
Le monde en 2050 : les perspectives de PwC (2013)Le monde en 2050 : les perspectives de PwC (2013)
Le monde en 2050 : les perspectives de PwC (2013)
 
Mk presentation rome 14 nov 2012
Mk presentation rome 14 nov 2012Mk presentation rome 14 nov 2012
Mk presentation rome 14 nov 2012
 
Weo2010 london nov9
Weo2010 london nov9Weo2010 london nov9
Weo2010 london nov9
 
World Energy Outlook 2010 London Nov9
World Energy Outlook 2010 London Nov9World Energy Outlook 2010 London Nov9
World Energy Outlook 2010 London Nov9
 
Renewable Energy: An IEA Perspective
Renewable Energy: An IEA PerspectiveRenewable Energy: An IEA Perspective
Renewable Energy: An IEA Perspective
 
Renewable Energy Financing - An IEA Perspective
Renewable Energy Financing - An IEA PerspectiveRenewable Energy Financing - An IEA Perspective
Renewable Energy Financing - An IEA Perspective
 
Tinker global energy transition feb 2012
Tinker global energy transition feb 2012Tinker global energy transition feb 2012
Tinker global energy transition feb 2012
 
Eco Friendly
Eco FriendlyEco Friendly
Eco Friendly
 
Naumova
NaumovaNaumova
Naumova
 
China Tire industry to reach USD 3,28,461 million by 2017: Ken Research
China Tire industry to reach USD 3,28,461 million by 2017: Ken ResearchChina Tire industry to reach USD 3,28,461 million by 2017: Ken Research
China Tire industry to reach USD 3,28,461 million by 2017: Ken Research
 
China Market Trends
China Market TrendsChina Market Trends
China Market Trends
 
Tsing Capital Presentation by Daniel Zhu
Tsing Capital Presentation by Daniel ZhuTsing Capital Presentation by Daniel Zhu
Tsing Capital Presentation by Daniel Zhu
 
Automotive and-auto-parts-industry-uruguay-xxi-apr-2011 final
Automotive and-auto-parts-industry-uruguay-xxi-apr-2011 finalAutomotive and-auto-parts-industry-uruguay-xxi-apr-2011 final
Automotive and-auto-parts-industry-uruguay-xxi-apr-2011 final
 

Más de Fusaji Hayasaka

20191224関東以西の電力が長期にわたって 2 割しか供給できず ―地震後の日本の復興のためには原発は不可欠―
20191224関東以西の電力が長期にわたって 2 割しか供給できず ―地震後の日本の復興のためには原発は不可欠― 20191224関東以西の電力が長期にわたって 2 割しか供給できず ―地震後の日本の復興のためには原発は不可欠―
20191224関東以西の電力が長期にわたって 2 割しか供給できず ―地震後の日本の復興のためには原発は不可欠― Fusaji Hayasaka
 
20170728高レベル放射性廃棄物最終処分科学的特性マップ
20170728高レベル放射性廃棄物最終処分科学的特性マップ20170728高レベル放射性廃棄物最終処分科学的特性マップ
20170728高レベル放射性廃棄物最終処分科学的特性マップFusaji Hayasaka
 
20170222『エネルギーの面的利用を考える』
20170222『エネルギーの面的利用を考える』20170222『エネルギーの面的利用を考える』
20170222『エネルギーの面的利用を考える』Fusaji Hayasaka
 
20170119環境省中央環境審議会長期低炭素ビジョン小委員会『長期大幅削減の絵姿』
20170119環境省中央環境審議会長期低炭素ビジョン小委員会『長期大幅削減の絵姿』20170119環境省中央環境審議会長期低炭素ビジョン小委員会『長期大幅削減の絵姿』
20170119環境省中央環境審議会長期低炭素ビジョン小委員会『長期大幅削減の絵姿』Fusaji Hayasaka
 
20160126世界省エネルギー等ビジネス推進協議会
20160126世界省エネルギー等ビジネス推進協議会20160126世界省エネルギー等ビジネス推進協議会
20160126世界省エネルギー等ビジネス推進協議会Fusaji Hayasaka
 
20141007中央区倫理法人会
20141007中央区倫理法人会20141007中央区倫理法人会
20141007中央区倫理法人会Fusaji Hayasaka
 
20131001シンポジウムポスターat山上会館・東京大学本郷キャンパス
20131001シンポジウムポスターat山上会館・東京大学本郷キャンパス20131001シンポジウムポスターat山上会館・東京大学本郷キャンパス
20131001シンポジウムポスターat山上会館・東京大学本郷キャンパスFusaji Hayasaka
 
20130417ニコニコ生放送小野章昌さん資料
20130417ニコニコ生放送小野章昌さん資料20130417ニコニコ生放送小野章昌さん資料
20130417ニコニコ生放送小野章昌さん資料Fusaji Hayasaka
 
20130213経済産業省自動車課資料
20130213経済産業省自動車課資料20130213経済産業省自動車課資料
20130213経済産業省自動車課資料Fusaji Hayasaka
 
20090415少子高齢化時代の街づくり
20090415少子高齢化時代の街づくり20090415少子高齢化時代の街づくり
20090415少子高齢化時代の街づくりFusaji Hayasaka
 
20120809東日本大震災後の当社の状況
20120809東日本大震災後の当社の状況20120809東日本大震災後の当社の状況
20120809東日本大震災後の当社の状況Fusaji Hayasaka
 
20120809電気料金認可の概要
20120809電気料金認可の概要20120809電気料金認可の概要
20120809電気料金認可の概要Fusaji Hayasaka
 

Más de Fusaji Hayasaka (20)

20191224関東以西の電力が長期にわたって 2 割しか供給できず ―地震後の日本の復興のためには原発は不可欠―
20191224関東以西の電力が長期にわたって 2 割しか供給できず ―地震後の日本の復興のためには原発は不可欠― 20191224関東以西の電力が長期にわたって 2 割しか供給できず ―地震後の日本の復興のためには原発は不可欠―
20191224関東以西の電力が長期にわたって 2 割しか供給できず ―地震後の日本の復興のためには原発は不可欠―
 
20170920GreenEnergy
20170920GreenEnergy20170920GreenEnergy
20170920GreenEnergy
 
20170728高レベル放射性廃棄物最終処分科学的特性マップ
20170728高レベル放射性廃棄物最終処分科学的特性マップ20170728高レベル放射性廃棄物最終処分科学的特性マップ
20170728高レベル放射性廃棄物最終処分科学的特性マップ
 
20170222『エネルギーの面的利用を考える』
20170222『エネルギーの面的利用を考える』20170222『エネルギーの面的利用を考える』
20170222『エネルギーの面的利用を考える』
 
20170119環境省中央環境審議会長期低炭素ビジョン小委員会『長期大幅削減の絵姿』
20170119環境省中央環境審議会長期低炭素ビジョン小委員会『長期大幅削減の絵姿』20170119環境省中央環境審議会長期低炭素ビジョン小委員会『長期大幅削減の絵姿』
20170119環境省中央環境審議会長期低炭素ビジョン小委員会『長期大幅削減の絵姿』
 
20160126世界省エネルギー等ビジネス推進協議会
20160126世界省エネルギー等ビジネス推進協議会20160126世界省エネルギー等ビジネス推進協議会
20160126世界省エネルギー等ビジネス推進協議会
 
20160126地球物理学
20160126地球物理学20160126地球物理学
20160126地球物理学
 
20150629目白大学
20150629目白大学20150629目白大学
20150629目白大学
 
20141007中央区倫理法人会
20141007中央区倫理法人会20141007中央区倫理法人会
20141007中央区倫理法人会
 
20140710 mmf
20140710 mmf20140710 mmf
20140710 mmf
 
20140417 wbn
20140417 wbn20140417 wbn
20140417 wbn
 
200908dhcのepr
200908dhcのepr200908dhcのepr
200908dhcのepr
 
20131001シンポジウムポスターat山上会館・東京大学本郷キャンパス
20131001シンポジウムポスターat山上会館・東京大学本郷キャンパス20131001シンポジウムポスターat山上会館・東京大学本郷キャンパス
20131001シンポジウムポスターat山上会館・東京大学本郷キャンパス
 
20130417ニコニコ生放送小野章昌さん資料
20130417ニコニコ生放送小野章昌さん資料20130417ニコニコ生放送小野章昌さん資料
20130417ニコニコ生放送小野章昌さん資料
 
20130213経済産業省自動車課資料
20130213経済産業省自動車課資料20130213経済産業省自動車課資料
20130213経済産業省自動車課資料
 
20090415少子高齢化時代の街づくり
20090415少子高齢化時代の街づくり20090415少子高齢化時代の街づくり
20090415少子高齢化時代の街づくり
 
20130226講演用
20130226講演用20130226講演用
20130226講演用
 
20120809東日本大震災後の当社の状況
20120809東日本大震災後の当社の状況20120809東日本大震災後の当社の状況
20120809東日本大震災後の当社の状況
 
20120809電気料金認可の概要
20120809電気料金認可の概要20120809電気料金認可の概要
20120809電気料金認可の概要
 
20120809WBN横浜
20120809WBN横浜20120809WBN横浜
20120809WBN横浜
 

Último

Tree View Decoration Attribute in the Odoo 17
Tree View Decoration Attribute in the Odoo 17Tree View Decoration Attribute in the Odoo 17
Tree View Decoration Attribute in the Odoo 17Celine George
 
BIOCHEMISTRY-CARBOHYDRATE METABOLISM CHAPTER 2.pptx
BIOCHEMISTRY-CARBOHYDRATE METABOLISM CHAPTER 2.pptxBIOCHEMISTRY-CARBOHYDRATE METABOLISM CHAPTER 2.pptx
BIOCHEMISTRY-CARBOHYDRATE METABOLISM CHAPTER 2.pptxSayali Powar
 
ICS 2208 Lecture Slide Notes for Topic 6
ICS 2208 Lecture Slide Notes for Topic 6ICS 2208 Lecture Slide Notes for Topic 6
ICS 2208 Lecture Slide Notes for Topic 6Vanessa Camilleri
 
Q-Factor HISPOL Quiz-6th April 2024, Quiz Club NITW
Q-Factor HISPOL Quiz-6th April 2024, Quiz Club NITWQ-Factor HISPOL Quiz-6th April 2024, Quiz Club NITW
Q-Factor HISPOL Quiz-6th April 2024, Quiz Club NITWQuiz Club NITW
 
Mythology Quiz-4th April 2024, Quiz Club NITW
Mythology Quiz-4th April 2024, Quiz Club NITWMythology Quiz-4th April 2024, Quiz Club NITW
Mythology Quiz-4th April 2024, Quiz Club NITWQuiz Club NITW
 
4.9.24 School Desegregation in Boston.pptx
4.9.24 School Desegregation in Boston.pptx4.9.24 School Desegregation in Boston.pptx
4.9.24 School Desegregation in Boston.pptxmary850239
 
Scientific Writing :Research Discourse
Scientific  Writing :Research  DiscourseScientific  Writing :Research  Discourse
Scientific Writing :Research DiscourseAnita GoswamiGiri
 
Sulphonamides, mechanisms and their uses
Sulphonamides, mechanisms and their usesSulphonamides, mechanisms and their uses
Sulphonamides, mechanisms and their usesVijayaLaxmi84
 
Oppenheimer Film Discussion for Philosophy and Film
Oppenheimer Film Discussion for Philosophy and FilmOppenheimer Film Discussion for Philosophy and Film
Oppenheimer Film Discussion for Philosophy and FilmStan Meyer
 
Healthy Minds, Flourishing Lives: A Philosophical Approach to Mental Health a...
Healthy Minds, Flourishing Lives: A Philosophical Approach to Mental Health a...Healthy Minds, Flourishing Lives: A Philosophical Approach to Mental Health a...
Healthy Minds, Flourishing Lives: A Philosophical Approach to Mental Health a...Osopher
 
MS4 level being good citizen -imperative- (1) (1).pdf
MS4 level   being good citizen -imperative- (1) (1).pdfMS4 level   being good citizen -imperative- (1) (1).pdf
MS4 level being good citizen -imperative- (1) (1).pdfMr Bounab Samir
 
CLASSIFICATION OF ANTI - CANCER DRUGS.pptx
CLASSIFICATION OF ANTI - CANCER DRUGS.pptxCLASSIFICATION OF ANTI - CANCER DRUGS.pptx
CLASSIFICATION OF ANTI - CANCER DRUGS.pptxAnupam32727
 
How to Fix XML SyntaxError in Odoo the 17
How to Fix XML SyntaxError in Odoo the 17How to Fix XML SyntaxError in Odoo the 17
How to Fix XML SyntaxError in Odoo the 17Celine George
 
ARTERIAL BLOOD GAS ANALYSIS........pptx
ARTERIAL BLOOD  GAS ANALYSIS........pptxARTERIAL BLOOD  GAS ANALYSIS........pptx
ARTERIAL BLOOD GAS ANALYSIS........pptxAneriPatwari
 
Team Lead Succeed – Helping you and your team achieve high-performance teamwo...
Team Lead Succeed – Helping you and your team achieve high-performance teamwo...Team Lead Succeed – Helping you and your team achieve high-performance teamwo...
Team Lead Succeed – Helping you and your team achieve high-performance teamwo...Association for Project Management
 
ClimART Action | eTwinning Project
ClimART Action    |    eTwinning ProjectClimART Action    |    eTwinning Project
ClimART Action | eTwinning Projectjordimapav
 

Último (20)

Spearman's correlation,Formula,Advantages,
Spearman's correlation,Formula,Advantages,Spearman's correlation,Formula,Advantages,
Spearman's correlation,Formula,Advantages,
 
Tree View Decoration Attribute in the Odoo 17
Tree View Decoration Attribute in the Odoo 17Tree View Decoration Attribute in the Odoo 17
Tree View Decoration Attribute in the Odoo 17
 
BIOCHEMISTRY-CARBOHYDRATE METABOLISM CHAPTER 2.pptx
BIOCHEMISTRY-CARBOHYDRATE METABOLISM CHAPTER 2.pptxBIOCHEMISTRY-CARBOHYDRATE METABOLISM CHAPTER 2.pptx
BIOCHEMISTRY-CARBOHYDRATE METABOLISM CHAPTER 2.pptx
 
ICS 2208 Lecture Slide Notes for Topic 6
ICS 2208 Lecture Slide Notes for Topic 6ICS 2208 Lecture Slide Notes for Topic 6
ICS 2208 Lecture Slide Notes for Topic 6
 
Q-Factor HISPOL Quiz-6th April 2024, Quiz Club NITW
Q-Factor HISPOL Quiz-6th April 2024, Quiz Club NITWQ-Factor HISPOL Quiz-6th April 2024, Quiz Club NITW
Q-Factor HISPOL Quiz-6th April 2024, Quiz Club NITW
 
Chi-Square Test Non Parametric Test Categorical Variable
Chi-Square Test Non Parametric Test Categorical VariableChi-Square Test Non Parametric Test Categorical Variable
Chi-Square Test Non Parametric Test Categorical Variable
 
Mythology Quiz-4th April 2024, Quiz Club NITW
Mythology Quiz-4th April 2024, Quiz Club NITWMythology Quiz-4th April 2024, Quiz Club NITW
Mythology Quiz-4th April 2024, Quiz Club NITW
 
4.9.24 School Desegregation in Boston.pptx
4.9.24 School Desegregation in Boston.pptx4.9.24 School Desegregation in Boston.pptx
4.9.24 School Desegregation in Boston.pptx
 
Scientific Writing :Research Discourse
Scientific  Writing :Research  DiscourseScientific  Writing :Research  Discourse
Scientific Writing :Research Discourse
 
Sulphonamides, mechanisms and their uses
Sulphonamides, mechanisms and their usesSulphonamides, mechanisms and their uses
Sulphonamides, mechanisms and their uses
 
Oppenheimer Film Discussion for Philosophy and Film
Oppenheimer Film Discussion for Philosophy and FilmOppenheimer Film Discussion for Philosophy and Film
Oppenheimer Film Discussion for Philosophy and Film
 
Healthy Minds, Flourishing Lives: A Philosophical Approach to Mental Health a...
Healthy Minds, Flourishing Lives: A Philosophical Approach to Mental Health a...Healthy Minds, Flourishing Lives: A Philosophical Approach to Mental Health a...
Healthy Minds, Flourishing Lives: A Philosophical Approach to Mental Health a...
 
MS4 level being good citizen -imperative- (1) (1).pdf
MS4 level   being good citizen -imperative- (1) (1).pdfMS4 level   being good citizen -imperative- (1) (1).pdf
MS4 level being good citizen -imperative- (1) (1).pdf
 
Mattingly "AI & Prompt Design: Large Language Models"
Mattingly "AI & Prompt Design: Large Language Models"Mattingly "AI & Prompt Design: Large Language Models"
Mattingly "AI & Prompt Design: Large Language Models"
 
CLASSIFICATION OF ANTI - CANCER DRUGS.pptx
CLASSIFICATION OF ANTI - CANCER DRUGS.pptxCLASSIFICATION OF ANTI - CANCER DRUGS.pptx
CLASSIFICATION OF ANTI - CANCER DRUGS.pptx
 
How to Fix XML SyntaxError in Odoo the 17
How to Fix XML SyntaxError in Odoo the 17How to Fix XML SyntaxError in Odoo the 17
How to Fix XML SyntaxError in Odoo the 17
 
ARTERIAL BLOOD GAS ANALYSIS........pptx
ARTERIAL BLOOD  GAS ANALYSIS........pptxARTERIAL BLOOD  GAS ANALYSIS........pptx
ARTERIAL BLOOD GAS ANALYSIS........pptx
 
Faculty Profile prashantha K EEE dept Sri Sairam college of Engineering
Faculty Profile prashantha K EEE dept Sri Sairam college of EngineeringFaculty Profile prashantha K EEE dept Sri Sairam college of Engineering
Faculty Profile prashantha K EEE dept Sri Sairam college of Engineering
 
Team Lead Succeed – Helping you and your team achieve high-performance teamwo...
Team Lead Succeed – Helping you and your team achieve high-performance teamwo...Team Lead Succeed – Helping you and your team achieve high-performance teamwo...
Team Lead Succeed – Helping you and your team achieve high-performance teamwo...
 
ClimART Action | eTwinning Project
ClimART Action    |    eTwinning ProjectClimART Action    |    eTwinning Project
ClimART Action | eTwinning Project
 

20120414tanaka presentation

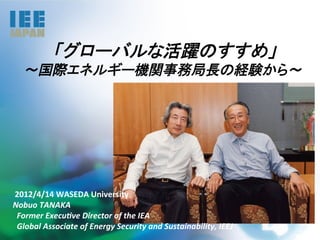
  • 1.    「グローバルな活躍のすすめ」
 ~国際エネルギー機関事務局長の経験から~        2012/4/14  WASEDA  University   Nobuo  TANAKA      Former  Execu0ve  Director  of  the  IEA      Global  Associate  of  Energy  Security  and  Sustainability,  IEEJ         ©  OECD/IEA  2011  
  • 2. A Time of Unprecedented Uncertainties. Uncertainty  No.1 —  Growing Asian economies, especially China, will shape the global energy future – where will their policy decisions lead us ?
  • 3. China  is  already    the  largest  consumer  of   energy  and  will  be  the  largest  oil  consumer  in   2035.   Growth  in  primary  energy  demand     IEA WEO 2011 4  500   Mtoe   4  000   China   3  500   India   3  000   Other  developing  Asia   2  500   Russia   Middle  East   2  000   Rest  of  world   1  500   OECD   1  000   500   0   2010   2015   2020   2025   2030   2035   Global  energy  demand  increases  by  one-­‐third  from  2010  to  2035,     with  China,  India  and  other  Asia  accoun@ng  for  two  thirds    of  the  growth     3
  • 4. Oil  demand  is  driven  higher     by  soaring  car  ownership   IEA WEO 2011 Vehicles  per  1000  people  in  selected  markets   800   2010   700   2035   600   500   400   300   200   100   0   United  States   European   China   India   Middle  East   Union   The  passenger  vehicle  fleet  doubles  to  1.7  billion  in  2035;  more  cars  are  built  and  sold     outside  the  OECD  by  2020,  making  non-­‐OECD  policies  key  to  global  oil  demand  
  • 5. shift concerns security  isecurity Petroleum   about oil s  parRcularly    the   issue  for  Asia  in  the  21st  Century.   Net imports of oil IEA WEO 2011 14 Mb/d 2000 12 2010 10 2035 8 6 4 2 0 European United Japan China India ASEAN Union States US  oil  imports  drop  due  to  rising  domes0c  output  &  improved  transport  efficiency:  EU  imports   US oil imports dropf  the  US  rising domestic output & improved transport around  2020 im overtake  those  o due to around  2015;  China  becomes  the  largest  importer   efficiency: EU   overtake those of the US around 2015; China becomes the largest importer around 20
  • 6. Uncertainty  No.2 —  Does political unrest in producing regions make oil market tighter? What will be the longer term market structure? What will be the impact of Iran Sanction?
  • 7. Figure 3.21 Breakeven costs, budget breakeven and commercially attractive prices for current oil production for selected producers, mid-2011 IEA WEO 2011 120 Budget Dollars per barrel breakeven Venezuala 100 Ecuador Russia Commercially Nigeria Iran Angola Algeria Saudi aƩracƟve Iraq Libya 80 Arabia Super Breakeven majors UAE cost 60 Kuwait Qatar 40 20 0 0 5 10 15 20 25 30 35 40 45 0 5 10 Oil producƟon (mb/d) ‘Deferred  Investment  Case’  looks  at  near-­‐term  investment  falling  short  by  one-­‐ and Notes: Only OPEC countries, Russia and the aggregation of the five super-majors (BP, Chevron, ExxonMobil, Shell Total) are included. The breakeven cost is the realised oil price at which all operating expenses (excluding taxes) and third.  MENA  output  falls  3discount rate),y  2015  recovered. capital costs (including a 10% capital .4  mb/d  b are fully and  Consumers  face  a  near-­‐term  rise  in   oil  prices  to  $150/barrel.   based on industry sources: APICORP (2011), Deutsche Bank (2011), Credit Suisse Sources: IEA databases and analysis (2011), IMF (2011), PFC (2011) and CGES (2011).
  • 8. Iran  Crisis  and  the  Hormuz  Strait 1700 B/D 85% of Japanese2oil import 85% 20% of Japanese LNG 8260 LNG importLNG 3 But if no nuclear LNG 18% reactors are 2010 running,,,,,,? UAE 17 mbd of petroleum 2 (20% of global demand ) 2 82 million tons of LNG pa (30% of global demand) 8
  • 9. Uncertainty  No.  3 Shale gas in the US brings Natural Gas Revolution." Is the Golden age of Natural Gas a solution for security? "
  • 10. The  Golden  Age  for  Natural  Gas  ?   IEA WEO 2011 Largest  natural  gas  producers  in  2035   Russia   ConvenRonal   United  States   UnconvenRonal   China   Iran   Qatar   Canada   Algeria   Australia   India   Norway    0    200    400    600    800   1  000   bcm   Unconven@onal  natural  gas  supplies  40%  of  the  1.7  tcm  increase  in  global  supply,   but  best  prac@ces  are  essen@al  to  successfully  address  environmental  challenges   10
  • 11. Uncertainty  No.  4 —  Strategic  Role  of   Russia  as  the  key   exporter  of  fossil   fuels  especially   Natural  Gas 
  • 12. Russia’s  focus  will  move  to  the  East     IEA WEO 2011 Russian  revenue  from  fossil  fuel  exports   2010   2035   $255  billion   $420  billion   Other   Other   17%   China     21%   European   European   2%   China   Union   Other   Union   Europe   61%   20%   48%   16%   Other   Europe   15%   An  increasing  share  of  Russian  exports  go  eastwards  to  Asia,   providing  Russia  with  diversity  of  markets  and  revenues   12
  • 13. Uncertainty  No.  5 — What is the implication of the Fukushima Nuclear accident to the global energy market and security?  
  • 14. the New Policies Scenario). Low  Nbuilt from 1980 onwards are retired after a lifetime of 50 years on average Reactors uclear  Case
 (55 years in the New Policies Scenario). IEA WEO 2011 Table 12.3 Key projections for nuclear power in the New Policies Scenario and the Low Nuclear Case Low Nuclear Case New Policies Scenario OECD Non-OECD World OECD Non-OECD World Gross installed capacity (GW) in 2010 326 68 393 326 68 393 in 2035 171 164 335 380 252 633 Share in electricity generation in 2010 21% 4% 13% 21% 4% 13% in 2035 9% 5% 7% 21% 8% 13% Gross capacity under construction (GW)* 14 54 69 14 54 69 New additions in 2011-2035 (GW)** 6 84 91 111 167 277 Retirements in 2011-2035 (GW) 176 42 218 71 36 107 *At the start of 2011. **Includes new plants and uprates, but excludes capacity currently under construction. 14
  • 15. Less  nuclear  means     more  of  everything  else   IEA WEO 2011 Power  generation  by  fuel  in  the  New  Policies  Scenario   and  Low  Nuclear  Case   14  000   TWh   2009   12  000   2035:   10  000   New  Policies  Scenario   2035:   8  000   Low  Nuclear  Case   6  000   4  000   2  000    0   Nuclear   Coal   Gas   Renewables   The  biggest  chunk  of  the  lost  nuclear  generation  is  replaced  by  power  generation  from  gas   and    coal,    leading  to  a  6%  or  0.9  GT  increase  in  CO2  emissions  in  the  power  sector  
  • 16. Germany  may  needs  much  more  Gas  to  phase   out  Nuclear  by  2022   700 twh 600 others 500 Renewables 400 nuclear 300 Gas 200 Coal 100 0 Current Policy 2022 Germany  needs  to  import  16  BCM  of  gas  to  achieve    electricity  mix  with  10%   demand  reduc0on,  no  nuclear,  35%  renewables  and  CO2  at  the  target  level     16
  • 17. Lessons  from  the  Fukushima —  Fukushima  accident  was  caused  by  human  error  and  should  have  been   avoided.  (Mr.  Hatamura ,  Chair  of  The  Investigation  Committee  on  the   Accident  at  the  Fukushima  Nuclear  Power  Stations)   —  Think  about  the  unthinkable;  Tsunami  and  Station  Black  Out.    Change   total  mind  set  for  “Safety”.   —  Prepare  for  the  severe  accidents,  common  cause  failure  &  compound   disasters.     —  Recovery  from  disaster  is  at  least  as  important  as  preparing  for  it.   —  Independent  Regulatory  authority  ;  Reduce  risk  of  too  much  political   involvement;  Transparency  and  Trust,  “Back  Fitting”  of  regulation   —  Organization  and  training  of  the  nuclear  emergency  staff  including  the   self  defense  force  ;  integration  of  safety  and  security.   —  International  Cooperation  :  A  nuclear  accident  anywhere  is  an  accident   everywhere.   —  Further  clarification  needed  why  it  happened  only  to  Fukushima  Daiichi   and  NOT  to  Fukushima  Daini,  Onagawa  nor  Tokai  daini.  
  • 18. ネルギー、 、エネルギ には EU の スペインは エネルギー 技術のテー ー供給のセ エネルギー 特に地中海 キュリティ 入れている 太陽計画( マを議論し 、再生可能 Mediterra 、2日目の エネルギ Uncertainty  No.  6 。 IEA のプレ nean Sola 大臣会合に ゼンテーシ r Plan)と 報告した。 ョン: 電気自動車 http://www の推進に力 .iea.org/sp を eech/2010 /Tanaka/Se ville.pdf Electric Power Grid and Renewable Energy. " 26 Will Renewables be a solution ? Challenge to the Grid for stable supply of the electricity."
  • 19. Power  grid  in  Europe ノ orwayー ルウェ        N Max  Capacity   3.6  GW 最大発電容量 オランダ      Netherlands   29.8GW Max  Capacity   最大発電容量 イギリス      UK   2.4  GW 19.8GW 3GW 3.9  GW Max  Capacity   最大発電容量 75.5GW 2.4  GW 3.6  GW スウェ   ーデン      Sweden 2  GW Belgium   ベルギー 0.6  GW Max  Capacity   最大発電容量 Max  Capacity   2 GW 最大発電容量 32.6GW 15.8GW 0.6  GW France   2.7  GW フランス Germany   ドイツ Max  Capacity   最大発電容量 Max  Capacity   最大発電容量 110.9GW 3.2  GW 0.5  GW 3.2  GW 129.1GW 3.5GW :GeneraRon  capacity Spain   スペイン 1.3  GW Swiss   スイス 1.5  GW 1.1  GW 2.2  GW :maximum  powerflow Max  Capacity   最大発電容量 Max  Capacity   最大発電容量 1.2  GW 93.5GW 1  GW 17.9GW 2  GW 1.8  GW 2.6  GW 0.5  GW      Italy   イタリア 4.2  GW 0.3  GW Austria   リ オースト ア Max  Capacity   最大発電容量 Max  Capacity   最大発電容量 93.1GW 18.9GW 0.2  GW Source:  IEA 「Electricity  InformaRon  2010」                        IndicaRve  value  for  Net  Transfer  CapaciRes  (NTC)  in  ConRnental  Europe   19
  • 20. Power  grid  in  Japan Hydro Gas   Coal   GeneraRng   company   Hokkaido     Nuclear    Oil   Other   In-­‐house   Power  uRlity  company   generaRon   Tohoku   60 hz <------- Chugoku   Kansai   Hokuriku   Tokyo   Kyushu   29GW   Shikoku    12GW   Okinawa   Chubu   ---à 50 hz  2GW   40GW   Source: Agency  for  Natural  Resources  and  Energy,  The  Federation  of  Electric  Power  Companies   of  Japan, Electric  Power  System  Council  of  Japan,  The  International  Energy  Agency   20
  • 21. Not  only  Feed-­‐in-­‐tariffs  but  Grid  integraRon  !   Snapshot  of  present  penetraRon  potenRals  
  • 22. Uncertainty  No.  7 第 15 回締約国会議(COP15)(12 月 7-18 日、コペンハーゲン) 12/14)、IEA デー 、450ppm シナリオ、省エ —  Climate Change 術ロードマップ、再生可能 Mitigation: Where 々な分析成果を発信した。 are we going" —  and what does this ゼンテーション mean to energy eech/2009/tanaka/cop15.pdf security? ームページ rk/workshopdetail.asp?WS_ID
  • 23. highlight briefly why the scenario is needed. It is because (as illustrated in Figure 6.2) neither the New Policies Scenario, our central scenario, nor the Current Policies Scenario puts us on 450  ppm  Scenmario  :  what  we  need  and  where  . a future trajectory for greenhouse-gas emissions that is consistent with limiting the increase in global temperature to no more than 2°C, the level climate scientists say is likely to avoid catastrophic climate change. The 450 Scenario illustrates one plausible path to that objective. Energy efficiency measures account for half the cumulative CO2 abatement achieved in the Figure 6.2 World energy-related CO2 emissions by scenario2 450 Scenario, relative to the New Policies Scenario, over the Outlook period (Figure 6.4). 45 The scale of this reduction underlines the importance of strong policy action to ensure IEA WEO 2011 Gt OECD that potential efficiency gains are realised, in such forms as building standards, vehicle fuel 28% 40 Non-OECD Current Policies economy mandatesGtand insistence on widespread use in industry of the best-available 71% 7 Scenario technologies (Box 6.3). After the cheaper energy efficiency measures are exploited early in 35 the Outlook period, more expensive abatement options take a larger share, and the annual New Policies 33% Scenario 30 share in abatement of efficiency measures falls to 44% in 2035. The increased adoption of 15 Gt 450 Scenario renewable energy (including biofuels) is the second-most important source of CO2 abatement, 65% 25 relative to the New Policies Scenario, growing from a combined 19% in 2020 to 25% in 2035, or a cumulative 24% over the period as a whole. Nuclear power grows rapidly in importance and 20 accounts for a cumulative 9%, while CCS also accounts for an increasing share, growing from 1990 2000 2010 2020 2030 2035 only 3% of total abatement in 2020 to 22% in 2035, or a cumulative 18%. Note: There is also some abatement of inter-regional (bunker) emissions which, at less than 2% of the difference between scenarios, is not visible in the 2035 shares. Figure 6.4 World In line with practice in previous World Energy Outlooks, we have estimated greenhouse-gasenergy-related CO2 emissions abatement in the emissionsfromallsourcesandforallscenarios(Table6.1).Wehavethenassessedtheconsequences 450 Scenario relative to the New Policies Scenario for long-term concentrations and temperature increases of such emissions trajectories. 38 Gt The New Policies Scenario, which takes account of both existing government policies and New Policies Scenario Abatement 36 declared policy intentions (including cautious implementation of the Copenhagen Accord and 2020 2035 34 Cancun Agreements), would result in a level of emissions that is consistent with a long-term Efficiency 72% 44% average temperature increase of more than 3.5°C (see Chapter 2 for energy trends in the New 32 Renewables 17% 21% Policies Scenario). The outlook in the Current Policies Scenario, which assumes no change in 30 Biofuels 2% 4% government policies and measures beyond those that were enacted or adopted by mid-2011, is considerably worse, and is consistent with a long term temperature28 increase of 6°C or more. Nuclear 5% 9% 26 CCS 3% 22% The trends and implications of the 450 Scenario, a scenario based on achieving an emissions 24 trajectory consistent with an average temperature increase of 2°C, are sometimes presented Total (Gt CO2) 2.5 14.8 here against the baseline of the New Policies Scenario to help demonstrate what more 450 Scenario 22 needs to be done, particularly in terms of carbon abatement. The main changes to the 20 450 Scenario in WEO-2011 relate to the policy assumptions, which reflect changes in 2020 2010 2015 2025 2030 2035 domestic and international energy and climate policies (Box 6.2). Non-policy assumptions relating to energy and CO2 prices, GDP and population are presented in Chapter 1. Box 6.3 Reaping abatement through efficiency in the 450 Scenario 23 2. In 2009, energy-related CO emissions contributed 61% to total greenhouse-gas emissions.
  • 24. Russia n.a. 136 166 168 173 203 150 96 World 2 560 4 705 5 833 5 859 6 308 7 742 5 309 3 309 Share of non-OECD 46% 69% 74% 80% 74% 79% 74% 81% Coal  is  abundant  but  CO2  intensive. Share of China Share of India 17% 3% 46% 8% 49% 11% 48% 15% 49% 11% 48% 15% 49% 10% 46% 16% IEA WEO 2011 Figure 10.3 Incremental world primary coal demand by region and scenario China 1990-2009 India Other Current Policies non-OECD Scenario OECD 2009-2035 New Policies Scenario 450 Scenario -1 800 -1 200 -600 0 600 1 200 1 800 2 400 3 000 3 600 Mtce The power sector remains the main driver of global coal demand over the projection period 24
  • 25. The  door  to  2°C  is  closing,   but  will  we  be  “locked-­‐in”  ?   IEA WEO 2011 CO2  emissions  (giggatonnes)   45 6°C  trajectory   40 35 30 2°C  trajectory   25 20 Delay  unRl  2017 Delay  unRl  2015 15 10 Emissions  from     exisRng   5 infrastructure     0 2010 2015 2020 2025 2030 2035 Without  further  ac0on,  by  2017  all  CO2  emissions  permi]ed  in  the  450  Scenario   will  be  “locked-­‐in”  by  exis0ng  power  plants,  factories,  buildings,  etc  
  • 26. Energy  poverty  is  widespread   Source International Energy Agency —  1.3  billion  people  in  the  world  live  without  electricity   —  and  2.7  billion  live  without  clean  cooking  faciliRes    
  • 27. What  is  Energy  Security  in   the  21st  Century?
  • 28. Diversity : Energy mix as Energy Security Mix ASEAN   96%   30%   0%   IEA   51%   8%   11%   EU  27   26%   10%   14%   0%   20%   40%   60%   80%   100%   120%   140%   Self sufficiency =inland production / tpes (2010 estimates) Nuclear  is  an  important  op0on  for  countries  with  limited  indigenous  energy   resources  (low  energy  sustainability).   28
  • 29. Strategic  Petroleum  Reserve:    Does  the   current  IEA  system  conRnue  to  work?   IEA  stockholding  cover  of  global  oil  demand   60% 40   35   Growing  share  of   50% non-­‐OECD  oil   days  of  world  oil  demand  cover 30   %  share  of  world  oil  demand 40% demand  results  in   25   declining  global   30% 20   demand  cover   20% 15   from  IEA  oil  stocks   10   10% 5   0% -­‐ IEA  90  days  of  stockholding,  share  of  world  demand   with  China with  India with  A SEAN Share  of  non-­‐OECD  in  global  oil  demand 29
  • 30. Overseas Investments by Chinese National Oil Companies: Assessing the Drivers and Impacts 30
  • 31. ConnecRng  MENA  and  Europe:                "  Desertec"  as    “Energy  for  Peace"   Source:  DESRETEC  FoundaRon   31
  • 32. Existing and proposed ASEAN Power Grid Interconnections 32
  • 33. Energy for Peace in Asia ? A New Vision Demand Leveling (Time Zone & Climate Difference) Stable Supply (through regional interdependence) Fair Electricity Price Vladivostok Vladivostok Gobi Desert Gobi Desert Beijing Beijing Seoul Seoul Phase 3 Chengdu Chengdu Tokyo Asia Tokyo Delhi Delhi Bhutan Bhutan Shanghai Shanghai Hong Kong Super Grid Dacca Dacca Hong Kong Taipei Taipei Bangkok Bangkok Manila Mumbai Mumbai Manila Kuala Lumpur Kuala Lumpur Singapore Total 36,000km Singapore Presentation by Mr. Masayoshi SON 33
  • 34. One cannot enhance energy security by risking someone else‘s: Role of International Organizations in Energy Sector   -IEA vs IAEA: energy vs nuclear security and safety -IEA vs IRENA: energy vs Renewables in developing countries -IEA vs OPEC: oil consumer vs producer -IEA vs EU, ASEAN, APEC: global vs regional -IEA vs UNFCCC: energy vs Climate change -IEA vs OECD: energy security vs economy -IEA vs WB: security vs development -IEA vs WTO: security vs trade -IEA vs G8, G20: energy security vs global governance -IEA vs UN: energy security vs energy access