
Recomendados
Recomendados
Más contenido relacionado
Destacado
Destacado (20)
Similar a Future farm business workshop a pictorial introduction
Similar a Future farm business workshop a pictorial introduction (20)
Más de Greg Lawrence
Más de Greg Lawrence (10)
Último
Último (20)
Future farm business workshop a pictorial introduction
- 1. Future Farm Business (FFB) A participatory action learning workshop Amir Abadi Future Farm Industries Cooperative Research Centre
- 2. The Challenge Can you build and run a sustainable and resilient farm business? You need to decide on yearly allocation of land and input like fertilisers to: – Annual crops lik wheat and canola or annual pastures lik clover or A l like h t d l l t like l – Herbaceous perennials like lucerne or saltland pastures; or – Trees for wood, CO2 Sequestration, biomass, oil; or – Deep drains to reduce water tables Must consider past farm records of climate and commodity prices (markets) Bear in mind risks and uncertainties of climate, markets & innovations Manage the stocks and flows of cash and credit as well as assets and liabilities Mind the ground water and manage hydrology if you can to arrest or delay damage to soils and loss of productivity
- 3. Future Farm Business Issues Adjusting the production systems and mix of crops and livestock to – Ever changing commodity prices – Deciding if recent price/cost trends are here to say – Land use sequence and choice of crops, pastures and rotations – Cost of inputs and adjusting to rising price of fuel, fertilisers and herbicides; Climate Change – Higher risk and variability brought on by known and predicated climate change; Choice of innovations – finding, evaluating and deciding the best way of adopting: – T Trees grown i b lt f woody bi in belts for d biomass and associated end products lik d i t d d d t like energy, oil or wood; – Trees in block plantings for reafforestation – Trees for permanent carbon sequestration; – Perennial pastures like Lucerne – Saltland pastures on saline land Management of farm’s hydrology and movement of water – Engineering solutions like drains or plants for managing recharge and discharge;
- 4. A Participatory Action Learning Environment Learning from self, peers and presenter Engaging - happy minds learn better To learn how to make good decisions Lets participants choose their responses Need to N d t cope with i ith imperfect k f t knowledge l d Combination of rivalry and co-operation Software synchronises scenarios and choices y Software checks and verifies adherence to rules Data demonstrates key concepts Game offers teaching moments No one right answer – participants may – share their opinions and – discuss reasons for their choices
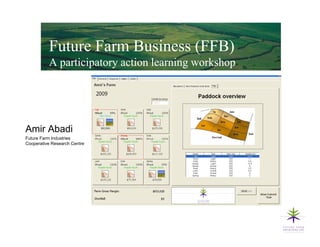
- 5. See the farm layout and its features including the area and elevation of each of the nine paddocks (fields) Each tile gives a summary of how a paddock is being managed in any given year. year It also shows the returns from the field in that year. Clicking the tile allows you g y to change its land use for the forthcoming year.
- 6. Each season ends with a display of summary report of land use selected by the grower for that year, condition of the land at the l t d b th f th t diti f th l d t th end of the season, profit and loss, and the closing equity.
- 7. Climate and market outlook for the forthcoming season combined with summary tables of past records of rainfall, p y p , prices and land use help the p partners decided what to grow, where to grow them and estimate how much they expect to earn for the year.. Market outlook for all the crops (and livestock) ( d li t k) provides an Analogue years indication of the give some revenues that indication of the can be generated kind of season from each that could be e te p se. enterprise. facing the grower
- 8. Chart s show how crops and pastures respond on different soils to incremental il t i t l changes in inputs (like fertilisers) and rainfall
- 9. Good managers use records to get a realistic sense of the potential of the resources at their disposal to generate cashflow and profit. Partners use this records page to check historical d t h k hi t i l prices, past rainfall, water tables (salinity levels), preceding land use sequences and key financial indicators like equity etc.
- 10. Land use choices (i.e. choice of annual crops and pastures, trees l d and drains) will affect the amount of water that is recharged into the water tables. On some farms tables farms, significant rises in water tables may, over time, affect the quality of the land This is especially the land. case in WA where on some farms paddocks at the lower parts of the landscape can suffer from salinity. p y
- 11. The choice of crops on each Clicking a tile field is easy by using the pull allows for down list. Then comes the change of land choice of the amount of use of the inputs to be applied (e.g. field. fertiliser). On the right hand side, side the revenues costs and revenues, gross margins of the selected land use are displayed.
- 12. You can manage the field in an alley configuration with a combination of trees and agriculture. For instance choose oil mallees in belts with wheat in the inter-rows. inter rows. It is possible to i t ll i ibl t install drains in fields that are next to the creek. Installing drains comes g at a cost and may if done at the right time and place reduce water tables and prevent salinity and waterlogging.
- 13. Forward contracts for grains provide opportunities for managing the risk associated with commodity prices. However, this can also increase risk if adopted carelessly. Two opportunities are available to hedge the price of d t d l l T t iti il bl t h d th i f grains. The first is prior to seeding and the second opportunity to take out forward contracts is during the growing period
- 14. The fi Th financial impact of i li t f plans and decisions are shown. The state of the farm’s assets and liabilities and the cashflow of the business are shown in detail in this dedicated screen.
- 15. Key indicators of the performance of the farm are appended to the records page as the workshop proceeds. This page displays of summary report of land use selected by the grower for individual years, condition of the land at the end of the season, profit and loss, and the closing equity. The chart provides a quick graphical overview of the variation in profit and loss and change in the state of assets and liabilities.
- 16. Systems S stems Approach in FFB Mimics running a simplified rural business over 25 y g p years Integrates biological, hydrological and economic factors Limits time, credit, rainfall and land use choice Has inflation and cost price squeeze trends built in Includes changes and chances of climate and markets Gives choice of enterprises for scarce resources includes farming system drivers – interactions like: – N-Fix and disease break in rotation of cereal and break crops – Shelter and competition effect of trees in the proximity of crops
- 17. Woody perennials in the broadacre farming systems of southern Australia Decide where, when and how many hectares of each tree type to grow. grow Consider: – Water use of trees: interaction between trees and ground water; – Prospects for marketable products like • Wood • Biomass • Sequestered CO2 and permits • Oil – Competition and shelter benefits of trees – Opportunity cost of land - profitability of trees compared to crops like h t lik wheat – Effect on cash flow, peak debt and payback period
- 18. Credits and Acknowledgements Ackno ledgements I thank the following contributors very much for making FFB what it is today. – Quenten Thomas – Don Cooper – Ross Kingwell – David Pannell D id P ll