
Recomendados
Más contenido relacionado
La actualidad más candente
La actualidad más candente (20)
Similar a Incident Severity Ratios: Inevitability or Opportunity
Similar a Incident Severity Ratios: Inevitability or Opportunity (20)
Último
Último (20)
Incident Severity Ratios: Inevitability or Opportunity
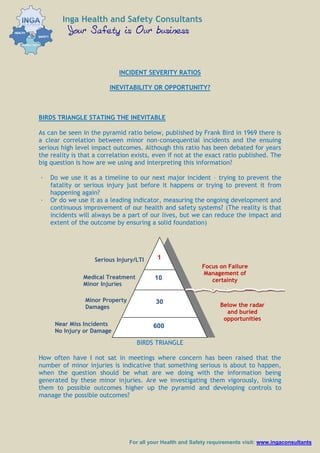
- 1. Inga Health and Safety Consultants INCIDENT SEVERITY RATIOS INEVITABILITY OR OPPORTUNITY? BIRDS TRIANGLE STATING THE INEVITABLE As can be seen in the pyramid ratio below, published by Frank Bird in 1969 there is a clear correlation between minor non-consequential incidents and the ensuing serious high level impact outcomes. Although this ratio has been debated for years the reality is that a correlation exists, even if not at the exact ratio published. The big question is how are we using and interpreting this information? · Do we use it as a timeline to our next major incident – trying to prevent the fatality or serious injury just before it happens or trying to prevent it from happening again? · Or do we use it as a leading indicator, measuring the ongoing development and continuous improvement of our health and safety systems? (The reality is that incidents will always be a part of our lives, but we can reduce the impact and extent of the outcome by ensuring a solid foundation) 1 Serious Injury/LTI Focus on Failure Management of Medical Treatment 10 certainty Minor Injuries Minor Property 30 Below the radar Damages and buried opportunities Near Miss Incidents 600 No Injury or Damage BIRDS TRIANGLE How often have I not sat in meetings where concern has been raised that the number of minor injuries is indicative that something serious is about to happen, when the question should be what are we doing with the information being generated by these minor injuries. Are we investigating them vigorously, linking them to possible outcomes higher up the pyramid and developing controls to manage the possible outcomes? For all your Health and Safety requirements visit: www.ingaconsultants
- 2. Inga Health and Safety Consultants The reality is that organizations still have incident investigation matrixes that only allocate resources to the investigation of serious incidents, whereas minor incidents receive very little if any investigation effort. The truth is that these minor incidents are not perceived to have any real impact on the organization; consequently tedious investigations are not seen profitable. The correlation is not applied to individual occurrences or performance units and consequently they merge into that broad band of mismanaged information. This triangle will remain relevant until we move our focus and adapt our systems to address those environmental and personal factors that give rise to the minor seemingly non-consequential incidents. Leading indicators should be developed to address those issues listed in the ground zero contributing factors below. My question is: Why do we continue to expend so much time and energy on recovering from the serious incidents, when this could be used to fast track our journey to maturity by uncovering the causes of our non-consequential incidents? The answer: It has become a safety norm to measure our success by means of a failure ratio. Governing bodies don’t focus beyond the serious incident and what has been done in an attempt to prevent that one incident from happening again. We pat ourselves on the back for identifying the cause and then wait for the next serious incident. Are our systems not based on sound risk identification principles and should this not include those associated with every exposure we have? If we fail to build a stronger foundation then we should not expect the correlation of this triangle to change. History has always focused on the worst outcome and we have been pretty good at identifying our failures after the fact, sometimes even succeeding in ensuring that those outcomes are not repeated. Let’s take a look at some of the worst disasters, 911, Bhopal, Chernobyl. All could have been prevented if more attention and focus had been given to the ground zero contributing factors. Although acts of God do occur, let’s be honest, they are few and far between. Our disasters are mostly directly related to our lack of focus, analysis and interpretation of information available to us. Hazard analysis is actually simple: What if? · What will happen if I do this? · What will happen if this happens? Let’s track the first what if until we identify the hidden disaster, rather than tracing the disaster back to the first what if. For all your Health and Safety requirements visit: www.ingaconsultants
- 3. Inga Health and Safety Consultants BIRDS TRIANGLE INVERTED If we invert the triangle we immediately move our focus to that part of the ratio that provides the bulk of information and opportunity. Using this information we can adapt, review and manage our system with a view to continuously fine tuning and improving our risk reduction endeavours. Start using total incident ratios as your performance indicator instead of the traditional lost time indicators. This will allow you to focus on prevention rather than cure. Identify your unique exposures and develop leading indicators which will allow you to monitor real trends, which may give rise to near misses. BIRDS TRIANGLE INVERTED Near Miss Incidents 600 Continuous Growth No Injury or Damage Focus on information and system management Minor Property All incidents are preventable 30 Damages Medical Treatment 10 System Failure Minor Injuries Management review required 1 Serious Injury/LTI · What if we took the time to identify all our exposures? · What if we encouraged everyone to report these exposures? · What if we took the time to analyze these exposures? · What if we acted on this information and continuously improved our management approach to health and safety? · What if we communicated this to our employees and trained them to make safe decisions? · What if we developed leading indicators to assist us in monitoring our performance? The answer is simple – we would reduce our inherent exposure, thereby eliminating the opportunity for system failure or at worst reducing the anticipated serious incident to a one with minor consequence. For all your Health and Safety requirements visit: www.ingaconsultants
- 4. Inga Health and Safety Consultants MAKING THE TRIANGLE WORK FOR YOU Use the triangle as a basis for measuring your safety program. The correlation depicted by the triangle although proven is only effective if the distinctive layers are clearly defined and how successful the near miss reporting structure is. How you use the triangle is up to you. It can hang around your neck as the master of gloom or it can be managed as the health and safety tool it really is. If you control the detail that is required to address the contributing factors you will succeed in reducing a large number of your minor incidents and by virtue of that the issues involved in the more serious incidents will be controlled by default. Always remember that although the correlation is widely accepted we have no way of knowing the likelihood of an outcome. (In other words which of the 600 near misses will result in the 1 undesired outcome – this is in most instances a question of luck unless we have a sound system which dynamically addresses the contributing factors listed) The following in my opinion should be addressed in order to add value to your system: · Identify exposure units and apply the triangle per unit. · Clearly define the fields of the triangle. · Continuously campaign to increase reporting against these fields. · Define leading indicators to assist with the development and continuous advancement of controls around all contributing factors. (Training; maintenance schedules; audits; risk assessments) · Publish trends and target specific areas of exposure identified by your leading indicators. Investigating and Uncovering The road to Recovery The road to Health & Safety Maturity 1 Serious Injury/LTI Activating leading indicators Medical Treatment 10 Minor Injuries Minor Property 30 Damages Near Miss Incidents 600 No Injury or Damage GROUND ZERO - CONTRIBUTING FACTORS Risk Social Management Human Equipment Management Psychological Commitment Error Failure Tactics Factors THE ACTIVATED MODEL For all your Health and Safety requirements visit: www.ingaconsultants