SlideShare una empresa de Scribd logo
1 de 9
Descargar para leer sin conexión
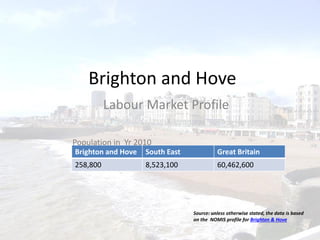
Brighton and Hove
Labour Market Profile
Brighton and Hove South East Great Britain
258,800 8,523,100 60,462,600
Population in Yr 2010
Source: unless otherwise stated, the data is based
on the NOMIS profile for Brighton & Hove
This presentation looks at
Earnings by residence Brighton vs South East vs
Great Britain (Year 2011)
Employment by occupation
Employee jobs (Year 2008)
Employment and Unemployment Jul 2010 to June
2011 (% for ages 16 to 64)
Qualifications
Earnings by residence (2011)
£548.80
£607.40
£541.70
£486.50 £474.30 £446.30
Brighton and Hove South East Great Britain
Gross weekly pay
Male full-time
workers
Female full-time
workers
Median earnings in pounds for employees living in the area.
£9.33 per hour – the
hourly wage required by a
lone parent with one child
to achieve the Minimum
Income Standard
£6.08 per hour:
National Minimum
Wage for workers over
21 years of age
£7.63 per hour: the amount
needed by a single adult
working full time in order to
meet the Minimum income
standard
Female full time workers
earn significantly less
across all regions
However the
gap is less in
Brighton and
Hove
Employment by occupation
13.3 14.2 17.5
16 16.6
17.3
16.9
21.6
22
53.8 47.5 43.2
Brighton and
Hove
South East Great Britain
Percentages
Managers, directors,
professional
Administrative,
secretarial, skilled
trades
Caring, leisure, sales,
customer services,
other services
Machine operators,
elementary occupations
Brighton has a significantly higher proportion of managers
and professionals compared to the rest of the UK
Employee jobs (Yr 2008)
3% 3%
24%
5%
27%
31%
7%
Brighton and Hove
Manufacturing
Construction
Distribution, hotels &
restaurants
Transport &
communications
Finance, IT, other
business activities
Public admin,
education & health
Other services
8%
5%
25%
6%
24%
26%
6%
South East
10%
5%
24%
6%22%
28%
5%
Great Britain
Notes
The information comes from the Annual Business Inquiry
(ABI) - an employer survey conducted in December of each
year. The survey samples around 78,000 businesses. The ABI
records a job at the location of an employee's workplace
(rather than at the location of the business's main office).
Public administration, education
and health provided the largest
number of employee jobs for
Brighton
Employee jobs – full time and part-time (Yr 2008)
64.6 69 68.8
35.4 31 31.2
Brighton and
Hove
South East Great Britain
Percentages
Full-time Part-time
The Annual Business
Inquiry defines part-
time employees as
those working for 30 or
fewer hours per week.
Employment and Unemployment Jul 2010 to
June 2011 (% for ages 16 to 64)
58.1 63.9 60.7
11.5
10.4
9.1
7.6
5.9
7.7
Brighton and
Hove
South East Great Britain
Percentages%
Unemployed (model-based)
Self employed
Employees
Model-based unemployed estimates
are used to overcome the unreliability of
very small samples used as part of the
Annual Population Survey for unitary
authorities and local authority districts.
Unemployment estimates for counties
are direct survey estimates.
Economically
active
75% 79.5% 76.2%
Economically active: expressed as
a percentage of people aged 16 to
64. They include the employed
and unemployed. The unemployed
refers to people without a job who
were available to start work in the
two weeks following their
interview and who had either
looked for work in the four weeks
prior to interview or were waiting
to start a job they had already
obtained.
Qualifications – percentages are for those aged 16 to 64
6.3
8.5
11.3
45.9
57.6
57.4
47.8
33.9
31.3
No qualifications Below NVQ4 Above NVQ4
Great Britain
South East
Brighton and Hove
NVQ 4 equivalent and
above: includes HND,
Degree and Higher
Degree level
qualifications or
equivalent
No qualifications: no
qualifications held
Brighton has a significantly higher proportion of
people with NVQ 4 qualifications and above
Slideshow by Gavin Barker
http://compasstraining.org/
KEY SOURCES
Click to access source
NOMIS website

Más contenido relacionado

Similar a Brighton & Hove local economy

UK Economic Performance - An Overview
UK Economic Performance - An OverviewUK Economic Performance - An Overview
UK Economic Performance - An Overviewtutor2u
 
Northern Ireland Labour Market Slide Pack - December 2013
Northern Ireland Labour Market Slide Pack - December 2013Northern Ireland Labour Market Slide Pack - December 2013
Northern Ireland Labour Market Slide Pack - December 2013Richard Ramsey
 
Unemployment Charts
Unemployment ChartsUnemployment Charts
Unemployment Chartstutor2u
 
SlideShare ONS Economic Forum Slidepack - 17 July 2023.pptx
SlideShare ONS Economic Forum Slidepack - 17 July 2023.pptxSlideShare ONS Economic Forum Slidepack - 17 July 2023.pptx
SlideShare ONS Economic Forum Slidepack - 17 July 2023.pptxMattBaker737276
 
Jonas Fluchtmann Presentation.pdf
Jonas Fluchtmann Presentation.pdfJonas Fluchtmann Presentation.pdf
Jonas Fluchtmann Presentation.pdfOECD Governance
 
Proposed budget 10 11
Proposed budget 10 11Proposed budget 10 11
Proposed budget 10 11Eric
 
Telling macro stories about productivity from micro data
Telling macro stories about productivity from micro dataTelling macro stories about productivity from micro data
Telling macro stories about productivity from micro dataStructuralpolicyanalysis
 
Employment unemployment
Employment unemploymentEmployment unemployment
Employment unemploymentmattbentley34
 
The Latvian Economy - No 7, September 14, 2011
The Latvian Economy - No 7, September 14, 2011The Latvian Economy - No 7, September 14, 2011
The Latvian Economy - No 7, September 14, 2011Swedbank
 
Barra Roantree, IFS, London - NERI Seminar presentation slides July 2016
Barra Roantree, IFS, London - NERI Seminar presentation slides July 2016Barra Roantree, IFS, London - NERI Seminar presentation slides July 2016
Barra Roantree, IFS, London - NERI Seminar presentation slides July 2016NevinInstitute
 

Similar a Brighton & Hove local economy (20)

Presentation
PresentationPresentation
Presentation
 
UK Economic Performance - An Overview
UK Economic Performance - An OverviewUK Economic Performance - An Overview
UK Economic Performance - An Overview
 
Northern Ireland Labour Market Slide Pack - December 2013
Northern Ireland Labour Market Slide Pack - December 2013Northern Ireland Labour Market Slide Pack - December 2013
Northern Ireland Labour Market Slide Pack - December 2013
 
ONS Economic Forum 26 April 2018
ONS Economic Forum 26 April 2018ONS Economic Forum 26 April 2018
ONS Economic Forum 26 April 2018
 
Boston's Economy - 2015
Boston's Economy - 2015Boston's Economy - 2015
Boston's Economy - 2015
 
Earnings Event
Earnings EventEarnings Event
Earnings Event
 
Unemployment Charts
Unemployment ChartsUnemployment Charts
Unemployment Charts
 
Uk economy update 2015
Uk economy update 2015Uk economy update 2015
Uk economy update 2015
 
ONS Economic Forum 26 July 2018
ONS Economic Forum 26 July 2018ONS Economic Forum 26 July 2018
ONS Economic Forum 26 July 2018
 
SlideShare ONS Economic Forum Slidepack - 17 July 2023.pptx
SlideShare ONS Economic Forum Slidepack - 17 July 2023.pptxSlideShare ONS Economic Forum Slidepack - 17 July 2023.pptx
SlideShare ONS Economic Forum Slidepack - 17 July 2023.pptx
 
Jonas Fluchtmann Presentation.pdf
Jonas Fluchtmann Presentation.pdfJonas Fluchtmann Presentation.pdf
Jonas Fluchtmann Presentation.pdf
 
Proposed budget 10 11
Proposed budget 10 11Proposed budget 10 11
Proposed budget 10 11
 
Telling macro stories about productivity from micro data
Telling macro stories about productivity from micro dataTelling macro stories about productivity from micro data
Telling macro stories about productivity from micro data
 
Employment unemployment
Employment unemploymentEmployment unemployment
Employment unemployment
 
Employment unemployment
Employment unemploymentEmployment unemployment
Employment unemployment
 
ONS Economic Forum Belfast
ONS Economic Forum Belfast ONS Economic Forum Belfast
ONS Economic Forum Belfast
 
The Latvian Economy - No 7, September 14, 2011
The Latvian Economy - No 7, September 14, 2011The Latvian Economy - No 7, September 14, 2011
The Latvian Economy - No 7, September 14, 2011
 
Lone Parent Incomes and Work Incentives
Lone Parent Incomes and Work Incentives Lone Parent Incomes and Work Incentives
Lone Parent Incomes and Work Incentives
 
Boston's Growing Economy
Boston's Growing EconomyBoston's Growing Economy
Boston's Growing Economy
 
Barra Roantree, IFS, London - NERI Seminar presentation slides July 2016
Barra Roantree, IFS, London - NERI Seminar presentation slides July 2016Barra Roantree, IFS, London - NERI Seminar presentation slides July 2016
Barra Roantree, IFS, London - NERI Seminar presentation slides July 2016
 

Más de Gavin Barker

A People's Constitution
A People's ConstitutionA People's Constitution
A People's ConstitutionGavin Barker
 
Our NHS - Key facts
Our NHS - Key factsOur NHS - Key facts
Our NHS - Key factsGavin Barker
 
Community currencies
Community currenciesCommunity currencies
Community currenciesGavin Barker
 
Local Money Multiplier (LM3)
Local Money Multiplier (LM3)Local Money Multiplier (LM3)
Local Money Multiplier (LM3)Gavin Barker
 
IMD data for East Sussex
IMD data for East SussexIMD data for East Sussex
IMD data for East SussexGavin Barker
 
East Sussex Local Economy
East Sussex Local EconomyEast Sussex Local Economy
East Sussex Local EconomyGavin Barker
 
East Sussex Health & Social Inequalities
East Sussex Health & Social InequalitiesEast Sussex Health & Social Inequalities
East Sussex Health & Social InequalitiesGavin Barker
 
Lewes CO2 emissions
Lewes CO2 emissionsLewes CO2 emissions
Lewes CO2 emissionsGavin Barker
 
Eastbourne CO2 emissions
Eastbourne CO2 emissionsEastbourne CO2 emissions
Eastbourne CO2 emissionsGavin Barker
 
indices of Deprivation
indices of Deprivationindices of Deprivation
indices of DeprivationGavin Barker
 
Health inequalities - Brighton
Health inequalities - BrightonHealth inequalities - Brighton
Health inequalities - BrightonGavin Barker
 
Community enterprise toolkit
Community enterprise toolkitCommunity enterprise toolkit
Community enterprise toolkitGavin Barker
 
Health Deprivation mapped
Health Deprivation mappedHealth Deprivation mapped
Health Deprivation mappedGavin Barker
 
Mapping deprivation and co-production
Mapping deprivation and co-productionMapping deprivation and co-production
Mapping deprivation and co-productionGavin Barker
 
Migration to the UK 2010
Migration to the UK 2010Migration to the UK 2010
Migration to the UK 2010Gavin Barker
 

Más de Gavin Barker (17)

A People's Constitution
A People's ConstitutionA People's Constitution
A People's Constitution
 
Our NHS - Key facts
Our NHS - Key factsOur NHS - Key facts
Our NHS - Key facts
 
Candidate replies
Candidate repliesCandidate replies
Candidate replies
 
Community currencies
Community currenciesCommunity currencies
Community currencies
 
Local Money Multiplier (LM3)
Local Money Multiplier (LM3)Local Money Multiplier (LM3)
Local Money Multiplier (LM3)
 
IMD data for East Sussex
IMD data for East SussexIMD data for East Sussex
IMD data for East Sussex
 
East Sussex Local Economy
East Sussex Local EconomyEast Sussex Local Economy
East Sussex Local Economy
 
East Sussex Health & Social Inequalities
East Sussex Health & Social InequalitiesEast Sussex Health & Social Inequalities
East Sussex Health & Social Inequalities
 
Lewes CO2 emissions
Lewes CO2 emissionsLewes CO2 emissions
Lewes CO2 emissions
 
Eastbourne CO2 emissions
Eastbourne CO2 emissionsEastbourne CO2 emissions
Eastbourne CO2 emissions
 
indices of Deprivation
indices of Deprivationindices of Deprivation
indices of Deprivation
 
Health inequalities - Brighton
Health inequalities - BrightonHealth inequalities - Brighton
Health inequalities - Brighton
 
Community enterprise toolkit
Community enterprise toolkitCommunity enterprise toolkit
Community enterprise toolkit
 
Health Deprivation mapped
Health Deprivation mappedHealth Deprivation mapped
Health Deprivation mapped
 
Mapping deprivation and co-production
Mapping deprivation and co-productionMapping deprivation and co-production
Mapping deprivation and co-production
 
Migration to the UK 2010
Migration to the UK 2010Migration to the UK 2010
Migration to the UK 2010
 
Who Pays?
Who Pays?Who Pays?
Who Pays?
 

Último

Influencing policy (training slides from Fast Track Impact)
Influencing policy (training slides from Fast Track Impact)Influencing policy (training slides from Fast Track Impact)
Influencing policy (training slides from Fast Track Impact)Mark Reed
 
Q4-PPT-Music9_Lesson-1-Romantic-Opera.pptx
Q4-PPT-Music9_Lesson-1-Romantic-Opera.pptxQ4-PPT-Music9_Lesson-1-Romantic-Opera.pptx
Q4-PPT-Music9_Lesson-1-Romantic-Opera.pptxlancelewisportillo
 
Inclusivity Essentials_ Creating Accessible Websites for Nonprofits .pdf
Inclusivity Essentials_ Creating Accessible Websites for Nonprofits .pdfInclusivity Essentials_ Creating Accessible Websites for Nonprofits .pdf
Inclusivity Essentials_ Creating Accessible Websites for Nonprofits .pdfTechSoup
 
ENG 5 Q4 WEEk 1 DAY 1 Restate sentences heard in one’s own words. Use appropr...
ENG 5 Q4 WEEk 1 DAY 1 Restate sentences heard in one’s own words. Use appropr...ENG 5 Q4 WEEk 1 DAY 1 Restate sentences heard in one’s own words. Use appropr...
ENG 5 Q4 WEEk 1 DAY 1 Restate sentences heard in one’s own words. Use appropr...JojoEDelaCruz
 
USPS® Forced Meter Migration - How to Know if Your Postage Meter Will Soon be...
USPS® Forced Meter Migration - How to Know if Your Postage Meter Will Soon be...USPS® Forced Meter Migration - How to Know if Your Postage Meter Will Soon be...
USPS® Forced Meter Migration - How to Know if Your Postage Meter Will Soon be...Postal Advocate Inc.
 
4.16.24 21st Century Movements for Black Lives.pptx
4.16.24 21st Century Movements for Black Lives.pptx4.16.24 21st Century Movements for Black Lives.pptx
4.16.24 21st Century Movements for Black Lives.pptxmary850239
 
EMBODO Lesson Plan Grade 9 Law of Sines.docx
EMBODO Lesson Plan Grade 9 Law of Sines.docxEMBODO Lesson Plan Grade 9 Law of Sines.docx
EMBODO Lesson Plan Grade 9 Law of Sines.docxElton John Embodo
 
Presentation Activity 2. Unit 3 transv.pptx
Presentation Activity 2. Unit 3 transv.pptxPresentation Activity 2. Unit 3 transv.pptx
Presentation Activity 2. Unit 3 transv.pptxRosabel UA
 
Expanded definition: technical and operational
Expanded definition: technical and operationalExpanded definition: technical and operational
Expanded definition: technical and operationalssuser3e220a
 
4.16.24 Poverty and Precarity--Desmond.pptx
4.16.24 Poverty and Precarity--Desmond.pptx4.16.24 Poverty and Precarity--Desmond.pptx
4.16.24 Poverty and Precarity--Desmond.pptxmary850239
 
ROLES IN A STAGE PRODUCTION in arts.pptx
ROLES IN A STAGE PRODUCTION in arts.pptxROLES IN A STAGE PRODUCTION in arts.pptx
ROLES IN A STAGE PRODUCTION in arts.pptxVanesaIglesias10
 
Activity 2-unit 2-update 2024. English translation
Activity 2-unit 2-update 2024. English translationActivity 2-unit 2-update 2024. English translation
Activity 2-unit 2-update 2024. English translationRosabel UA
 
Concurrency Control in Database Management system
Concurrency Control in Database Management systemConcurrency Control in Database Management system
Concurrency Control in Database Management systemChristalin Nelson
 
ANG SEKTOR NG agrikultura.pptx QUARTER 4
ANG SEKTOR NG agrikultura.pptx QUARTER 4ANG SEKTOR NG agrikultura.pptx QUARTER 4
ANG SEKTOR NG agrikultura.pptx QUARTER 4MiaBumagat1
 
MULTIDISCIPLINRY NATURE OF THE ENVIRONMENTAL STUDIES.pptx
MULTIDISCIPLINRY NATURE OF THE ENVIRONMENTAL STUDIES.pptxMULTIDISCIPLINRY NATURE OF THE ENVIRONMENTAL STUDIES.pptx
MULTIDISCIPLINRY NATURE OF THE ENVIRONMENTAL STUDIES.pptxAnupkumar Sharma
 
Keynote by Prof. Wurzer at Nordex about IP-design
Keynote by Prof. Wurzer at Nordex about IP-designKeynote by Prof. Wurzer at Nordex about IP-design
Keynote by Prof. Wurzer at Nordex about IP-designMIPLM
 
Millenials and Fillennials (Ethical Challenge and Responses).pptx
Millenials and Fillennials (Ethical Challenge and Responses).pptxMillenials and Fillennials (Ethical Challenge and Responses).pptx
Millenials and Fillennials (Ethical Challenge and Responses).pptxJanEmmanBrigoli
 
GRADE 4 - SUMMATIVE TEST QUARTER 4 ALL SUBJECTS
GRADE 4 - SUMMATIVE TEST QUARTER 4 ALL SUBJECTSGRADE 4 - SUMMATIVE TEST QUARTER 4 ALL SUBJECTS
GRADE 4 - SUMMATIVE TEST QUARTER 4 ALL SUBJECTSJoshuaGantuangco2
 

Último (20)

Influencing policy (training slides from Fast Track Impact)
Influencing policy (training slides from Fast Track Impact)Influencing policy (training slides from Fast Track Impact)
Influencing policy (training slides from Fast Track Impact)
 
Q4-PPT-Music9_Lesson-1-Romantic-Opera.pptx
Q4-PPT-Music9_Lesson-1-Romantic-Opera.pptxQ4-PPT-Music9_Lesson-1-Romantic-Opera.pptx
Q4-PPT-Music9_Lesson-1-Romantic-Opera.pptx
 
Inclusivity Essentials_ Creating Accessible Websites for Nonprofits .pdf
Inclusivity Essentials_ Creating Accessible Websites for Nonprofits .pdfInclusivity Essentials_ Creating Accessible Websites for Nonprofits .pdf
Inclusivity Essentials_ Creating Accessible Websites for Nonprofits .pdf
 
Paradigm shift in nursing research by RS MEHTA
Paradigm shift in nursing research by RS MEHTAParadigm shift in nursing research by RS MEHTA
Paradigm shift in nursing research by RS MEHTA
 
ENG 5 Q4 WEEk 1 DAY 1 Restate sentences heard in one’s own words. Use appropr...
ENG 5 Q4 WEEk 1 DAY 1 Restate sentences heard in one’s own words. Use appropr...ENG 5 Q4 WEEk 1 DAY 1 Restate sentences heard in one’s own words. Use appropr...
ENG 5 Q4 WEEk 1 DAY 1 Restate sentences heard in one’s own words. Use appropr...
 
USPS® Forced Meter Migration - How to Know if Your Postage Meter Will Soon be...
USPS® Forced Meter Migration - How to Know if Your Postage Meter Will Soon be...USPS® Forced Meter Migration - How to Know if Your Postage Meter Will Soon be...
USPS® Forced Meter Migration - How to Know if Your Postage Meter Will Soon be...
 
4.16.24 21st Century Movements for Black Lives.pptx
4.16.24 21st Century Movements for Black Lives.pptx4.16.24 21st Century Movements for Black Lives.pptx
4.16.24 21st Century Movements for Black Lives.pptx
 
EMBODO Lesson Plan Grade 9 Law of Sines.docx
EMBODO Lesson Plan Grade 9 Law of Sines.docxEMBODO Lesson Plan Grade 9 Law of Sines.docx
EMBODO Lesson Plan Grade 9 Law of Sines.docx
 
Presentation Activity 2. Unit 3 transv.pptx
Presentation Activity 2. Unit 3 transv.pptxPresentation Activity 2. Unit 3 transv.pptx
Presentation Activity 2. Unit 3 transv.pptx
 
Expanded definition: technical and operational
Expanded definition: technical and operationalExpanded definition: technical and operational
Expanded definition: technical and operational
 
4.16.24 Poverty and Precarity--Desmond.pptx
4.16.24 Poverty and Precarity--Desmond.pptx4.16.24 Poverty and Precarity--Desmond.pptx
4.16.24 Poverty and Precarity--Desmond.pptx
 
ROLES IN A STAGE PRODUCTION in arts.pptx
ROLES IN A STAGE PRODUCTION in arts.pptxROLES IN A STAGE PRODUCTION in arts.pptx
ROLES IN A STAGE PRODUCTION in arts.pptx
 
LEFT_ON_C'N_ PRELIMS_EL_DORADO_2024.pptx
LEFT_ON_C'N_ PRELIMS_EL_DORADO_2024.pptxLEFT_ON_C'N_ PRELIMS_EL_DORADO_2024.pptx
LEFT_ON_C'N_ PRELIMS_EL_DORADO_2024.pptx
 
Activity 2-unit 2-update 2024. English translation
Activity 2-unit 2-update 2024. English translationActivity 2-unit 2-update 2024. English translation
Activity 2-unit 2-update 2024. English translation
 
Concurrency Control in Database Management system
Concurrency Control in Database Management systemConcurrency Control in Database Management system
Concurrency Control in Database Management system
 
ANG SEKTOR NG agrikultura.pptx QUARTER 4
ANG SEKTOR NG agrikultura.pptx QUARTER 4ANG SEKTOR NG agrikultura.pptx QUARTER 4
ANG SEKTOR NG agrikultura.pptx QUARTER 4
 
MULTIDISCIPLINRY NATURE OF THE ENVIRONMENTAL STUDIES.pptx
MULTIDISCIPLINRY NATURE OF THE ENVIRONMENTAL STUDIES.pptxMULTIDISCIPLINRY NATURE OF THE ENVIRONMENTAL STUDIES.pptx
MULTIDISCIPLINRY NATURE OF THE ENVIRONMENTAL STUDIES.pptx
 
Keynote by Prof. Wurzer at Nordex about IP-design
Keynote by Prof. Wurzer at Nordex about IP-designKeynote by Prof. Wurzer at Nordex about IP-design
Keynote by Prof. Wurzer at Nordex about IP-design
 
Millenials and Fillennials (Ethical Challenge and Responses).pptx
Millenials and Fillennials (Ethical Challenge and Responses).pptxMillenials and Fillennials (Ethical Challenge and Responses).pptx
Millenials and Fillennials (Ethical Challenge and Responses).pptx
 
GRADE 4 - SUMMATIVE TEST QUARTER 4 ALL SUBJECTS
GRADE 4 - SUMMATIVE TEST QUARTER 4 ALL SUBJECTSGRADE 4 - SUMMATIVE TEST QUARTER 4 ALL SUBJECTS
GRADE 4 - SUMMATIVE TEST QUARTER 4 ALL SUBJECTS
 

Brighton & Hove local economy

  • 1. Brighton and Hove Labour Market Profile Brighton and Hove South East Great Britain 258,800 8,523,100 60,462,600 Population in Yr 2010 Source: unless otherwise stated, the data is based on the NOMIS profile for Brighton & Hove
  • 2. This presentation looks at Earnings by residence Brighton vs South East vs Great Britain (Year 2011) Employment by occupation Employee jobs (Year 2008) Employment and Unemployment Jul 2010 to June 2011 (% for ages 16 to 64) Qualifications
  • 3. Earnings by residence (2011) £548.80 £607.40 £541.70 £486.50 £474.30 £446.30 Brighton and Hove South East Great Britain Gross weekly pay Male full-time workers Female full-time workers Median earnings in pounds for employees living in the area. £9.33 per hour – the hourly wage required by a lone parent with one child to achieve the Minimum Income Standard £6.08 per hour: National Minimum Wage for workers over 21 years of age £7.63 per hour: the amount needed by a single adult working full time in order to meet the Minimum income standard Female full time workers earn significantly less across all regions However the gap is less in Brighton and Hove
  • 4. Employment by occupation 13.3 14.2 17.5 16 16.6 17.3 16.9 21.6 22 53.8 47.5 43.2 Brighton and Hove South East Great Britain Percentages Managers, directors, professional Administrative, secretarial, skilled trades Caring, leisure, sales, customer services, other services Machine operators, elementary occupations Brighton has a significantly higher proportion of managers and professionals compared to the rest of the UK
  • 5. Employee jobs (Yr 2008) 3% 3% 24% 5% 27% 31% 7% Brighton and Hove Manufacturing Construction Distribution, hotels & restaurants Transport & communications Finance, IT, other business activities Public admin, education & health Other services 8% 5% 25% 6% 24% 26% 6% South East 10% 5% 24% 6%22% 28% 5% Great Britain Notes The information comes from the Annual Business Inquiry (ABI) - an employer survey conducted in December of each year. The survey samples around 78,000 businesses. The ABI records a job at the location of an employee's workplace (rather than at the location of the business's main office). Public administration, education and health provided the largest number of employee jobs for Brighton
  • 6. Employee jobs – full time and part-time (Yr 2008) 64.6 69 68.8 35.4 31 31.2 Brighton and Hove South East Great Britain Percentages Full-time Part-time The Annual Business Inquiry defines part- time employees as those working for 30 or fewer hours per week.
  • 7. Employment and Unemployment Jul 2010 to June 2011 (% for ages 16 to 64) 58.1 63.9 60.7 11.5 10.4 9.1 7.6 5.9 7.7 Brighton and Hove South East Great Britain Percentages% Unemployed (model-based) Self employed Employees Model-based unemployed estimates are used to overcome the unreliability of very small samples used as part of the Annual Population Survey for unitary authorities and local authority districts. Unemployment estimates for counties are direct survey estimates. Economically active 75% 79.5% 76.2% Economically active: expressed as a percentage of people aged 16 to 64. They include the employed and unemployed. The unemployed refers to people without a job who were available to start work in the two weeks following their interview and who had either looked for work in the four weeks prior to interview or were waiting to start a job they had already obtained.
  • 8. Qualifications – percentages are for those aged 16 to 64 6.3 8.5 11.3 45.9 57.6 57.4 47.8 33.9 31.3 No qualifications Below NVQ4 Above NVQ4 Great Britain South East Brighton and Hove NVQ 4 equivalent and above: includes HND, Degree and Higher Degree level qualifications or equivalent No qualifications: no qualifications held Brighton has a significantly higher proportion of people with NVQ 4 qualifications and above
  • 9. Slideshow by Gavin Barker http://compasstraining.org/ KEY SOURCES Click to access source NOMIS website