SlideShare una empresa de Scribd logo
1 de 1
Descargar para leer sin conexión
Puget Sound Area, Office
MarketView Quick Stats
Q4 2012                                                                                                                                                                                    CBRE Global Research and Consulting


                                                                                                                         Class A Avg.                  Class A Avg.
                                                                                                                         Asking Direct                 Asking Total                                          Last 4
                                                                        Building                   Total                  Lease Rate                   Lease Rate   4Q Net                                  Qtrs Net                Under
               Submarket                                                   SF                   Vacancy %              (Full Service PSF/Yr) (Full Service PSF/Yr) Absorption                              Absorption             Construction
                Downtown Seattle                                      43,693,219                  14.3%                                $32.29                       $31.41             588,497              1,929,083                 300,955
                Seattle Close-In                                        5,113,527                 16.4%                                $24.83                       $24.83             167,071                 467,415                155,000
                Southend                                                9,791,487                 20.5%                                $22.04                       $21.42               94,740                  88,346                      —
                Eastside                                              30,398,126                  13.6%                                $29.13                       $28.36               56,452                595,406                    19,000
                Northend                                                4,538,718                 22.7%                                $23.71                       $23.68            (22,527)                  (9,925)                      —
                Tacoma/Fife                                             4,762,704                 18.8%                                $23.96                       $25.81               43,944                  58,011                      —
                Market Total                                       98,297,781                    15.4%                               $29.36                       $28.55             928,177               3,128,336                 474,955

                                                                                                                                                                                      Total Vacancy Rate        15.41%
                                         Total Vacancy vs. Average Direct Asking Lease Rate                                                                        Total Class A Avg. Asking Rental Rate        $28.55


                                          20%
                                                                                                                                                                                                            $30.00
                                          18%
                                          16%                                                                                                                                                               $25.00
                                          14%
                                          12%                                                                                                                                                               $20.00
                                          10%                                                                                                                                                               $15.00
                                            8%
                                            6%                                                                                                                                                              $10.00
                                            4%
                                                                                                                                                                                                            $5.00
                                            2%
                                            0%                                                                                                                                                              $0.00
                                                           2007                      2008                     2009                      2010                     2011                      2012

                                                              Downtown           $31.41         Northend        $23.68
              Total Asking                               Seattle Close-In        $24.83      Tacoma/Fife        $25.81                      Under Construction, Absorption                                             Total Absorption      928,177
                                                                                            Regional Avg.                                                                                                     Construction Completions       431,690
              Rental Rates                                     Southend
                                                                 Eastside
                                                                                 $21.42
                                                                                 $28.36
                                                                                                                $28.55
                                                                                                                                            & Construction Completions                                              Under Construction       474,955

             $32.00                                                                                                                      1,000,000
                                                                                                                                           900,000
             $30.00
                                                                                                                                           800,000
                                                                                                                                           700,000
             $28.00
                                                                                                                                           600,000
             $26.00                                                                                                                        500,000
                                                                                                                                           400,000
             $24.00
                                                                                                                                           300,000

             $22.00                                                                                                                        200,000
                                                                                                                                           100,000
             $20.00                                                                                                                                0
                            3Q11             4Q11             1Q12            2Q12             3Q12            4Q12                                         3Q11            4Q11            1Q12            2Q12            3Q12           4Q12

	                                   1420 Fifth Avenue | Suite 1700	                                         10885 NE 4th Street | Suite 500 	                                      1201 Pacific Avenue | Suite 1502
	                                 Seattle, WA 98101 | 206.292.1600	                                      Bellevue, WA 98004 | 425.455.8500	                                      Tacoma, WA 98402 | 253.572.6355	

Information contained herein, including projections, has been obtained from sources believed to be reliable. While we do not doubt its accuracy, we have not verified it and make no guarantee, warranty or representation
about it. It is your responsibility to confirm independently its accuracy and completeness. This information is presented exclusively for use by CBRE clients and professionals and all rights to the material are reserved and
cannot be reproduced without prior written permission of the CBRE Global Chief Economist. cjm 01-16-13

Más contenido relacionado

La actualidad más candente

southwest airline ar02
southwest airline ar02southwest airline ar02
southwest airline ar02finance40
 
Gta office market statistics 2011 q2
Gta office market statistics 2011 q2Gta office market statistics 2011 q2
Gta office market statistics 2011 q2Chris Fyvie
 
Tech M&A Outlook - presented by Mgi research bloomberg l.p. march 2012 conf...
Tech M&A Outlook - presented by Mgi research   bloomberg l.p. march 2012 conf...Tech M&A Outlook - presented by Mgi research   bloomberg l.p. march 2012 conf...
Tech M&A Outlook - presented by Mgi research bloomberg l.p. march 2012 conf...MGI_Research
 
stryker 0D01F279-9F33-4E3E-A708-FE2047EF5E47_Stryker08AR.Single
stryker 0D01F279-9F33-4E3E-A708-FE2047EF5E47_Stryker08AR.Singlestryker 0D01F279-9F33-4E3E-A708-FE2047EF5E47_Stryker08AR.Single
stryker 0D01F279-9F33-4E3E-A708-FE2047EF5E47_Stryker08AR.Singlefinance34
 
Q1 2009 Earning Report of Westamerica Bancorporation
Q1 2009 Earning Report of Westamerica BancorporationQ1 2009 Earning Report of Westamerica Bancorporation
Q1 2009 Earning Report of Westamerica Bancorporationearningreport earningreport
 
Singapore Corporate Tax Rates 2013
Singapore Corporate Tax Rates 2013Singapore Corporate Tax Rates 2013
Singapore Corporate Tax Rates 2013rikvinsingapore
 
A Cheaper Hospital In Five Days
A Cheaper Hospital In Five DaysA Cheaper Hospital In Five Days
A Cheaper Hospital In Five DaysJay Arthur
 
southwest airline ar99
southwest airline ar99southwest airline ar99
southwest airline ar99finance40
 
loews 2 CNA Lilienthal Mense
loews 2 CNA Lilienthal Mense loews 2 CNA Lilienthal Mense
loews 2 CNA Lilienthal Mense finance14
 
southwest airline ar00
southwest airline ar00southwest airline ar00
southwest airline ar00finance40
 
leggett & platt 2006_fin_complete
leggett & platt 2006_fin_completeleggett & platt 2006_fin_complete
leggett & platt 2006_fin_completefinance39
 
2 Q08 Results Presentation
2 Q08 Results Presentation2 Q08 Results Presentation
2 Q08 Results PresentationLocaliza
 

La actualidad más candente (15)

southwest airline ar02
southwest airline ar02southwest airline ar02
southwest airline ar02
 
Gta office market statistics 2011 q2
Gta office market statistics 2011 q2Gta office market statistics 2011 q2
Gta office market statistics 2011 q2
 
Toronto Market Watch East
Toronto Market Watch EastToronto Market Watch East
Toronto Market Watch East
 
Tech M&A Outlook - presented by Mgi research bloomberg l.p. march 2012 conf...
Tech M&A Outlook - presented by Mgi research   bloomberg l.p. march 2012 conf...Tech M&A Outlook - presented by Mgi research   bloomberg l.p. march 2012 conf...
Tech M&A Outlook - presented by Mgi research bloomberg l.p. march 2012 conf...
 
stryker 0D01F279-9F33-4E3E-A708-FE2047EF5E47_Stryker08AR.Single
stryker 0D01F279-9F33-4E3E-A708-FE2047EF5E47_Stryker08AR.Singlestryker 0D01F279-9F33-4E3E-A708-FE2047EF5E47_Stryker08AR.Single
stryker 0D01F279-9F33-4E3E-A708-FE2047EF5E47_Stryker08AR.Single
 
Q1 2009 Earning Report of Westamerica Bancorporation
Q1 2009 Earning Report of Westamerica BancorporationQ1 2009 Earning Report of Westamerica Bancorporation
Q1 2009 Earning Report of Westamerica Bancorporation
 
Singapore Corporate Tax Rates 2013
Singapore Corporate Tax Rates 2013Singapore Corporate Tax Rates 2013
Singapore Corporate Tax Rates 2013
 
Media Buying Platform Ecosystem
Media Buying Platform EcosystemMedia Buying Platform Ecosystem
Media Buying Platform Ecosystem
 
Toronto Central Market Watch
Toronto Central Market WatchToronto Central Market Watch
Toronto Central Market Watch
 
A Cheaper Hospital In Five Days
A Cheaper Hospital In Five DaysA Cheaper Hospital In Five Days
A Cheaper Hospital In Five Days
 
southwest airline ar99
southwest airline ar99southwest airline ar99
southwest airline ar99
 
loews 2 CNA Lilienthal Mense
loews 2 CNA Lilienthal Mense loews 2 CNA Lilienthal Mense
loews 2 CNA Lilienthal Mense
 
southwest airline ar00
southwest airline ar00southwest airline ar00
southwest airline ar00
 
leggett & platt 2006_fin_complete
leggett & platt 2006_fin_completeleggett & platt 2006_fin_complete
leggett & platt 2006_fin_complete
 
2 Q08 Results Presentation
2 Q08 Results Presentation2 Q08 Results Presentation
2 Q08 Results Presentation
 

Similar a Puget Sound Q4 2012 Office Market

3 Q08 Results Presentation
3 Q08 Results Presentation3 Q08 Results Presentation
3 Q08 Results PresentationLocaliza
 
3 Q08 Results Presentation
3 Q08 Results Presentation3 Q08 Results Presentation
3 Q08 Results PresentationLocaliza
 
R&D Operations Cost 2010
R&D Operations Cost 2010R&D Operations Cost 2010
R&D Operations Cost 2010Zinnov
 
Office market dashboard 2011 q2 central
Office market dashboard 2011 q2   centralOffice market dashboard 2011 q2   central
Office market dashboard 2011 q2 centralChris Fyvie
 
Dt east office market dashboard 2011 q1
Dt east office market dashboard 2011 q1Dt east office market dashboard 2011 q1
Dt east office market dashboard 2011 q1Chris Fyvie
 
Soma Q209 Office Report
Soma Q209 Office ReportSoma Q209 Office Report
Soma Q209 Office ReportLiz Hart
 
whirlpool Annual Report2006
whirlpool Annual Report2006whirlpool Annual Report2006
whirlpool Annual Report2006finance13
 
whirlpool Financial Highlights / Chairman's Letter
whirlpool Financial Highlights / Chairman's Letterwhirlpool Financial Highlights / Chairman's Letter
whirlpool Financial Highlights / Chairman's Letterfinance13
 
4 Q07 Results Presentation
4 Q07 Results Presentation4 Q07 Results Presentation
4 Q07 Results PresentationLocaliza
 
1 Q08 Results Presentation
1 Q08 Results Presentation1 Q08 Results Presentation
1 Q08 Results PresentationLocaliza
 
1 Q08 Results Presentation
1 Q08 Results Presentation1 Q08 Results Presentation
1 Q08 Results PresentationLocaliza
 
2 Q08 Results Presentation
2 Q08 Results Presentation2 Q08 Results Presentation
2 Q08 Results PresentationLocaliza
 
starbucks 2007AR
starbucks  2007ARstarbucks  2007AR
starbucks 2007ARfinance41
 
starbucks 2007AR
starbucks  2007ARstarbucks  2007AR
starbucks 2007ARfinance41
 
Loopnet Q4 2009 Insight Report 1 16 09
Loopnet Q4 2009 Insight Report 1 16 09Loopnet Q4 2009 Insight Report 1 16 09
Loopnet Q4 2009 Insight Report 1 16 09aporrazzo
 
Mountain View Office Update Q309 (3)
Mountain View Office Update Q309 (3)Mountain View Office Update Q309 (3)
Mountain View Office Update Q309 (3)Liz Hart
 
Downtown office market dashboard 2011 q1
Downtown office market dashboard 2011 q1Downtown office market dashboard 2011 q1
Downtown office market dashboard 2011 q1Chris Fyvie
 
nordstrom AnnualReport2006
nordstrom AnnualReport2006nordstrom AnnualReport2006
nordstrom AnnualReport2006finance43
 

Similar a Puget Sound Q4 2012 Office Market (20)

MHK07/03/07
MHK07/03/07MHK07/03/07
MHK07/03/07
 
MHK07/03/07
MHK07/03/07MHK07/03/07
MHK07/03/07
 
3 Q08 Results Presentation
3 Q08 Results Presentation3 Q08 Results Presentation
3 Q08 Results Presentation
 
3 Q08 Results Presentation
3 Q08 Results Presentation3 Q08 Results Presentation
3 Q08 Results Presentation
 
R&D Operations Cost 2010
R&D Operations Cost 2010R&D Operations Cost 2010
R&D Operations Cost 2010
 
Office market dashboard 2011 q2 central
Office market dashboard 2011 q2   centralOffice market dashboard 2011 q2   central
Office market dashboard 2011 q2 central
 
Dt east office market dashboard 2011 q1
Dt east office market dashboard 2011 q1Dt east office market dashboard 2011 q1
Dt east office market dashboard 2011 q1
 
Soma Q209 Office Report
Soma Q209 Office ReportSoma Q209 Office Report
Soma Q209 Office Report
 
whirlpool Annual Report2006
whirlpool Annual Report2006whirlpool Annual Report2006
whirlpool Annual Report2006
 
whirlpool Financial Highlights / Chairman's Letter
whirlpool Financial Highlights / Chairman's Letterwhirlpool Financial Highlights / Chairman's Letter
whirlpool Financial Highlights / Chairman's Letter
 
4 Q07 Results Presentation
4 Q07 Results Presentation4 Q07 Results Presentation
4 Q07 Results Presentation
 
1 Q08 Results Presentation
1 Q08 Results Presentation1 Q08 Results Presentation
1 Q08 Results Presentation
 
1 Q08 Results Presentation
1 Q08 Results Presentation1 Q08 Results Presentation
1 Q08 Results Presentation
 
2 Q08 Results Presentation
2 Q08 Results Presentation2 Q08 Results Presentation
2 Q08 Results Presentation
 
starbucks 2007AR
starbucks  2007ARstarbucks  2007AR
starbucks 2007AR
 
starbucks 2007AR
starbucks  2007ARstarbucks  2007AR
starbucks 2007AR
 
Loopnet Q4 2009 Insight Report 1 16 09
Loopnet Q4 2009 Insight Report 1 16 09Loopnet Q4 2009 Insight Report 1 16 09
Loopnet Q4 2009 Insight Report 1 16 09
 
Mountain View Office Update Q309 (3)
Mountain View Office Update Q309 (3)Mountain View Office Update Q309 (3)
Mountain View Office Update Q309 (3)
 
Downtown office market dashboard 2011 q1
Downtown office market dashboard 2011 q1Downtown office market dashboard 2011 q1
Downtown office market dashboard 2011 q1
 
nordstrom AnnualReport2006
nordstrom AnnualReport2006nordstrom AnnualReport2006
nordstrom AnnualReport2006
 

Más de GilWhiteCRE

CBRE 2012 corporate responsibility_infographics
CBRE 2012 corporate responsibility_infographicsCBRE 2012 corporate responsibility_infographics
CBRE 2012 corporate responsibility_infographicsGilWhiteCRE
 
Energy Star Top cities chart
Energy Star Top cities chartEnergy Star Top cities chart
Energy Star Top cities chartGilWhiteCRE
 
2013 overall incentives_ranking
2013 overall incentives_ranking2013 overall incentives_ranking
2013 overall incentives_rankingGilWhiteCRE
 
Puget sound office market Q3 2012
Puget sound office market Q3 2012Puget sound office market Q3 2012
Puget sound office market Q3 2012GilWhiteCRE
 
CBRE U.S. Industrial Marketview
CBRE U.S. Industrial MarketviewCBRE U.S. Industrial Marketview
CBRE U.S. Industrial MarketviewGilWhiteCRE
 
Western U.S. view point april 2012
Western U.S. view point april 2012Western U.S. view point april 2012
Western U.S. view point april 2012GilWhiteCRE
 
Blog speakingof greenin2011[1]
Blog speakingof greenin2011[1]Blog speakingof greenin2011[1]
Blog speakingof greenin2011[1]GilWhiteCRE
 

Más de GilWhiteCRE (8)

CBRE 2012 corporate responsibility_infographics
CBRE 2012 corporate responsibility_infographicsCBRE 2012 corporate responsibility_infographics
CBRE 2012 corporate responsibility_infographics
 
Energy Star Top cities chart
Energy Star Top cities chartEnergy Star Top cities chart
Energy Star Top cities chart
 
2013 overall incentives_ranking
2013 overall incentives_ranking2013 overall incentives_ranking
2013 overall incentives_ranking
 
Puget sound office market Q3 2012
Puget sound office market Q3 2012Puget sound office market Q3 2012
Puget sound office market Q3 2012
 
CBRE U.S. Industrial Marketview
CBRE U.S. Industrial MarketviewCBRE U.S. Industrial Marketview
CBRE U.S. Industrial Marketview
 
Western U.S. view point april 2012
Western U.S. view point april 2012Western U.S. view point april 2012
Western U.S. view point april 2012
 
101 tipsoffice
101 tipsoffice101 tipsoffice
101 tipsoffice
 
Blog speakingof greenin2011[1]
Blog speakingof greenin2011[1]Blog speakingof greenin2011[1]
Blog speakingof greenin2011[1]
 

Puget Sound Q4 2012 Office Market

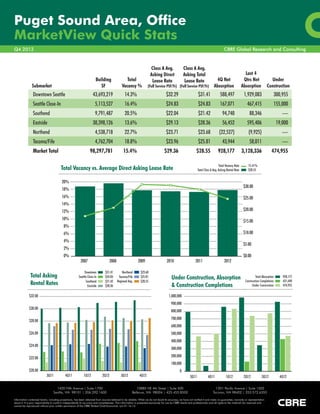
  • 1. Puget Sound Area, Office MarketView Quick Stats Q4 2012 CBRE Global Research and Consulting Class A Avg. Class A Avg. Asking Direct Asking Total Last 4 Building Total Lease Rate Lease Rate 4Q Net Qtrs Net Under Submarket SF Vacancy % (Full Service PSF/Yr) (Full Service PSF/Yr) Absorption Absorption Construction Downtown Seattle 43,693,219 14.3% $32.29 $31.41 588,497 1,929,083 300,955 Seattle Close-In 5,113,527 16.4% $24.83 $24.83 167,071 467,415 155,000 Southend 9,791,487 20.5% $22.04 $21.42 94,740 88,346 — Eastside 30,398,126 13.6% $29.13 $28.36 56,452 595,406 19,000 Northend 4,538,718 22.7% $23.71 $23.68 (22,527) (9,925) — Tacoma/Fife 4,762,704 18.8% $23.96 $25.81 43,944 58,011 — Market Total 98,297,781 15.4% $29.36 $28.55 928,177 3,128,336 474,955 Total Vacancy Rate 15.41% Total Vacancy vs. Average Direct Asking Lease Rate Total Class A Avg. Asking Rental Rate $28.55 20% $30.00 18% 16% $25.00 14% 12% $20.00 10% $15.00 8% 6% $10.00 4% $5.00 2% 0% $0.00 2007 2008 2009 2010 2011 2012 Downtown $31.41 Northend $23.68 Total Asking Seattle Close-In $24.83 Tacoma/Fife $25.81 Under Construction, Absorption Total Absorption 928,177 Regional Avg. Construction Completions 431,690 Rental Rates Southend Eastside $21.42 $28.36 $28.55 & Construction Completions Under Construction 474,955 $32.00 1,000,000 900,000 $30.00 800,000 700,000 $28.00 600,000 $26.00 500,000 400,000 $24.00 300,000 $22.00 200,000 100,000 $20.00 0 3Q11 4Q11 1Q12 2Q12 3Q12 4Q12 3Q11 4Q11 1Q12 2Q12 3Q12 4Q12 1420 Fifth Avenue | Suite 1700 10885 NE 4th Street | Suite 500 1201 Pacific Avenue | Suite 1502 Seattle, WA 98101 | 206.292.1600 Bellevue, WA 98004 | 425.455.8500 Tacoma, WA 98402 | 253.572.6355 Information contained herein, including projections, has been obtained from sources believed to be reliable. While we do not doubt its accuracy, we have not verified it and make no guarantee, warranty or representation about it. It is your responsibility to confirm independently its accuracy and completeness. This information is presented exclusively for use by CBRE clients and professionals and all rights to the material are reserved and cannot be reproduced without prior written permission of the CBRE Global Chief Economist. cjm 01-16-13