SlideShare una empresa de Scribd logo
1 de 2
Descargar para leer sin conexión
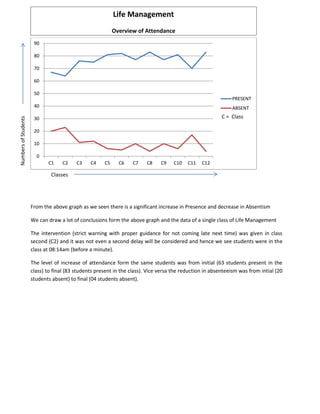
From the above graph as we seen there is a significant increase in Presence and decrease in Absentism 
We can draw a lot of conclusions form the above graph and the data of a single class of Life Management 
The intervention (strict warning with proper guidance for not coming late next time) was given in class second (C2) and it was not even a second delay will be considered and hence we see students were in the class at 08:14am (before a minute). 
The level of increase of attendance form the same students was from initial (63 students present in the class) to final (83 students present in the class). Vice versa the reduction in absenteeism was from intial (20 students absent) to final (04 students absent). 
0 
10 
20 
30 
40 
50 
60 
70 
80 
90 
C1 
C2 
C3 
C4 
C5 
C6 
C7 
C8 
C9 
C10 
C11 
C12 
PRESENT 
ABSENT 
C = Class Life Management Overview of Attendance Classes Numbers of Students
Students – Attendance Percentage 
0 
5 
10 
15 
20 
25 
30 
100% 
90-100% 
80-90% 
70-80% 
60-70% 
50-60% 
Below 
50% 
Studetns - Attendence Percentage 
Studetns Number 
Percentage Range 
Number of Students 
Remark 
100 
26 
Present in all classes 
90-100 
24 
Present in all except one class 
80-90 
20 
Present in all except two classes 
70-80 
10 
Present in all except three classes 
60-70 
04 
Present in all except four classes 
50-60 
01 
Present in all except five classes 
Below 50 
02 
Present in all except six or more classes

Más contenido relacionado

Más de Dev Sanskriti Vishwavidyalaya (University)

Más de Dev Sanskriti Vishwavidyalaya (University) (20)

Yoga
YogaYoga
Yoga
 
हस्ती
हस्तीहस्ती
हस्ती
 
एक अनजानी दौड़ में
एक अनजानी दौड़ मेंएक अनजानी दौड़ में
एक अनजानी दौड़ में
 
Cms
CmsCms
Cms
 
Campus placements
Campus placementsCampus placements
Campus placements
 
Tech giants & top it companies india manan manish
Tech giants & top it companies india  manan manishTech giants & top it companies india  manan manish
Tech giants & top it companies india manan manish
 
Idea gopal-krishna-sharma-dsvv
Idea gopal-krishna-sharma-dsvvIdea gopal-krishna-sharma-dsvv
Idea gopal-krishna-sharma-dsvv
 
SYSTEM
SYSTEMSYSTEM
SYSTEM
 
Research Ethics
Research EthicsResearch Ethics
Research Ethics
 
Metadata describes about data
Metadata describes about dataMetadata describes about data
Metadata describes about data
 
The scientific method
The scientific methodThe scientific method
The scientific method
 
The effects of teacher
The effects of teacherThe effects of teacher
The effects of teacher
 
Syllabus of cybershiksha 2
Syllabus of cybershiksha 2Syllabus of cybershiksha 2
Syllabus of cybershiksha 2
 
Research problem copy
Research problem   copyResearch problem   copy
Research problem copy
 
Obsersve yourself
Obsersve yourselfObsersve yourself
Obsersve yourself
 
Bachelor of computer applications
Bachelor of computer applicationsBachelor of computer applications
Bachelor of computer applications
 
Management information systems and decision
Management information systems and decisionManagement information systems and decision
Management information systems and decision
 
Artificial Consciousness
Artificial ConsciousnessArtificial Consciousness
Artificial Consciousness
 
Case study on village devp.
Case study on village devp.Case study on village devp.
Case study on village devp.
 
Research writing
Research writingResearch writing
Research writing
 

Attendence report

  • 1. From the above graph as we seen there is a significant increase in Presence and decrease in Absentism We can draw a lot of conclusions form the above graph and the data of a single class of Life Management The intervention (strict warning with proper guidance for not coming late next time) was given in class second (C2) and it was not even a second delay will be considered and hence we see students were in the class at 08:14am (before a minute). The level of increase of attendance form the same students was from initial (63 students present in the class) to final (83 students present in the class). Vice versa the reduction in absenteeism was from intial (20 students absent) to final (04 students absent). 0 10 20 30 40 50 60 70 80 90 C1 C2 C3 C4 C5 C6 C7 C8 C9 C10 C11 C12 PRESENT ABSENT C = Class Life Management Overview of Attendance Classes Numbers of Students
  • 2. Students – Attendance Percentage 0 5 10 15 20 25 30 100% 90-100% 80-90% 70-80% 60-70% 50-60% Below 50% Studetns - Attendence Percentage Studetns Number Percentage Range Number of Students Remark 100 26 Present in all classes 90-100 24 Present in all except one class 80-90 20 Present in all except two classes 70-80 10 Present in all except three classes 60-70 04 Present in all except four classes 50-60 01 Present in all except five classes Below 50 02 Present in all except six or more classes