Cyclical trend of labor reallocation: transition and structural change
May 2015 Jobs Report Observations (Grant Toch)
1. May 2015 Jobs Report Observations
As hasbecome customary,myjobsreportcommentsstayaway fromthe headline dataandtalk only to those data
pointsthatI findinteresting. Commentsinvolve threebroadtopics:(i) the numberof jobs;(ii) the quality of the jobs;
and (iii) wages.
1. Numberof Jobs
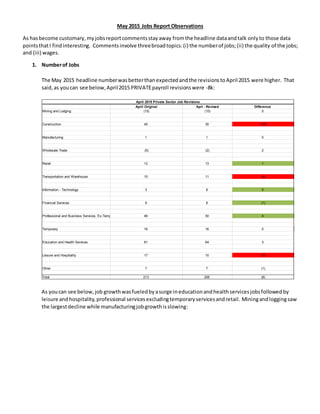
The May 2015 headline numberwasbetterthanexpectedandthe revisionstoApril 2015 were higher. That
said,as youcan see below,April2015 PRIVATEpayroll revisionswere -8k:
As youcan see below,job growthwasfueledbyasurge ineducationandhealthservicesjobsfollowedby
leisure andhospitality,professional servicesexcludingtemporaryservicesandretail. Miningandloggingsaw
the largestdecline while manufacturingjobgrowthisslowing:
April Original Aprl - Revised Difference
Mining and Lodging (15) (15) 0
Construction 45 35 (10)
Manufacturing 1 1 0
Wholesale Trade (5) (2) 2
Retail 12 13 1
Transportation and Warehouse 15 11 (4)
Information - Technology 3 8 5
Financial Services 9 8 (1)
Professional and Business Services, Ex-Temp 46 50 4
Temporary 16 16 0
Education and Health Services 61 64 3
Leisure and Hospitality 17 10 (7)
Other 7 7 (1)
Total 213 206 (8)
April 2015 Private Sector Job Revisions
2. We make a fewcommentsabouta few of the highlightedsectorsbelow:
a. Education and Health: ambulatoryhealthcare servicesandhospitalemployeesare leadingthe surge
b. Leisure and Hospitality: performingarts,spectatorsports,amusementparks,gambling,accommodation,
and restaurantsare seeingthe growth
c. Miningand Logging: No one issurprisedthese jobs are decliningbut the decline has almost nothingto
do with oil and gas extraction and is beingfeltonlyin support activitiesfor mining. Focusing on the oil
and gas extractionjob sub-sector,we can see job losshas beenminimal here:
May June July August September October November December January February March April May Total
Mining and Lodging 2 5 9 2 6 2 1 1 (7) (14) (12) (15) (18) (38)
% of total -1.2%
Construction 9 8 30 17 18 16 30 44 41 31 (9) 35 17 287
% of total 9.0%
Manufacturing 15 21 24 3 20 24 45 19 17 3 0 1 7 199
% of total 6.2%
Wholesale Trade 6 13 3 5 3 8 8 14 12 10 10 (2) 4 95
% of total 3.0%
Retail 12 35 21 (4) 40 33 61 (0) 35 23 25 13 31 326
% of total 10.2%
Transportation and Warehouse 17 13 21 11 7 13 26 38 (13) 9 8 11 13 175
% of total 5.5%
Information - Technology (6) 11 10 14 3 (6) 7 6 6 7 0 8 (3) 57
% of total 1.8%
Financial Services 8 19 15 12 14 4 28 7 19 9 7 8 13 163
% of total 5.1%
Professional and Business Services, Ex-Temp 43 55 34 28 43 32 65 51 28 53 22 50 43 547
% of total . 17.2%
Temporary 15 15 16 21 23 19 31 21 (8) (4) 13 16 20 197
% of total 6.2%
Education and Health Services 58 48 37 50 35 44 51 54 42 61 35 64 74 653
% of total 20.5%
Leisure and Hospitality 45 21 10 26 47 60 42 56 24 61 (6) 10 57 453
% of total 14.2%
Other 4 (5) 3 11 0 5 19 8 5 11 2 7 3 73
% of total 2.3%
Total 227 260 233 197 259 254 414 319 202 261 95 206 262 3,187
Average 245
Private Job Detail (May 2014-May 2015), Revised
3. This contrasts with the decline inthe rig count:
As a result,oil and gas extractionjobs per rig is now approaching all time highs:
100
120
140
160
180
200
220
240
260
280
2/1/1972
10/1/1973
6/1/1975
2/1/1977
10/1/1978
6/1/1980
2/1/1982
10/1/1983
6/1/1985
2/1/1987
10/1/1988
6/1/1990
2/1/1992
10/1/1993
6/1/1995
2/1/1997
10/1/1998
6/1/2000
2/1/2002
10/1/2003
6/1/2005
2/1/2007
10/1/2008
6/1/2010
2/1/2012
10/1/2013
Oil and Gas Extraction Jobs, Level Data
Oil and Gas Extraction Jobs, Level Data
100
600
1,100
1,600
2,100
2,600
1/1/1991
1/1/1992
1/1/1993
1/1/1994
1/1/1995
1/1/1996
1/1/1997
1/1/1998
1/1/1999
1/1/2000
1/1/2001
1/1/2002
1/1/2003
1/1/2004
1/1/2005
1/1/2006
1/1/2007
1/1/2008
1/1/2009
1/1/2010
1/1/2011
1/1/2012
1/1/2013
1/1/2014
1/1/2015
Baker Hughes Rig Count
Baker Hughes Rig Count
6. Perhapsnoone wants a job:
98
100
102
104
106
108
110
6/1/2009
9/1/2009
12/1/2009
3/1/2010
6/1/2010
9/1/2010
12/1/2010
3/1/2011
6/1/2011
9/1/2011
12/1/2011
3/1/2012
6/1/2012
9/1/2012
12/1/2012
3/1/2013
6/1/2013
9/1/2013
12/1/2013
3/1/2014
6/1/2014
9/1/2014
12/1/2014
3/1/2015
Civilian Labor Force versus Total People Employed
(Household Survey) versus Non-Farm Payrolls
(Establishment Survey) - June 2009 to Present Where
June 2009 = 100
Civilian Labor Force Total People Employed (Household Survey)
Non-Farm Payrolls (Establishment Survey)
7. 2. Quality of Jobs
At a highlevel,jobgrowthisnottranslatingintoGDPgrowth,at leastnotat levelswe are accustomedto
seeing:
29.0%
30.0%
31.0%
32.0%
33.0%
34.0%
35.0%
36.0%
1/1/1994
10/1/1994
7/1/1995
4/1/1996
1/1/1997
10/1/1997
7/1/1998
4/1/1999
1/1/2000
10/1/2000
7/1/2001
4/1/2002
1/1/2003
10/1/2003
7/1/2004
4/1/2005
1/1/2006
10/1/2006
7/1/2007
4/1/2008
1/1/2009
10/1/2009
7/1/2010
4/1/2011
1/1/2012
10/1/2012
7/1/2013
4/1/2014
1/1/2015
Not In Labor Force AND Do NOT Want a Job/Civilian
Non-Institutional Population
Not In Labor Force AND Do NOT Want a Job
9. Relative tothe size of the laborforce,full time jobs remainwell below pre-recessionlevels:
Part-time jobsdiddeclineBUTONLY BECAUSE OF DECINESIN THOSE WORKINGPART-TIME FORNON-
ECONOMICREASONS (blue line). THOSEWORKING PART-TIME BECAUSE OF SLACK ECONOMICCONDITIONS
(redline) AND BECAUSE THE PERSON COULD NOT FIND FULL TIME WORK(greenline) ACTUALLY
INCREASED:
80%
81%
81%
82%
82%
83%
83%
84%
1/1/2000
9/1/2000
5/1/2001
1/1/2002
9/1/2002
5/1/2003
1/1/2004
9/1/2004
5/1/2005
1/1/2006
9/1/2006
5/1/2007
1/1/2008
9/1/2008
5/1/2009
1/1/2010
9/1/2010
5/1/2011
1/1/2012
9/1/2012
5/1/2013
1/1/2014
9/1/2014
5/1/2015
Full Time Employees/Total Labor Force
(2000-Present)
Full Time Employees/Total Labor Force (2000-Present)
10. If those working part time because they cannot find full time were back at pre-recessionlevels,the full
time work force would be almost 1.2m workers greater than current levels.
3. Wages
Average hourlywage growthhasbrokenoutof itsmulti-yearrange:
50.0
60.0
70.0
80.0
90.0
100.0
110.0
120.0
130.0
140.0
6/1/2009
9/1/2009
12/1/2009
3/1/2010
6/1/2010
9/1/2010
12/1/2010
3/1/2011
6/1/2011
9/1/2011
12/1/2011
3/1/2012
6/1/2012
9/1/2012
12/1/2012
3/1/2013
6/1/2013
9/1/2013
12/1/2013
3/1/2014
6/1/2014
9/1/2014
12/1/2014
3/1/2015
Part Time Workers By Reason (June 2009 =
100 For Each Category)
Non-Economic Reasons Slack Business Conditions Can Only Find Part Time Work
11. But 80% of the workforce isnot sharingin this trend:
Lookingbelow,we see thattwoof the three fastestgrowingjobssectors(greenhighlightsinleftcolumn) have
wagesgrowingfasterthanthe y/yaverage wage growthrate. That said,twoof these three sectorshave overall
average hourlywagesbelowthe average hourlywage (onanunweightedbasis):
1.50%
2.00%
2.50%
3.00%
3.50%
4.00%
Average Hourly Wages Nominal, Y/Y
Ave ra ge Hourly Wag es, Y /Y
0.0%
2.0%
4.0%
6.0%
8.0%
10.0%
1965-01-01
1967-01-01
1969-01-01
1971-01-01
1973-01-01
1975-01-01
1977-01-01
1979-01-01
1981-01-01
1983-01-01
1985-01-01
1987-01-01
1989-01-01
1991-01-01
1993-01-01
1995-01-01
1997-01-01
1999-01-01
2001-01-01
2003-01-01
2005-01-01
2007-01-01
2009-01-01
2011-01-01
2013-01-01
2015-01-01
Average Hourly Earnings of Production and
NonsupervisoryEmployees, Private Sector,
Y/Y
Average Hourly Earnings of Production and Nonsupervisory Employees, Private Sector,
Y/Y
12. Overall,thisisthe chart thatmust be reconciled. Eitherspendingmustaccelerateorrevisionstothe jobsdata
mightjustbe meaningfullynegative:
For those interested,beloware the chartsof the average hourlywagesbyjobsector. Six sectorsare growing
above average andfive sectorsare growingbelow average. Wholesale trade saw the markedacceleration:
Type % of Overall Growth Average Wage Growth, y/y Average Hourly Wage Growth, 3 Month Annual % of Labor Force Average Hourly Wage
Leisure and Hospitality 14.2% 3.6% 3.6% 10.2% $14.32
Financial Services 5.1% 3.0% 3.0% 4.1% $31.52
Construction 9.0% 2.7% 2.7% 4.3% $27.34
Professional and Business Services, Ex-Temp 17.2% 2.6% 2.6% 14.8% $29.98
Retail 10.2% 2.5% 2.5% 10.5% $17.41
Wholesale Trade 3.0% 2.4% 2.4% 4.0% $28.73
Information - Technology 1.8% 2.2% 2.2% 1.9% $34.63
Other 2.3% 2.2% 2.2% 3.8% $22.36
Education and Health Services 20.5% 2.1% 2.1% 14.8% $25.19
Manufacturing 6.2% 1.8% 1.8% 8.3% $25.16
Mining and Lodging -1.2% 0.6% 0.6% 0.5% $31.02
Temporary 6.2% 2.0%
Transportation and Warehouse 5.5% 3.2%
Average 7.7% 2.4% 2.9% $26.15
Private Sector Job Growth, May 2014 - May 2015
0.0%
2.0%
4.0%
6.0%
8.0%
10.0%
12.0%
14.0%
PersonalConsumption Expenditures, Nominal
Deflated by Non-Farm Payrolls
Personal Consumption Expenditures, Nominal Deflated by Non-Farm Payrolls Average