Enviar búsqueda
Cargar
Gunnebo Second Quarter Report Presentation 2014
•
0 recomendaciones
•
467 vistas
Gunnebo Group
Seguir
Gunnebo's interim report for January-June 2014 and for the second quarter of 2014.
Leer menos
Leer más
Denunciar
Compartir
Denunciar
Compartir
1 de 13
Descargar ahora
Descargar para leer sin conexión
Recomendados
Gunnebo Interim Report January-September 2013
Gunnebo Group
Gunnebo First Quarter Report 2015
Gunnebo Group
Gunnebo Third Quarter Report 2014
Gunnebo Group
Gunnebo Year End Release 2013
Gunnebo UK
Gunnebo Year-End Report 2013
Gunnebo Group
Gunnebo Q2 Report 2015
Gunnebo Group
Gunnebo Q3 Report 2015
Gunnebo Group
Generali Group 1Q 2016 Results
Generali
Generali Group 9M Results 2015
Generali
Generali Group 2016 First Half Results
Generali
Generali Group 1Q 2015 Results
Generali
Garmin Q1 2014 Earnings
Ludovic Privat
2016 Investor Day Presentation
Generali
Generali Group 2015 First Half Results
Generali
Investors Presentation 9M|2020 Results
AndreGro
Victrex - Half Yearly Results 2013
Company Spotlight
Metso Financial Statements Review 2014: presentation
Metso Group
Generali Group Results at 31 December 2015
Generali
Budget sample
Budget sample
CA Gourang Shah
Q2 2015 RESULTS by Sanofi
Sanofi
Luxottica Group 1Q 2014 Results Presentation
Luxottica Group
Credit Suisse Presentation, September 18 2014
DupontInv
1 q15
1 q15
Profarma
1Q15 Earnings Presentation
DirecionalRI
Victrex - Full Year Results 2013
Company Spotlight
Electrolux Interim Report Q3 2015
Electrolux Group
2015 Investor Day Presentation
Generali
Stora Enso's Annual General Meeting 2014, presentation
Stora Enso
Gunnebo Q1 Report 2016
Gunnebo Group
Gunnebo In Brief
Gunnebo In Brief
Gunnebo Group
Más contenido relacionado
La actualidad más candente
Generali Group 9M Results 2015
Generali
Generali Group 2016 First Half Results
Generali
Generali Group 1Q 2015 Results
Generali
Garmin Q1 2014 Earnings
Ludovic Privat
2016 Investor Day Presentation
Generali
Generali Group 2015 First Half Results
Generali
Investors Presentation 9M|2020 Results
AndreGro
Victrex - Half Yearly Results 2013
Company Spotlight
Metso Financial Statements Review 2014: presentation
Metso Group
Generali Group Results at 31 December 2015
Generali
Budget sample
Budget sample
CA Gourang Shah
Q2 2015 RESULTS by Sanofi
Sanofi
Luxottica Group 1Q 2014 Results Presentation
Luxottica Group
Credit Suisse Presentation, September 18 2014
DupontInv
1 q15
1 q15
Profarma
1Q15 Earnings Presentation
DirecionalRI
Victrex - Full Year Results 2013
Company Spotlight
Electrolux Interim Report Q3 2015
Electrolux Group
2015 Investor Day Presentation
Generali
Stora Enso's Annual General Meeting 2014, presentation
Stora Enso
La actualidad más candente
(20)
Generali Group 9M Results 2015
Generali Group 2016 First Half Results
Generali Group 1Q 2015 Results
Garmin Q1 2014 Earnings
2016 Investor Day Presentation
Generali Group 2015 First Half Results
Investors Presentation 9M|2020 Results
Victrex - Half Yearly Results 2013
Metso Financial Statements Review 2014: presentation
Generali Group Results at 31 December 2015
Budget sample
Budget sample
Q2 2015 RESULTS by Sanofi
Luxottica Group 1Q 2014 Results Presentation
Credit Suisse Presentation, September 18 2014
1 q15
1 q15
1Q15 Earnings Presentation
Victrex - Full Year Results 2013
Electrolux Interim Report Q3 2015
2015 Investor Day Presentation
Stora Enso's Annual General Meeting 2014, presentation
Destacado
Gunnebo Q1 Report 2016
Gunnebo Group
Gunnebo In Brief
Gunnebo In Brief
Gunnebo Group
Gunnebo Q4 Report 2015
Gunnebo Group
Gunnebo First Quarter Report 2014
Gunnebo Group
Gunnebo In Brief
Gunnebo In Brief
Gunnebo Group
Gunnebo Interim Report Jan-Sep 2012
Gunnebo Group
Gunnebo Year-End Release 2012
Gunnebo Group
Gunnebo Capital Market Day 2016
Gunnebo Group
Gunnebo's Capital Market Day in Stockholm 2012
Gunnebo Group
Gunnebo Q2 Report 2016
Gunnebo Group
Destacado
(10)
Gunnebo Q1 Report 2016
Gunnebo In Brief
Gunnebo In Brief
Gunnebo Q4 Report 2015
Gunnebo First Quarter Report 2014
Gunnebo In Brief
Gunnebo In Brief
Gunnebo Interim Report Jan-Sep 2012
Gunnebo Year-End Release 2012
Gunnebo Capital Market Day 2016
Gunnebo's Capital Market Day in Stockholm 2012
Gunnebo Q2 Report 2016
Similar a Gunnebo Second Quarter Report Presentation 2014
Gunnebo second quarter report 2014
Gunnebo UK
HeidelbergCement: Q3 2014 Presentation
HeidelbergCement
Interim Report January - September 2013
Gunnebo UK
Merck: Q1 2014 Results Conference Call
Merck
Gcpl 1 qfy2015ru_310714
Bhavnesh Mutha
Full year results 2013
Ageas
TCS Fact Sheet Q4 FY14
Tata Consultancy Services
Bruker q1 2014 earnings presentation final
InvestorBruker
Merck: Q2 2014 Results Conference Call
Merck
Gafisa 4 q14 teleconf eng rev
Gafisa RI !
Ramirent January-March 2014 Interim Report
Annika Berg
Risultati 2013 Generali
Insurance Lab - Formazione Assicurativa
Generali Group 2013 Full Year Results
Generali
UAC annual report 2014
Michael Olafusi
Gunnebo Interim Report January-June 2013
Gunnebo Group
2013 Full Year Results conference
Nestlé SA
Vivimed labs ltd_3QFY15 Presentation
Jigar Savla
Luxottica Group 3Q 2014 Results Presentation
Luxottica Group
TELES AG Interim Report Q2 2014
TELES AG Informationstechnologien
Sap q2 2014_results
Sap q2 2014_results
Company Spotlight
Similar a Gunnebo Second Quarter Report Presentation 2014
(20)
Gunnebo second quarter report 2014
HeidelbergCement: Q3 2014 Presentation
Interim Report January - September 2013
Merck: Q1 2014 Results Conference Call
Gcpl 1 qfy2015ru_310714
Full year results 2013
TCS Fact Sheet Q4 FY14
Bruker q1 2014 earnings presentation final
Merck: Q2 2014 Results Conference Call
Gafisa 4 q14 teleconf eng rev
Ramirent January-March 2014 Interim Report
Risultati 2013 Generali
Generali Group 2013 Full Year Results
UAC annual report 2014
Gunnebo Interim Report January-June 2013
2013 Full Year Results conference
Vivimed labs ltd_3QFY15 Presentation
Luxottica Group 3Q 2014 Results Presentation
TELES AG Interim Report Q2 2014
Sap q2 2014_results
Sap q2 2014_results
Gunnebo Second Quarter Report Presentation 2014
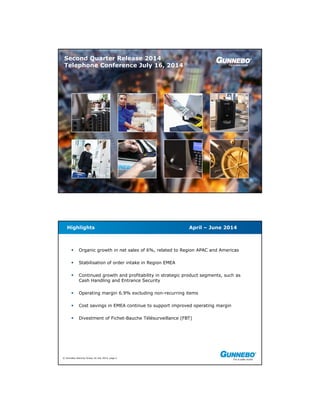
1.
Second Quarter Release
2014 Telephone Conference July 16, 2014 © Gunnebo Security Group 16 July 2014, page 2 Organic growth in net sales of 6%, related to Region APAC and Americas Stabilisation of order intake in Region EMEA Continued growth and profitability in strategic product segments, such as Cash Handling and Entrance Security Operating margin 6.9% excluding non-recurring items Cost savings in EMEA continue to support improved operating margin Divestment of Fichet-Bauche Télésurveillance (FBT) Highlights April – June 2014
2.
© Gunnebo Security
Group 16 July 2014, page 3 Divestment of Fichet-Bauche Télésurveillance The Gunnebo Security Group has divested Fichet-Bauche Télésurveillance (FBT) to Butler Group. FBT provides alarm monitoring and intervention services to companies and private individuals on the French market. The divestment of FBT is in line with our strategy to phase out those areas of Gunnebo, which are not part of our defined core business or where we do not have the opportunity to attain a significant market position. FBT recorded a turnover of 50 MSEK for 2013 and has around 45 employees. The transaction has had a positive effect on the Group’s operating results for the second quarter of 73 MSEK and a positive effect on the Group’s cash flow of 77 MSEK. The transaction has been reported as a non-recurring item in the quarter. Press release June 13, 2014 © Gunnebo Security Group 16 July 2014, page 4 Gunnebo Group April – June * * Free cash flow from operating and investing activities, excluding acquisitions and divestments April - June 2014 2013 Net Sales, MSEK 1,419 1,325 Operating Profit, excluding non-recurring, MSEK 98 69 Operating Margin, excl. non-recurring, % 6.9 5.2 Non-recurring items, MSEK 43 -12 Operating Profit, MSEK 141 57 Operating Margin, (%) 9.9 4.3 Free cash flow, MSEK 44 -47 Net Profit, MSEK 106 34
3.
© Gunnebo Security
Group 16 July 2014, page 5 Gunnebo Group January – June * Free cash flow from operating and investing activities, excluding acquisitions and divestments * January - June 2014 2013 Net Sales, MSEK 2,669 2,480 Operating Profit, excluding non-recurring, MSEK 136 80 Operating Margin, excl. non-recurring, % 5.1 3.2 Non-recurring items, MSEK 23 -22 Operating Profit (EBIT), MSEK 159 58 Operating Margin, (%) 6.0 2.3 Free cash flow, MSEK -24 -99 Net Profit, MSEK 103 22 © Gunnebo Security Group 16 July 2014, page 6 Region Europe, Middle East & Africa (EMEA) April - June Trend shows a stabilisation of order intake Cash Handling, especially SafePay, and Entrance Security continues to contribute to the growth Cost savings and efficiency positively impact operating margin Divestment of Fichet-Bauche Télésurveillance (FBT) Coop and Gunnebo in partnership in the Nordic countries A branch office in Oman opened to strengthen presence in Middle East Region % of Net Sales Region Europe, Middle East & Africa April-June Jan-June Full year MSEK 2014 2013 2014 2013 2013 Order intake 908 896 1,978 1,920 3,558 Organic growth, % -3 -1 Net sales 925 887 1,767 1,648 3,474 Organic growth, % 0 3 Operating profit/loss excl. non-recurring items 30 13 29 -20 47 Operating margin excl. non-recurring items, % 3.2 1.5 1.6 -1.2 1.4 Non-recurring items 51 -8 32 -18 -74 Operating profit/loss 81 5 61 -38 -27
4.
© Gunnebo Security
Group 16 July 2014, page 7 Region Asia-Pacific (APAC) Region % of Net Sales April - June Lower order intake in the quarter. Political election in India impacted the demand. Increased net sales, notably in India, China and Australia. Strong operating profit and margin improvement. Region Asia-Pacific April-June Jan-June Full year MSEK 2014 2013 2014 2013 2013 Order intake 232 270 490 522 1,043 Organic growth, % -8 2 Net sales 281 238 502 451 954 Organic growth, % 24 20 Operating profit/loss excl. non-recurring items 42 32 66 61 134 Operating margin excl. non-recurring items, % 14.9 13.4 13.1 13.5 14.0 Non-recurring items -5 -4 -6 -4 -8 Operating profit/loss 37 28 60 57 126 © Gunnebo Security Group 16 July 2014, page 8 Region Americas April - June Order intake down in quarter, mainly due to major order received in Mexico in second quarter 2013 Strong sales growth to banks in North and Latin America Strong and stable operating margin Region % of Net Sales Region Americas April-June Jan-June Full year MSEK 2014 2013 2014 2013 2013 Order intake 190 288 368 511 913 Organic growth, % -31 -25 Net sales 213 200 400 381 843 Organic growth, % 9 8 Operating profit/loss excl. non-recurring items 26 24 41 39 125 Operating margin excl. non-recurring items, % 12.2 12.0 10.3 10.2 14.8 Non-recurring items -3 0 -3 0 -2 Operating profit/loss 23 24 38 39 123
5.
© Gunnebo Security
Group 16 July 2014, page 9 Organic Growth Development by Region April – June 2014 Americas Orders: -31% Sales: 9% EMEA Orders: -3% Sales: 0% APAC Orders: -8% Sales: 24% © Gunnebo Security Group 16 July 2014, page 10 Organic Growth Development by Region January – June 2014 Americas Orders: -25% Sales: 8% EMEA Orders: -1% Sales: 3% APAC Orders: 2% Sales: 20%
6.
© Gunnebo Security
Group 16 July 2014, page 11 Outlook Market Trends Europe, Middle East & Africa Nordic Central South United Kingdom & Ireland France Middle East Africa Asia‐Pacific India China Australia/New Zealand South‐East Asia Americas North America Latin America © Gunnebo Security Group 16 July 2014, page 12 FINANCIALS Christian Johansson CFO
7.
© Gunnebo Security
Group 16 July 2014, page 13 Income Statement April – June Summary Group income statement MSEK 2014 2013 Net sales 1,419 1,325 Cost of goods sold -1,007 -918 Gross profit 412 407 Other operating costs, net -271 -350 Operating profit/loss 141 57 Net financial items -11 -7 Profit/loss after financial items 130 50 Taxes -24 -16 Profit/loss for the period 106 34 Gross margin, % 29.0 30.7 Operating margin, % 9.9 4.3 Operating profit excl. non-recurring items, MSEK 98 69 Operating profit excl. non-recurring items, % 6.9 5.2 Earnings per share, SEK 1.40 0.45 April-June © Gunnebo Security Group 16 July 2014, page 14 Income Statement January – June Summary Group income statement MSEK 2014 2013 Net sales 2,669 2,480 Cost of goods sold -1,901 -1,745 Gross profit 768 735 Other operating costs, net -609 -677 Operating profit/loss 159 58 Net financial items -19 -16 Profit/loss after financial items 140 42 Taxes -37 -20 Profit/loss for the period 103 22 Gross margin, % 28.8 29.6 Operating margin, % 6.0 2.3 Operating profit excl. non-recurring items, MSEK 136 80 Operating profit excl. non-recurring items, % 5.1 3.2 Earnings per share, SEK 1.36 0.29 Jan-June
8.
© Gunnebo Security
Group 16 July 2014, page 15 Net Sales (MSEK) 4 000 4 500 5 000 5 500 6 000 6 500 Q1 Q2 Q3 Q4 Q1 Q2 Q3 Q4 Q1 Q2 2012 2013 2014 4 Quarters 2 Quarters x 2 1 Quarter x 4 © Gunnebo Security Group 16 July 2014, page 16 Net Sales Organic Growth Quarter vs Quarter (%)
9.
© Gunnebo Security
Group 16 July 2014, page 17 Operating Profit by Quarter (MSEK) Operating Profit Operating Profit, excl. non-recurring items Full year Operating Profit excl. non-recurring items 2013: 306 2012: 266 Operating Profit 2013: 222 2012: 179 98 MSEK * * Non-recurring items amounted to +43 MSEK © Gunnebo Security Group 16 July 2014, page 18 Operating Margin by Quarter (%) Operating Margin %, Quarter Operating Margin % Quarter, excl. non-recurring items Operating Margin %, 12M Operating Margin % 12M, excl. non-recurring items Full year Operating Margin, excl. non-recurring items 2013: 5.8 2012: 5.1 Operating Margin 2013: 4.2 2012: 3.4 * Operating Margin, excl. non-recurring items 2014 Q2: 6.9 6.9% *
10.
© Gunnebo Security
Group 16 July 2014, page 19 Free Cash Flow by Quarter (MSEK) Year End 2013: 144 2012: 21 Free Cash Flow 12M © Gunnebo Security Group 16 July 2014, page 20 Net Debt (MSEK)
11.
© Gunnebo Security
Group 16 July 2014, page 21 Debt Structure (MSEK) © Gunnebo Security Group 16 July 2014, page 22 Financial Calendar Financial Calendar Interim report January-September 2014 October 23, 2014 Year-end release 2014 February 4, 2015 Annual General Meeting 2015 April 15, 2015 Interim report January-March 2015 April 28, 2015
12.
© Gunnebo Security
Group 16 July 2014, page 23 Growth Gross Margin Improvements Fixed Cost Savings in Europe Cash Flow Key Priorities 2014 © Gunnebo Security Group 16 July 2014, page 24 Q&A
13.
© Gunnebo Security
Group 16 July 2014, page 25 www.gunnebogroup.com
Descargar ahora