

Recomendados
Más contenido relacionado
La actualidad más candente
La actualidad más candente (20)
Similar a Repo aggregate
Similar a Repo aggregate (20)
Último
Último (20)
Repo aggregate
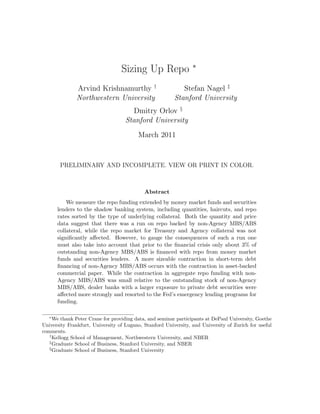
- 1. ∗ Sizing Up Repo Arvind Krishnamurthy † Stefan Nagel ‡ Northwestern University Stanford University Dmitry Orlov § Stanford University March 2011 PRELIMINARY AND INCOMPLETE. VIEW OR PRINT IN COLOR. Abstract We measure the repo funding extended by money market funds and securities lenders to the shadow banking system, including quantities, haircuts, and repo rates sorted by the type of underlying collateral. Both the quantity and price data suggest that there was a run on repo backed by non-Agency MBS/ABS collateral, while the repo market for Treasury and Agency collateral was not significantly affected. However, to gauge the consequences of such a run one must also take into account that prior to the financial crisis only about 3% of outstanding non-Agency MBS/ABS is financed with repo from money market funds and securities lenders. A more sizeable contraction in short-term debt financing of non-Agency MBS/ABS occurs with the contraction in asset-backed commercial paper. While the contraction in aggregate repo funding with non- Agency MBS/ABS was small relative to the outstanding stock of non-Agency MBS/ABS, dealer banks with a larger exposure to private debt securities were affected more strongly and resorted to the Fed’s emergency lending programs for funding. ∗ We thank Peter Crane for providing data, and seminar participants at DePaul University, Goethe University Frankfurt, University of Lugano, Stanford University, and University of Zurich for useful comments. † Kellogg School of Management, Northwestern University, and NBER ‡ Graduate School of Business, Stanford University, and NBER § Graduate School of Business, Stanford University
- 2. I Introduction Most analyses of the financial crisis of 2007-09 highlight the rapid expansion of the shadow banking sector in the period from 2000 to 2007 and the subsequent collapse of the sector during the crisis (see Adrian and Shin (2010), Brunnermeier (2009), Gorton and Metrick (2011b)). A wide variety of loans, including residential mortgages, auto loans, and credit card loans, which a decade ago were held by the commercial banking sector and financed by bank deposits were instead held by shadow banks and financed by repurchase agreements (repo) and asset-backed commercial paper (ABCP) (see Figure 1). As with traditional banks, the funding structure employed by shadow banks was short-term. However, unlike traditional banks there was no regulatory structure that offered safety to the shadow-bank depositors. In a series of papers, Gorton and Metrick (2010, 2011b, 2011a) have argued that the repo market played a key role in the collapse of the shadow banking system through a “run on repo” very much akin to the runs on commercial banks that plagued the U.S. prior to the establishment of the Federal Reserve System. Much of the discussion of the repo market has run ahead of our measurement of the repo market (see Geanakoplos (2009); Gorton and Metrick (2011a); Shleifer (2010)). Because of a lack of data, we know little about basic questions: How big is the repo market? How much did it contract during the crisis? What type of collateral is most commonly financed in the repo market? How did this change over the crisis? As a consequence, it is difficult to evaluate how much of a factor the repo market run was in contributing to the financial crisis. This paper attempts to fill this gap with a new data set on the repo agreements of money market funds (MMFs) complemented with data on repos of security lenders. 1
- 3. $6,+7(%+,# !"&% -(./(# 8(9&# "01.2# =&+12) '()*+,(-.% >*(9&2672?# !&%7/+/(2# !"&% /0+1% @AB#C:5D# 345# $%&'(%) !!"# *(+,(%# ;+2F# !"&% :$;4# 3(<0%6E(2# ;&,,+7(%+,## <&1.067# !"#$% ,(1.(%# Figure 1: Short-term Funding Flows in the Shadow Banking System These sectors are significant lenders of cash in the repo market. For example, in 2007Q2, they lent a total of $940bn of cash in the repo market, which accounts for about two thirds of the total repo funding that the shadow banking system obtained from cash lenders. The MMF data is extracted from quarterly SEC filings of MMF. The security lender data is from the Risk Management Association (RMA). We also analyze data from the Federal Reserve’s emergency lending problems in 2008 and 2009 to understand how much these actions counteracted the run in the repo market. Here are our five principal findings: 1. The contraction in repo in the crisis was small compared to the outstanding stock of non-Agency MBS/ABS. In the period before the crisis, repo from MMFs and security lenders on non-Agency MBS/ABS total $171bn, which implies that only 3% of outstanding non-Agency MBS/ABS is financed by repo from MMFs or security lenders. 2
- 4. 2. As a contrast, consider the contraction in ABCP. Both ABCP and repo are prototypical shadow banking funding transactions: (a) the repo finances an ABS that is held by a dealer bank or similar investor; (b) the ABCP finances a special purpose vehicle (SPV) which holds ABS. Both of these transactions involve an ABS that is funded by essentially risk-free short-term debt. In case (a), this occurs by lenders setting a high enough haircut that they can be guaranteed a riskless loan. In case (b), this occurs by a sponsoring bank offering credit or liquidity support to the SPV (see Acharya, Schnabl, and Suarez (2010)). In the period before the crisis, ABCP finances 22% of the outstanding non-Agency MBS/ABS, which is an order of magnitude more than repo. In the crisis, from 2007 Q2 to 2009 Q2, there is a $1.4 trillion contraction in short-term funding of non-Agency MBS/ABS. Of this, $662bn comes from the reduction in outstanding ABCP while $171bn of the contraction comes from the disappearance of repo. This data suggest that ABCP played a more significant role than the repo market in supporting both the expansion and contraction of the shadow banking sector. The repo market is significant, but it is a sideshow compared to the happenings in ABCP. 3. The data suggests that there was a run on repo that was driven by money market investors desire to avoid repo loans collateralized by risky/illiquid securities. In particular, there is no contraction in quantity of repo of Agency and Treasury collateral, while there is a significant contraction in the quantity of repo backed by non-Agency ABS/MBS. There is no significant increase in the “price” terms of repo (maturities, repo rates, haircuts) for Agency and Treasury collateral, while there is an increase in these price-terms for repo backed by non-Agency 3
- 5. MBS/ABS. The contraction in quantity and increase in price terms is suggestive of decreased demand for extending repo loans against non-Agency MBS/ABS. Finally, looking at the price terms on repos done by different dealer banks, all of the variation is captured by the variation in the underlying repo collateral, with little to no variation due to the differences in credit risk (CDS) of the different dealer banks. That is, there appears to have been a run on the repo backed by non-Agency MBS/ABS rather than a generalized run on certain financial intermediaries. However, an important caveat with our data is that we cannot observe repo at high frequency so that we will not observe a run that occurs at the time-scale of days. 4. While the repo contraction on non-Agency MBS/ABS appears small for the shadow banking system, we find evidence that it played a more significant role for some dealer banks. For Merrill Lynch, Goldman Sachs, Morgan Stanley and Citigroup, nearly 50% of their repo transactions with MMFs prior to the crisis were backed by non-Agency MBS/ABS and corporate debt, and almost all of this repo from MMFs disappears in the crisis. 5. In analyzing the Federal Reserve’s programs, we find that TSLF and PDCF absorbed much of the contraction in repo funding of non-Agency MBS/ABS and corporate debt. Subsequently, the Maiden Lane SPVs took on a substantial share. These programs quantitatively offset the contraction in private repo, until they were wound down in mid-2009. The dealer banks that were funding private collateral via repo prior to the crisis are the same ones that turn to the TSLF and PDCF during the crisis. These findings are consistent with the views of many commentators that there was 4
- 6. a run on the short-term debt financing that had supported the shadow banking sector and led to its demise in the crisis. These points have been made most prominently by Gorton and Metrick, as well as Adrian and Shin (see Gorton and Metrick (2010, 2011b, 2011a) Adrian and Shin (2010)). However, relatively speaking, the run on repo is small which makes it hard to argue that it was the central driver of the contraction of the shadow banking sector, contradicting the explanations of Gorton-Metrick and Adrian- Shin. The more significant short-term debt run occurs on asset-backed commercial paper (Acharya, Schnabl, and Suarez (2010)). The effects of the run on repo seem most important for a select group of dealer banks who were heavy funders of private collateral in the repo market. Our findings shed less light on the underlying drivers of the run-up in short-term debt financing prior to the crisis. The importance of ABCP is consistent with the regulatory arbitrage arguments of Acharya, Schnabl, and Suarez (2010). The run- up in both repo and ABCP is also consistent with the increased “money demand” argument of Gorton and Metrick, or the global imbalances argument of (Caballero and Krishnamurthy (2009)). Our data is most suited to analyze the consequences of the contraction in repo. The main concern with the validity of these conclusions is whether we are missing important repo lenders and thus do not have a full picture of the repo market. In 2007Q4, our total coverage of repo from MMFs and security lenders is $1.1tn. The Flow of Funds accounts for 2007Q4 (December 2010 release) estimates that the other large lenders through repo were State and Local Governments ($163bn), Government Sponsored Enterprises ($143bn), and Rest of the World ($338bn). If these Flow of Funds estimates are correct, then our data covers about two-thirds of repo lenders. However, because data on the repo market is scant, there is uncertainty in these Flow 5
- 7. of Funds estimates. Our own cursory investigations of other possible repo lenders has not turned up any other significant sources of funding. In particular, while corpora- tions were cash-rich during this period, any repo lending they do appears to be via institutional MMFs, indicating that corporate lending is covered in our MMF sample. The Treasury’s TIC data puts the repo lending of foreign central banks at between $100 and $200bn (these numbers are likely incorporated in the Flow of Funds’ Rest of the World entry). Another specific concern is whether repo data as reported by dealer banks in filings to the SEC and the Federal Reserve would not tell a different story. We do not use such data. Our objective is to estimate the amount of short-term lending provided to the shadow banking system by cash lenders outside of the shadow banking system. The dealer bank repo data is not suitable for this purpose, because it is subject to a serious double-counting problem.1 Suppose dealer bank A lends $1 to a hedge fund via a repo (collateralized by $1.02 of Treasuries), and then borrows the $1 from dealer bank B via a repo (collateralized by the same $1.02 of Treasuries), who then borrows $1 from a MMF (collateralized by the same $1.02 of Treasuries). This chain is typical in the repo market, and occurs commonly because collateral is rehypothecated. Note that total repo loans across these four institutions is $3. However, the “true” repo activity in this case is only the $1 from the MMF backed by the $1.02 of Treasury collateral that is posted by the hedge fund; the activity along the chain between dealer bank A and B nets out. Because dealer banks both borrow and lend cash and rehypothecate collateral extensively, data from this sector is subject to a significant multiples problem.2 Singh 1 A double-counting problem also exists in data on tri-party repo provided by the two tri-party agents, Bank of New York Mellon and JPMorgan Chase, and analyzed in Copeland, Martin, and Walker (2010) from July 2008 onwards. These data include GCF repo, which is a form of inter-dealer repo. 2 Prime brokerage is an important business for dealer banks. In this business, the dealer bank lends cash to a hedge fund against repo collateral. The dealer bank then rehypothecates the collateral to 6
- 8. and Aitken (2010) estimate that the multiples problem was substantial, with extensive rehypothecation of collateral between banks and dealers to take advantage of their respective funding specialization. By focusing on entities like MMF and securities lenders that channel cash from outside into the shadow banking system, our repo quantity estimates are not subject to this double-counting problem. This rationale for excluding inter-(shadow)bank repo is analogous to similar consid- erations about interbank deposits in the calculation of the money stock M2. Interbank deposits are not included in M2, because M2 is meant to measure the amount of deposit funding provided by the non-bank public to the banking system. By exclud- ing interbank deposits, M2 measures the quantity of loans to non-bank entities that are funded by deposits from non-bank entities. Interbank deposits are analogous to inter-(shadow)bank repo in that these loans to non-bank entities are ”rehypothecated” (although only indirectly, because interbank deposits are unsecured, and the loans are therefore commingled with other assets on the banks’ balance sheets) within the banking system. The gross size of the repo market may be relevant for other questions that are not our focus here. For example, a high level of inter-dealer repo could affect the probability that defaults propagate from dealer to dealer in the same way as a high level of inter-dealer over-the-counter derivatives exposures could (Duffie and Zhu (2010)). Our focus, however, is not on the systemic risk contribution of inter-dealer repos but on the importance of repo for shadow bank funding from cash lenders outside the shadow banking system. Related Literature: To be added. another dealer bank (or a MMF) to raise the funds for the hedge fund loan. Dealer banks also run an active repo book, where they buy and sell repo throughout the day. This activity also involves rehypothecating collateral between borrowers and lenders. All of this rehypothecation as part of regular business makes the dealer bank data uninformative about the net size of the repo market. 7
- 9. II Repurchase Agreements We start by describing the main features of repurchase agreements that are important for understanding our results. We then describe the Money Market Fund SEC filings and the securities lender data that we use in the analysis. A more in-depth treatment of the institutional features of the repo market can be found, e.g., in Duffie (1996), Garbade (2006), and Federal Reserve Bank of New York (2010). A Background on Repurchase Agreements A repo involves the simultaneous sale and forward agreement to repurchase the same, or a similar, security at some point in the future. Effectively, a repo constitutes a collateralized loan in which a cash-rich party lends to a borrower and receives securities as collateral until the loan is repaid. The borrower pays the cash lender interest in the form of the repo rate. The borrower typically also has to post collateral in excess of the notional amount of the loan (the ”haircut”). The haircut is defined as 1 − C/F with collateral value C and notional amount F . For example, a repo in which the borrower receives a loan of $95m might require collateral worth $100m, implying a haircut of 5%.3 Repos constitute an important funding source for dealer banks. They use repos to finance securities held on their balance sheets (as market-making inventory, ware- housing during the intermediate stages of securitization, or for trading purposes), or to finance repo loans they provided to clients such as hedge funds. In the latter case, 3 An central development in the 1980s that spurred the growth of repo was that repos received an exemption from automatic stay in bankruptcy (Garbade (2006)). This exemption allows the cash lender in a repo to sell the collateral immediately in the event of default by the borrower without having to await the outcome of lengthy bankruptcy proceedings, thereby reducing the counterparty risk exposure of the cash lender. 8
- 10. dealer banks re-hypothecate the collateral they receive from hedge funds to use as col- lateral in their repos with cash lenders. King (2008) estimates that about half of the financial instruments held by dealer banks were financed through repos. In the years before the financial crisis, repos became an important funding source for the shadow banking system. Just like the traditional banking system, the shadow banking system raised short-term funding and directed these short-term funds into relatively illiquid long-term investments, such as corporate securities and loans, as well residential and commercial mortgages, as illustrated in Figure 1. MMFs and securities lenders provided a large part of this short-term funding (Pozsar, Adrian, Ashcraft, and Boesky (2010)). MMFs promise their investors a constant net-asset value (“$1 NAV”), which effec- tively makes their investors’ claims similar to the demand deposits of the traditional banking system (but without deposit insurance). Some of the funding provided by MMF went into securitized products through vehicles that issued asset-backed com- mercial paper (ABCP), but a significant part also went via repo to financial institutions that held securitized products and other securities on their balance sheets. Securities lenders are another cash-rich party that directed funds to the shadow banking system. These institutions, as part of being custodians for a large amount of bonds and equity, lend out these securities to investors who wish to establish short positions in bond or stock markets. The shorting investor will typically leave cash with the security lender equal (or greater) than the value of the securities borrowed from the security lender. As a result, security lenders come into possession of a large amount of cash that they seek to reinvest in the money markets. A significant share of this cash went into repos and ABCP. 9
- 11. 2345# 2345# $%&'()%*+# ;%6<.%= ,-.)%&/0# !!"# >.)-.%# 10./*# ,6--)*.%)-# ,6--)*.%)-# 76%*8 76%*8 29::5# 29::5# Figure 2: Tri-Party Repurchase Agreements The repo that we examine in this paper are know as tri-party repos.4 In a tri-party repo, a clearing bank stands as an agent between the borrower and the cash lender, as illustrated in Figure 2. In the U.S., this role is performed either by JPMorgan Chase or Bank of New York Mellon. The clearing bank ensures that the repo is properly collateralized within the terms that cash lender and borrower agreed to in the repo (haircut, marking-to-market, and type of securities). The motivation for this tri-party arrangement is to enable cash lenders like MMFs that may not have the capability to handle collateral flows and assess collateral valuations to participate in this market without running the risk of the counterparty might not provide the required collateral.5 The risks for a cash lender in a repo are principally that the borrower defaults and the lender does not have sufficient collateral to recover the lent amount. For MMFs, there is an additional concern that if the borrower defaults and the collateral 4 The other type of repo is known as a bilateral repo. A bilateral repo is typically done between a dealer bank and a hedge fund, while the tri-party repo is done between dealer banks and MMFs. These two contracts will have different terms in practice (repo rates and haircuts). For example, a typical hedge fund is less credit-worthy than a dealer bank so that the bilateral repos carry higher haircuts. Our interest in this paper centers on understanding the funding flows that enter the shadow banking system, and hence the tri-party repo market is the relevant market, as it constitutes one of the main interfaces between shadow banks and short-term cash lenders. For other questions, e.g., the network of counterparty exposures among dealer banks, the bilateral repo market is important. 5 Garbade (2006) discusses incidents prior to the development of the tri-party repo market in which borrowers had failed to properly collateralize loans. 10
- 12. is illiquid, the MMF will be stuck with the collateral for an extended period. SEC rules place limits on the amount of illiquid/long-term securities that that an MMF can hold. Finally, there is repo risk that is unique to the tri-party market that stems from the so-called daily “unwind.” Irrespective of the term of the repo, the clearing bank unwinds the repo every morning by depositing cash in the cash-lenders’ deposit account with the custodian and by extending an intraday overdraft and returning the collateral to the borrower for use in deliveries during the day. If the term of the repo has not expired, or if the lender and borrower agree, bilaterally, to renew the repo, a “rewind” takes place at the end of the business day, whereby securities are transferred from the borrower’s to the lender’s security accounts with the clearing bank, and cash is transferred from the cash lender’s to the borrower’s deposit accounts. Thus, the cash lender is a secured lender overnight, with the securities underlying the repo serving as collateral, but during the day the cash lender becomes an unsecured depositor in the tri-party custodian.6 . Thus, the risks to a cash lender overnight stem from the interaction of counterparty risk of the borrower (a) with risk of collateral value changes and illiquidity of underlying collateral (b). Intraday, the risks to a cash lender stem from the counterparty risk of the clearing bank (c). The lender can protect against (b) by raising the haircut on the repo contract. Reducing the amount of repo lending can be a response to all three risks. The lender can also raise the repo rate to compensate for all three risks, although in practice this appears to be a less significant margin. Finally, during the sample period we study, there was considerable uncertainty about how a default of a repo borrower would play out in the tri-party repo market. 6 The potential systemic risk created by the huge intraday overdrafts extended by the two tri-party custodian banks to broker-dealers have also lead to efforts to change the practices in the tri-party repo market (see Federal Reserve Bank of New York (2010)), but for the sample period we study in this paper, the market functioned in the way we described 11
- 13. According to the Tri-Party Repo Infrastructure Reform Task Force (see Federal Reserve Bank of New York (2010)), it was not clear for the cash investor if, when, and how a repo trade would be unwound and how the collateral liquidation process would be carried out. The ambiguity over these matters may also affect participation in the repo market. B Quantity of Tri-Party Repo Funding Mutual funds file a portfolio holdings report every quarter on forms N-CSR, N-CSRS, and N-Q with the Securities and Exchange Commission (SEC). This filing requirements also extends to MMFs. The typical report of an MMF lists their holdings of certificates of deposits, commercial paper, and repurchase agreements. For repos, the reports list each repurchase agreement with the notional amount, repo rate, initiation date, repur- chase date, counterparty, the type of collateral, and, in most cases, the value of the collateral at the report date. The level of detail about the underlying collateral varies between funds. Some report fairly detailed categories, while others only report broad classes, such as “U.S. Treasury Bonds”, “Government Agency Obligations”, or “Corpo- rate Bonds”, often with a maturity range. Typically a portfolio of securities serves as collateral, but only rarely are the value-weights of different classes of securities in the portfolio reported. In most cases, though, the collateral portfolio consists of securities of the same type (e.g., U.S. Treasury bonds of different maturities and vintages, rather than Treasury bonds mixed with corporate bonds or asset-backed securities). We collect the quarterly filings from the SEC website with filing dates between Jan- uary 2007 and June 2010. We parse the filings electronically and extract the repurchase agreement information. Our aim is to collect the data for the 20 biggest fund money market fund families, identified from a ranking of money market fund families at the 12
- 14. end of 2006 obtained from Cranedata. As of this writing, we have compiled data for 10 of these 20 families (see Appendix A). As the market for money market funds is fairly concentrated, with the biggest 10 fund families accounting for more than 60% of total net assets, data for the biggest 20 fund families should give us a fairly complete picture of the repo market between MMF and broker-dealers. In all of the computations below, we extrapolate the MMF data we have collected to the entire MMF sector. While we refer to the funds in our sample in general as MMFs, some funds in the sample are enhanced cash funds that are, strictly speaking, not money market funds, as they do not adhere to the investment restrictions for money market funds in SEC rule 2a-7 and particularly do not aim for $1 NAV. To analyze securities lenders, the second main class of providers of short-term fund- ing to shadow banks, we obtain data from the Risk Management Association (RMA). The RMA conducts a quarterly survey of major securities lenders and reports statis- tics on their aggregate portfolio of cash collateral reinvestments, including direct in- vestments as well as repo agreements. Appendix B provides more detail on the data, including a list of survey participants quarter-by-quarter. The RMA data combine repo with non-Agency ABS/MBS and corporate debt into one category. We impute the split between non-Agency ABS/MBS and corporate debt based on the assumption that their relative proportion is the same as the corresponding proportion in MMF repos. The first column in Table I reports the aggregate amount of repos undertaken by MMF in our sample (given the data we have collected so far). In 2006Q4 we have only partial coverage because we miss 2006Q4 reports filed before January 2007. For comparison, the second column shows the aggregate amount of MMF repo outstanding according to the flow of funds accounts (FoF), and the third column shows the total 13
- 15. Table I: Summary of Money Market Funds and Securities Lenders Repo Data Money Market Funds Securities Lenders Primary Collected Total Total Cash Dealer Quarter Repo Repo 2 Assets2 Repo Collateral Repo3 2006Q41 144 395 2312 431 1594 3442 2007Q1 210 387 2372 527 1834 3619 2007Q2 213 426 2466 504 1902 3889 2007Q3 274 528 2780 522 1754 3886 2007Q4 298 606 3033 478 1712 4106 2008Q1 323 592 3383 467 1537 4278 2008Q2 281 518 3318 509 1790 4222 2008Q3 273 592 3355 490 1519 3989 2008Q4 287 542 3757 228 954 3208 2009Q1 375 562 3739 212 779 2743 2009Q2 345 488 3585 257 882 2582 2009Q3 334 495 3363 244 865 2499 2009Q4 351 480 3259 229 850 2469 2010Q1 308 440 2931 263 837 2477 1 Incomplete coverage of funds in MMF sample in 2006Q4. 2 Source: Flow of Funds Accounts. 3 Source: Federal Reseve Bank of New York amount of MMF assets, also from the FoF. Currently, our data set covers roughly 60-70% of oustanding MMF repo. Repos account for about 15-20% of total MMF assets. Column four reports the total amount of repo oustanding in securities lenders’ cash collateral reinvestment portfolios. Until 2008Q2, this number is of comparable magni- tude as the total amount of MMF repo, but it contracts more strongly in subsequent quarters. This is likely driven by the fact that securities lenders’ total cash collateral available for reinvestment contracted sharply around the peak of the crisis. The final column shows the end-of-quarter amount of total Primary Dealer repos outstanding, as reported by the Federal Reserve Bank of New York. A comparison of these numbers with the total amount of MMF repo in the second column shows an 14
- 16. interesting and stark contrast. While the amount of Primary Dealer repo outstanding contracted by 40% between 2008Q2 and 2009Q2, the amount of MMF repo did not shrink appreciably until 2009Q1. One factor driving the total size of MMF repo seems to be the flows in and out of MMF. MMF assets increased by about 50% from 2007Q1 to 2009Q2. Only when MMF assets started to shrink in 2009Q2 did the amount of MMF repo start to shrink substantially as well. A second possible explanation for this discrepancy has to do with the extent of rehypothecation which we have described before. If dealers netted their repos over this period, perhaps to reduce network ex- posures to vulnerable dealers, then the primary dealer data will show a drop in repo outstanding. Anecdotal evidence suggests that that this latter effect may have been significant in the crisis. To what extent does our MMF and securities lender data capture the total amount of repo funding provided to the shadow banking system? According to data from Bank of New York Mellon and J.P. Morgan, the total amount of tri-party repo was roughly $2.5 trillion at the end of 2007 (Federal Reserve Bank of New York (2010)), which compares with about $1.1 trillion of MMF and securities lender repo in our data. However, the Bank of New York Mellon and J.P. Morgan numbers also include GCF repo, which is a form of inter-dealer repo (see Copeland, Martin, and Walker (2010)). The Flow of Funds Accounts (December 2010 release) suggest that the major cash lenders in the repo market apart from MMF and securities lenders at the end of 2007 include state and local governments with ($163.3bn), government sponsored enterprises ($142.7bn) and rest of the world ($338.4bn). These numbers suggest that our MMF and security lender data captures about two thirds of the repo funding provided to the shadow banking system. 15
- 17. C Collateral used in Tri-Party Repo Funding Figure 3 presents the share (by notional value) accounted for by different collateral categories, reported for each quarter. The “Agency” category includes both Agency bonds and Agency-backed MBS (many funds lump these together when reporting col- lateral, so we cannot distinguish them in most cases). The “Priv. ABS” category includes private-label MBS and ABS. The “Corporate” category refers to corporate debt, and the “Other” category is composed mainly of equities, whole loan repos, and some commercial paper, certificates of deposit, and municipal debt. In general, Treasury and Agency securities account for the majority of collateral in MMF repos. Private-label MBS/ABS make up around 10% of MMF repo collateral prior to the crisis, which corresponds to about $60 billion in terms of value. Private- label ABS/MBS disappears as collateral from MMF as the financial crisis reached its peak in 2008. Corporate debt also disappears almost entirely. Thus, riskier and less liquid collateral were not used for financing in the tri-party repo market. This reflects the “run on repo” that many have commented on. For the security lenders, non-Agency ABS/MBS and corporate debt make up a much larger fraction of the portfolio, while Treasuries make up only a small portion. However, we observe the same pattern of a reduction in the share of riskier and less liquid collateral during the crisis. The disappearance of private credit instruments as collateral is less extreme, though, than for MMF. 16
- 18. 1 .8 .6 Share .4 2007q1 2008q1 2009q1 2010q1 Quarter U.S. Treasury Agency Priv. ABS Corporate Other 1 .8 .6 Share .4 .2 0 2007q1 2008q1 2009q1 2010q1 Quarter U.S. Treasury Agency Priv. ABS Corporate Other Figure 3: Share of Collateral Types for Money Market Fund Repo (top) and Securities Lender Repo (bottom). The RMA data for securities lenders combines corporate and private-label ABS collateral. The split shown in this figure is imputed based on the assumption that the relative proportion of corporate and private-label ABS collateral is the same as for MMF. 17
- 19. III Short-term Funding of Private Credit Instru- ments This section documents the sources of funding of private credit instruments to evaluate the relative importance of different funding sources. We particularly focus on the importance of ABCP vis-a-vis repo to fund non-Agency MBS and ABS. A Short-term funding at the Onset of the Financial Crisis The first row of Table II presents data on the total outstanding U.S. non-Agency MBS/ABS in 2007Q2. The $5.275tn outstanding is the heart of what is commonly re- ferred to as the shadow-banking sector; i.e., residential mortgages and other loans that are held in securitization pools or in SPVs. The main sub-categories in the $5.275tn are roughly $3 trillion non-Agency RMBS and CMBS (data from the Securities Industry and Financial Market Association), which include about $1.4 trillion subprime RMBS outstanding at the onset of the crisis (Greenlaw, Hatzius, Kashyap, and Shin (2008)). We also provide data on the outstanding corporate bonds as some of these securities (e.g., bonds used to finance LBOs, senior bank loans) also comprise the shadow bank- ing sector. The outstanding amount of corporate debt, excluding commercial paper, was $5.591 trillion in 2007Q2. The table also details the amount of these securities financed by repo. Total repo of non-Agency MBS/ABS is $171bn. Even if we include the repo extended against corporate bonds, the repo total is only $386bn. This is a small fraction of the out- standing assets of shadow banks. This observation underscores a principal finding of this study: repo was of far less importance in funding the shadow-banking sector than is commonly assumed. 18
- 20. Table II: Funding of Outstanding U.S. Non-Agency MBS/ABS and Corporate Bonds in 2007Q2 Non-Agency MBS/ABS Corporate Bonds Amount % Amount % Total outstanding1 5275 100% 5591 100% Short-term funding ABCP2 1173 22% Direct holdings3 MMF 243 5% 179 3% Securities lenders 502 10% 369 7% Repo4 MMF 44 1% 56 1% Securities lenders 127 2% 159 3% Total short-term 2089 40% 763 14% 1 Souce: SIFMA for MBS/ABS, where ABS is ex CDOs (assuming CDOs are largely repackaged ABS); Flow of Funds for corporate bonds, ex bonds issued by foreigners and ABS issuers. 2 Source: Federal Reserve Board. 3 Source: Risk management Association (RMA) for securities lenders, and Flow of Funds for total direct holdings by MMF of corporate bonds including ABS. The direct holdings estimate for MMF is based on the assumption that the ratio of non-Agency MBS/ABS holdings to corporate bonds is the same for MMF as the observed one for securities lenders. 4 RMA (securities lenders) and SEC filings (MMF). The MMF repo numbers from our SEC filings data are scaled up to match the total amount of MMF repo according to the Flow of Funds. The RMA data combines repos with corporate and non-Agency MBS/ABS collateral. The repo estimate for securities lenders is based on the assumption that the share of repos with non-Agency MBS/ABS to repos with corporate debt securities collateral is the same for securities lenders as the observed one for MMF. 19
- 21. If repo was not the principal source of funding, what was? The table details the direct holdings of these securities by MMFs and security lenders. The direct holdings are substantial, totaling $745bn. It is likely that such holdings are high grade and short maturity tranches of securitization deals. The largest source of funding is ABCP of $1173 bn. Acharya, Schnabl, and Suarez (2010) note that the assets in the SPVs financed by ABCP are a 50-50 mix of ABS and other loans (receivables or whole bank loans). Nevertheless, as they point out, one can think of ABCP as part of a securiti- zation chain where commercial paper is issued against loans and other securities. The comparison between ABCP and repo shows that ABCP was probably more important as a stress-point for the shadow banking system. B Contraction in short-term funding during the financial cri- sis Table III documents the contraction in funding of the shadow banking sector between 2007Q2 and 2009Q1. Total repo for non-Agency MBS/ABS goes to zero. However, as we have noted the quantity of contraction is modest since repo was a relatively small source of funding. The contraction in repo funding accounts only for less than 15% of the total short-term funding contraction of roughly $1.4 trillion. A striking fact is that repo with non-Agency MBS/ABS collateral completely dis- appears. Thus, even though the total contraction is small, it seems possible that institutions that were entirely reliant on repo were particularly affected by the reduc- tion in repo. We return to this point later in the paper. For example, this observation may square with accounts of the failures of Bear Stearns and Lehman Brothers (see Duffie (2010)). 20
- 22. For the entire shadow bank sector though, the more important contraction was in ABCP, which falls by $662bn. Direct holdings of MBS/ABS by MMFs and security lenders also falls by $568bn. The bottom panel of the table documents the contraction in corporate bonds. The contraction is more modest, and this is likely driven by the fact that the corporate bond category mixes in securities which are not of interest (e.g., Aaa corporate bonds). Figure 4 illustrates the contraction in ABCP and repo graphically, quarter-by- quarter. The figure compares the amount of repo with private-label ABS/MBS collat- eral with the amount of ABCP outstanding (data obtained from the Federal Reserve Board), net of the amount funded through the Federal Reserve’s Commercial Paper Funding Facility (see Adrian, Kimbrough, and Marchoni (2010)). The contraction in ABCP starts earlier than that of repo and continues steadily through the crisis. The repo contraction occurs in a small window around 2008 Q1, roughly corresponding to the failure Bear Stearns. It is also worth noting that the contraction in repo with non-Agency MBS/ABS starts later than ABCP. Thus, the repo market does not seem to be the place where the initial cracks in the shadow banking system appeared. C Demand or Supply? One thorny issue to sort out from this data is whether or not the contraction in out- standing volumes was driven by supply forces or demand forces. That is, one interpre- tation of this data is that cash-investors including MMFs and security lenders change their portfolios to avoid MBS/ABS repo and ABCP (”repo demand”). But it is also possible that hedge funds and dealer banks (”repo supply”), motivated by the increased risk and uncertainty in asset markets, chose to reduce their holdings of securities and hence no longer needed funding from the repo markets. 21
- 23. Table III: Contraction in Short-term Funding 2007Q2 2009Q1 Contraction Non-Agency MBS/ABS ABCP1 1173.2 511.0 -662.2 Direct holdings MMF3 243.3 59.4 -183.9 Securities lenders2 501.6 116.0 -385.6 Repo MMF 44.3 0.0 -44.3 Securities lenders4 126.5 0.0 -126.5 Total -1402.5 Corporate bonds Direct holdings MMF3 178.9 158.4 -20.5 Securities lenders 368.7 309.1 -59.6 Repo MMF 55.9 9.2 -46.7 Securities lenders4 159.2 50.9 -108.3 Total -235.1 1 Source: Federal Reserve Board. ABCP outstanding less the amount of ABCP financed through the Commercial Paper Funding Facility ($116.8bn in 2009Q1). 2 Part of these holdings is in the form of ABCP, part in direct holdings of long-term ABS (i.e., possible double-counting with ABCP) 3 The direct holdings estimate for MMF is based on the assumption that the ratio of non-Agency MBS/ABS holdings to corporate bonds is the same for MMF as the observed one for securities lenders. 4 Risk management Association (RMA) and SEC filings (MMF). The RMA data combines repos with corporate and non-Agency MBS/ABS collateral. The repo estimate for securities lenders is based on the assumption that the share of repos with non-Agency MBS/ABS to repos with corporate debt securities collateral is the same for securities lenders as the observed one for MMF. 22
- 24. 1500 250 1200 Repo w/ non−agency MBS/ABS 200 ABCP outstanding 900 150 600 100 300 050 2006q3 2007q3 2008q3 2009q3 2010q3 Quarter ABCP outstanding Repo w/ non−agency MBS/ABS Figure 4: Comparison of non-Agency ABS/MBS repo with ABCP outstanding (ex CPFF) The quantity data is suggestive of a demand contraction (we discuss the price data in the next section). First, the outstanding amount of securities in SPVs backing ABCP was essentially fixed over this period. That is, banks sponsored the SPVs, filled them with loans and securities, and issued ABCP and other claims against them, letting them wind down as the loans and securities matured. The banks were not taking an active decision to increase or decrease the loans/securities in the SPV. Thus, at least for ABCP, it is likely that all of the action is driven by demand forces. Since for an MMF or security lender ABCP and repo are close substitutes, it is likely that the desire to not own ABCP is mirrored in a desire to not own repo. Thus, it is likely that the contraction in repo is also driven by demand forces. Second, the fact that repo quantity goes to zero also suggests that demand was at work. While dealer banks and hedge funds reduce their holdings of ABS/MBS over this 23
- 25. period (see He, Khang, and Krishnamurthy (2010)), they did not reduce their holdings to zero. Last, flows into money market funds provide another indication that the contrac- tion was driven by demand-side effects. From September to December 2008, taxable government money market funds received inflows of $489 billion while taxable non- government money market funds experienced outflows of $234 billion (data from the Investment Company Institute). Thus, part of the reduction in repo of non-goverment securities, and the increase in repo with government securities may have been driven by investors’ reallocation between money market funds that invest only in government securities and other money market funds. IV Repo Terms During the Financial Crisis This section presents data on the evolution of the terms of repo contracts, including repo rates, haircuts, and repo maturities. The analysis is based on the MMF repo data. The data we present suggests that “price” of repo borrowing rose over the crisis. In conjunction with the quantity evidence, the results further suggests that a central factor driving repo market dynamics in the crisis was the desire of cash lenders to avoid lending against MBS/ABS collateral. The data on the change of contract terms also suggest that it is a combination of risk-aversion and illiquidity aversion that drives cash lender behavior. A Maturity Compression Figure 5 illustrates the shortening in the maturity structure of repos over the crisis. In general, the majority of repo contracts are overnight. In equal-weighted terms 24
- 26. (a) Equally weighted 200 150 Maturity (business days) 50 100 0 2006q3 2007q3 2008q3 2009q3 2010q3 Quarter 90th 80th 70th 60th (b) Weighted by notional value 250 200 Maturity (business days) 100 50 0 150 2006q3 2007q3 2008q3 2009q3 2010q3 Quarter 99th 98th 95th 90th Figure 5: Percentiles of Repo Maturities 25
- 27. (top panel), the 90th percentile reached close to 200 business days in 2007, but it subsequently shrank to less than two months. In value-weighted terms (bottom panel), the figure shows a similar pattern, but the maturity compression is more concentrated in the tail similar since the overwhelming majority of large repos are overnight. The reduction in maturity is consistent with an increased demand for liquidity from cash- investors, since shorter maturity repo is de-facto more liquid than longer maturity repo. Krishnamurthy (2010) provides evidence of investors’ increased desire for liquidity over the crisis, as reflected in a number of different asset markets. That is, the data in Figure 5 is reflective of a more general phenomena that played out over the crisis. B Haircuts Figure 6 plots the value-weighted average haircuts for different categories of collateral over the sample period. Since MMF file at different month-ends throughout each quarter, we can calculate these averages at a monthly frequency. The line for private- label MBS and ABS has a gap from late 2008 to late 2009, as this type of collateral completely disappeared during this period (see Figure 3). It is apparent that haircuts for non-Treasury and non-Agency collateral increased substantially from 2007 to 2010, for example from around 3-4% to about 5-7% for corporate debt and private-label MBS and ABS. The similarity of haircut time patterns for private-label ABS and for corporate bonds also suggest that the problem was more generalized and not something specific to mortgage assets. All of these patterns are suggestive of cash-investors desire to avoid risk/illiquidity in their repo loans. An important observation from this data is that the patterns in haircuts that we observe in the tri-party repo market appear different from the bilateral repo haircuts reported in Gorton and Metrick (2011b). First, while in their data average haircuts 26
- 28. are frequently zero in 2007 for corporate debt and securitized products, the repos undertaken by MMF in our data always have average haircuts of at least 2%, even for Treasuries and Agency debt. Second, although our value-weighted averages (which is the most relevant measure of aggregate funding conditions) are difficult to compare with the equal-weighted averages in finer categories reported in Gorton and Metrick (2011b), an informal comparison suggests that haircuts in tri-party repos of MMF increased much less than the haircuts in their bilateral repo data (Gorton and Metrick report average haircuts in excess of 50% for several categories of corporate debt and securitized products). Taken together with our findings of the relatively small amounts of MMF repos against private-label MBS and ABS collateral, these observations suggest that the “run on repo” may have had a more modest effect on aggregate funding conditions for the shadow banking system than what one may guess from the enormous increase in haircuts for securitized products in the bilateral repo market as reported by Gorton and Metrick (2011b). Finally, there are some surprising patterns in this data. First, the increase in haircuts does not revert following the peak of the financial crisis in 2008. Haircut levels in 2010 are still as high, or even higher than at the end of 2008. Second, even though there was a pronounced shift away from Agency collateral towards Treasuries (in terms of the relative shares shown in Figure 3) before Fannie Mae and Freddie Mac were placed in conservatorship in 2008Q3, average haircuts for Agency collateral remained the same as those for Treasury obligations. 27
- 29. 7 6 5 Percent 43 2 2006m7 2007m7 2008m7 2009m7 2010m7 Month U.S. Treasury Agency Priv. ABS Corporate Figure 6: Haircuts by Collateral Type (weighted by notional value) C Repo Rates Figure 7 presents time-series of value-weighted average overnight repo rates (weighted by notional amounts). As a benchmark for comparison, we use the Federal Funds rate as a default-free rate proxy.7 As shown in Panel (a) of Figure 7, the average overnight repo rate for Treasury collateral typically tracks the fed funds rate quite closely, but there are some striking deviations. Starting in 2007, the repo rate on Treasuries drops below the fed funds rate. This wedge reaches a maximum of almost 100bps in 2008Q1. It is apparent that Trea- suries as a class represented preferred collateral, and as Treasury collateral was scarce, the repo rates on this collateral fell substantially below other risk-free benchmarks. 7 The fed funds rate is an overnight rate and as such almost free of default risk. 28
- 30. (a) Average Overnight Treasury Repo Rate and Fed Funds Rate 6 4 Percent 2 0 2006m7 2007m7 2008m7 2009m7 2010m7 Month Fed Funds Rate Treasury Repo Rate (vw.) (b) Average Overnight Repo Rate in Excess of Overnight Treasury Repo Rate 6 4 Percent 2 0 2006m7 2007m7 2008m7 2009m7 2010m7 Month Agency Priv. ABS Corporate Figure 7: Average Repo Rates (weighted by notional value) 29
- 31. Note that the repo rate here is the general collateral repo rate and not the “special” collateral repo rate as discussed in Duffie (1996). Indeed, this evidence is more con- sistent Krishnamurthy and Vissing-Jorgensen (2010) who argue that Treasuries as a class, command a collateral/liquidity premium. Fleming, Hrung, and Keane (2009) investigate the low Treasury repo rate phenomenon in detail and show that the im- plementation of the Term Securities Lending Facility (TSLF) in March 2008, in which the Federal Reserve lent Treasury securities against non-Treasury collateral, helped to reduce the repo premium on Treasuries. There is substantial variation in the repo rate by category of collateral, as evidenced in Panel (b) of Figure 7. The spread between Treasury repo rates and the repo rate for Agency debt, corporate debt, and private-label MBS/ABS increased from close to zero in 2007 to roughly 200bps in 2008Q1. The higher rates are consistent with cash investors desire to avoid lending against risky/illiquid collateral and scarcity of Treasury collateral. The spread drops after the introduction of the TSLF in March 2008, but it spikes again in September 2008 following the collapse of Lehman Brothers. Private-label MBS/ABS collateral was absent at that time, but a small volume of repo transactions with corporate debt collateral took place at an average repo rate spread to Treasury collateral of around 600bps. Repo rates for Agency debt increased much less to roughly 100bp. A final observation from this data is that unlike haircuts in Figure 6, these repo rate spreads have reverted to near pre-crisis levels as financial markets normalized in 2009 and 2010. It is puzzling that quantities and haircuts on some asset classes have continued to reflect stress conditions. A possible explanation is that market partici- pants’ assessment of the risks of private debt instruments was permanently changed by the financial crisis. 30
- 32. V Cross-sectional Patterns by Repo Counterparty As the above analysis has shown, the main problem with repo financing during the financial crisis was the difficulty of funding riskier/illiquid private debt instruments such as private-label MBS/ABS and, to a lesser extent, corporate debt securities. However, because repo is small in aggregate, it only played a minor role in financing shadow bank holdings of these private debt securities. While repo was a sideshow in terms of aggregate short-term financing, it may have played a larger role in the troubles of certain dealer banks during the financial crisis. Some dealer banks may have had higher exposures than others to private debt instru- ments, and therefore suffered more from the run on repo with risky/illiquid collateral. Second, some dealer banks may have been perceived as more prone to default than others, which may have led cash lenders to run on repo of these banks, irrespective of the type of collateral offered. To shed light on these possibilities, we examine how the contraction in repo funding with private collateral played out in the cross-section of counterparties, and whether different counterparties faced different repo terms (hair- cuts, repo rates) around the peak of the financial crisis. Since we only have cross- sectional data by counterparty for MMF repos, but not for securities lender repos, a caveat is that the following analysis only captures a partial picture of the total repo funding of dealer banks from cash lenders. A Changes in Repo Quantities by Counterparty Banks that were most reliant on repo funding for private collateral in the pre-crisis period should be expected to have been more affected by the crisis. In particular, we focus on banks’ reliance on private collateral repo funding just prior to the rescue 31
- 33. of Bear Stearns in March 2008. Since each MMF files holdings reports only every three months, it only makes sense to consider repo funding amounts per counterparty summed over three month windows.8 Thus, for each counterparty, we calculate the pre-Bear Stearns (BSC) amounts of repo with different collateral types by summing MMF repos over the three months from December 2007 to February 2008. The latter date is when repo funding with private collateral starts to contract (see Figure 4). Figure 8 shows how repo funding contracted or expanded for each repo counterparty in our data from the pre-BSC period to the post-Lehman (LEH) period, where the change is expressed as a fraction of each counterparty’s total repo funding from MMF in the pre-BSC period. Bear Stearns and Lehman are not included in this plot, as we cannot compute their post-LEH repo funding, but further below we will show data on their private collateral shares in the pre-BSC period. The top panel plots the change in total Repo funding against the pre-BSC private collateral share. The figure shows that there was substantial heterogeneity in reliance on private debt instruments as repo collateral. Mizhuo (MFG), Royal Bank of Scotland/Greenwich (RBS), and Barclays (BCS) have private collateral shares of close to zero, while Merrill Lynch (ML), Morgan Stanley (MS), Goldman Sachs (GS), and Citigroup (C) have private collateral shares of almost 50%. The change in total repo funding from the pre-BSC to the post-LEH period is negatively correlated with the private collateral share in the pre-BSC period. Total repo funding expanded for most counterparties, but it contracted for many of those that had relatively high private collateral shares before the financial crisis reached its peak. The next two panels break the change in total repo funding into the change in repo funding with Treasury and Agency collateral (middle) and the change in repo 8 Otherwise one would run into the problem that a counterparty might finance Treasuries with one MMF that files the holdings, say, at the end of February and private-label MBS with a different MMF that files holdings at the end of January. Looking at the repo funding amounts in February would yield a misleading picture in this case. 32
- 34. Total Repo Change Pre−BSC to Post−LEH 1.5 bcs jpm bnpqy bac 1 mfg .5 hbc drb ms rbs 0 db cs −.5 ubs mer gs c 0 .1 .2 .3 .4 .5 Private Collateral Share Pre−BSC Repo w/ Treasury/Agency Collateral Change Pre−BSC to Post−LEH 1.5 bcs jpm bac 1 bnpqy mfg hbc drb .5 ms rbs db cs 0 mer ubs gs c −.5 0 .1 .2 .3 .4 .5 Private Collateral Share Pre−BSC Contraction Pre−BSC to Post−LEH Repo w/ Private Collateral .5 1 1.5 bnpqy mfg bcs 0 rbs db hbc drb cs jpm ubs bac ms cmer −.5 gs 0 .1 .2 .3 .4 .5 Private Collateral Share Pre−BSC Figure 8: Contraction/Expansion in MMF Repo from Pre-Bear Stearns (Dec. 07 to Feb. 08) to Post-Lehman (Sep. 08 to Nov. 08). Change expressed as Share of Total MMF Repo in Pre-Bear Stearns (Dec. 07 to Feb. 08). 33
- 35. 1000 ms 5−yr Senior CDS Rate Post−LEH (9/30/2008) 800 bsc leh 600 gs 400 mer hbc rbs c ubs bcs 200 db jpm cs bac drb bnpqy 0 0 .1 .2 .3 .4 .5 Private Collateral Share Pre−BSC Figure 9: CDS Rates on September 30, 2008 and Private Collateral Share in MMF Repo during the Three Months Prior to Bear Stearns Rescue (December 2007 to February 2008). Bear Stearns and Lehman Brothers CDS rates in this plot are the maximum CDS rates prior to rescue/failure. The regression line has a slope of 835.0322 with t-statistic 2.23. funding with private collateral (bottom). They show that the change in total repo funding has two drivers: (a) repo funding with Treasury and Agency collateral expands for most counterparties, except those with high pre-BSC private collateral shares; (b) repo with private collateral disappears almost completely for all counterparties (which leads to a regression slope of approximately -1.0 in the bottom panel). Figure 9 shows that the counterparties with highest private collateral shares in the pre-BSC period are also more likely to be among those that had the highest perceived default risk around the peak of the financial crisis, as measured by the 5-year CDS rate on senior debt on September 30, 2008. To illustrate where Lehman and Bear Stearns were in terms of their private collateral share, the plot also includes these two counterparties with their CDS rate set to the maximum value attained at any time 34
- 36. prior to the rescue or bankruptcy. Even though those counterparties with the highest pre-BSC private collateral shares were perceived as most at risk to default at the end of September 2008, Figure 8 shows that these counterparties did not generally reduce the amount of repo with Treasury and Agency collateral. Morgan Stanley, the counterparty with the highest perceived default risk at the end of September 2008 and the highest private collateral share in the pre-BSC period, even increased its amount of repo funding with Treasury and Agency collateral substantially. While these findings are subject to the caveat that we only observe MMF repos, and not repos with securities lenders and other cash providers, they are suggestive that repo funding with high-quality collateral remained available even for dealer banks with high perceived default risk. Some accounts of the failure of Bear Stearns and Lehman suggest that these banks did indeed experience difficulty in rolling over repo on all forms of collateral, but only in the last days before failure. This is not captured in our low-frequency MMF repo data. Copeland, Martin, and Walker (2010) present daily data on Lehman’s tri-party repo book in September 2008 and document that the total amount of repo funding started to contract substantially only a few days prior to Lehman’s bankruptcy filing, and the contraction affected all collateral categories, including Treasury collateral. B Repo Terms by Counterparty on September 30, 2008 Funding difficulties of dealer banks with high perceived default risk, even if not apparent in repo quantities, could also manifest themselves as a worsening of the price-terms of repo agreements. For this reason, we also examine cross-sectional variation in haircuts and repo rates of different counterparties and find that most of the variation is due to the type of collateral rather than the credit risk of counterparties. This finding further 35
- 37. reinforces our conclusion that the patterns of increasing haircuts underlying Figure 6 are driven by characteristics of collateral and not the worsening of the credit risk of repo borrowers. We again focus our analysis on the end of September 2008, the time when dealer banks faced the most adverse funding conditions. For the purpose of this analysis, we refine our categorization of collateral to deal with some ambiguity in classification of collateral as Treasury or Agency collateral. We create an additional mixed Treasury/Agency category for cases in which we cannot cleanly classify the collateral as Treasury or Agency securities. This includes cases, for example, in which the collateral is a portfolio of Treasury and Agency securities. In these cases, we had so far assigned the collateral type that has the highest number of counts in the list of securities comprising the collateral portfolio. But this means that some variation in repo rates within a category could be driven by collateral portfolio composition rather than the characteristics of the repo counterparty. This ambiguity is not significant when Agency and Treasury collateral commands very similar terms in repos, but on September 30, 2008 it matters. We further put all non-Treasury, non- Agency collateral into a private collateral group. On September 30, 2008, this group includes almost exclusively corporate bonds or corporate equities. The top graph in Figure 10 plots the (value-weighted) average haircuts of each counterparty, against the CDS rate for 5-year senior debt on September 30, 2008. It is apparent from these figures that average haircuts vary by collateral type, but within collateral categories, they are virtually identical for different counterparties, irrespective of the CDS rate. The bottom graph plots the (value-weighted) repo rate against the CDS rate. While there is some variation in repo rates within collateral categories, this variation is not correlated with the CDS rate of the counterparty. 36
- 38. Haircuts 5 4 Haircut 3 2 0 200 400 600 800 1000 5−yr Senior CDS Rate 9/30/2008 Treasury Treasury/Agency Agency Private Repo Rates 8 6 Repo Rate 4 2 0 0 200 400 600 800 1000 5−yr Senior CDS Rate 9/30/2008 Treasury Treasury/Agency Agency Private Figure 10: Overnight Repo Rates and Haircuts on September 30, 2008. Value-weighted averages per counterparty 37
- 39. VI Federal Reserve Programs In the period beginning Q2 2008, the Fed initiated a series of funding programs intended to offset the reduction in private sector funding of the shadow banking sector. This section presents data to shed light on the extent to which these program did in fact offset the private contraction. We also compare the terms of the Fed facilities versus market terms. The latter comparison is interesting because it speaks to the extent of subsidy that the Fed offered through its programs. A Quantity of Fed Funding We focus on four principal programs: 1. PDCF (Primary Dealer Credit Facility), March 2008: Loan facility that provided funding to primary dealers in exchange for any tri-party-eligible collateral. Loans were overnight, and made at the primary credit discount rate. 2. TSLF (Term Securities Lending Facility), March 2008: Facility to loan Treasuries from the Fed’s portfolio in exchange for any tri-party-eligible collateral. Loans were 28-day, and rates were set in an auction. 3. Maiden Lane, 3 facilities, various dates: Fed made loans to SPVs that held non- Agency ABS. Facilities were set up in conjunction with interventions in Bear Stearns and AIG. 4. CPFF (Commercial Paper Funding Facility), October 2008: Fed made loans to an SPV to purchase 3-month ABCP. Figures 11 aggregates the non-Agency MBS/ABS repos of security lenders and MMFs along with the funding on these securities that came from the Fed through 38
- 40. 250 200 Amount ($bn.) 100 50 0 150 2006q3 2007q3 2008q3 2009q3 2010q3 Quarter Repo Maiden Lane TSLF PDCF Figure 11: Repo and Federal Reserve (TSLF and PDCF) funding of non-Agency MBS/ABS PDCF, TSLF, and Maiden Lane.9 The figure shows that Fed program offset a consid- erable portion of the contraction in repo funding starting in 2008Q1. As a result, total funding smoothly decreases during the subsequent quarters. Figure 12 presents the same data for corporate bond repos. The Fed programs were used much less in this case. But, the private sector funding contraction is also not as severe. Figure 13 presents the data for ABCP. Again, the private sector funding contraction was not as dramatic and the CPFF was not as used. We should also add that a significant portion of the assets from the ABCP funded SPVs were taken back onto commercial bank balance sheets. Commercial banks had access to alternative funding sources including FDIC insured bank deposits and FDIC insured bond issues (see He, Khang, and Krishnamurthy (2010)). With such alternatives it may be that the CPFF 9 Security lender repo split between corporate debt securities and non-Agency MBS/ABS calculated under the assumption that the split (in terms of percentage) is the same as for MMF repos. 39
- 41. 300 250 100 150 200 Amount ($bn.) 50 2006q3 2007q3 2008q3 2009q3 2010q3 Quarter Repo TSLF PDCF Figure 12: Repo and Federal Reserve (TSLF and PDCF) funding of corporate debt securities 1200 1000 800 Amount ($bn.) 400 600 2006q3 2007q3 2008q3 2009q3 2010q3 Date ABCP ex CPFF ABCP in CPFF Figure 13: ABCP oustanding (ex CPFF) and Federal Reserve (CPFF) funding 40
- 42. was not as needed as the facility directed to dealer banks. B Fed Program Participation, by Dealer Bank Where did the dealers with high pre-BSC private collateral shares turn for financing? Column (2) in in Table IV shows that part of the answer is that the Fed provided the funding through the TSLF. In schedule 2 TSLF auctions, dealer banks could bid with investment-grade securities as collateral to obtain Treasury securities on loan against a fee. The dependent variable in column (2) measures the extent to which a dealer bank utilized the maximum amount that it was allowed to borrow under schedule 2 in the two schedule 2 auctions, just before and after 9/30/08 (9/25/08 and 10/1/08). For each auction, we take the ratio of the loan amount awarded to a dealer bank to the maximum possible award, and we average this ratio across the two auctions. As the regression results show, dealer banks with a high private collateral share prior to the Bear Stearns rescue (pre-BSC, December 2007 to February 2008) tend to max out their borrowing capacity under schedule 2. As the regression in column (1) shows, they do not do so for schedule 1 auctions, presumably because they do not have enough qualifying Treasury and Agency collateral to begin with. The regressions in columns (1) and (2) also show that dealer banks with a high Agency collateral repo share in the pre-BSC period tended to max out their borrowing capacity under both schedules in the TSLF. Moreover, column (3) shows that the total amount of borrowing under the TSLF on 9/30/08 is positively related to both Agency and private collateral shares in the pre-BSC period. Thus, only dealer banks with high pre-BSC Treasury collateral shares did not resort much to the TSLF (which is sensible, as the purpose of the TSLF was to exchange non-Treasury collateral against Treasuries). 41
- 43. Table IV: Fed Program Utilization by Primary Dealers in September 2008 For each dealer bank, we have two explanatory variables: Agency share pre-BSC is the proportion of MMF repos with Agency collateral in the three-month period prior to the rescue of Bear Stearns (December 2007 to February 2008). Private share pre-BSC is the share of corporate debt, non- Agency MBS/ABS, and other non-Treasury, non-Agency collateral in the pre-BSC period. Dependent variables are defined as follows: For the TSLF, maxout1 denotes average utilization of maximum available borrowing under TSLF schedule 1 (Treasury and Agency collateral) in the two schedule 1 auctions closest to 9/30/08 (9/18/08 and 10/2/08), maxout2 is defined accordingly as the average utilization in schedule 2 auctions (9/25/08 and 10/1/08), while Total refers to the total notional amount of Treasury securities borrowed from the TSLF (in $bn) on 9/30/08. PDCF Total is the total amount borrowed from the PDCF (in $bn) on 9/30/08. We report t-statistics in parentheses. TSLF PDCF maxout1 maxout2 Total Total (1) (2) (3) (4) Agency Share pre-BSC 1.56 0.69 43.84 2.66 (3.31) (1.80) (2.95) (0.23) Private Share pre-BSC -0.12 0.87 32.16 45.54 (-0.26) (2.29) (2.21) (4.00) Observations 15 15 15 15 Adjusted R2 0.394 0.375 0.510 0.516 42
- 44. C Fed Program Subsidy The attractiveness of the TSLF is apparent from comparing the loan fees determined in the auctions to the terms in the private market, as measured in the MMF data. For example, the schedule 2 auction on 10/1/08 yielded a (uniform) loan fee of 1.51%. As the TSLF exchanges non-Treasury collateral against Treasuries, the relevant compar- ison here is the spread between Treasury repo rates and repo rates for non-Treasury collateral. Figure 10 shows that the spread for private collateral on 9/30/08 was ap- proximately 7%.10 Thus, the TSLF rate of 1.51% is clearly subsidized relative to market conditions at the time. For Agency collateral, the comparison between the schedule 2 auction and the private market rates is less clear-cut. The spread of Agency repo rates to Treasury repo rates in Figure 10 is often below 1.51%. However, there is a more clear-cut distinction when comparing the schedule 1 auction, which accepted Agency but not private collateral, to the private repo market. The schedule 1 auction on 10/1/08 yielded a (uniform) loan fee of 0.42%, which is lower than most of the Agency repo spreads in Figure 10. Finally, note that the fact that dealer banks with high shares of Agency collateral in 2008Q1 also turned to TSLF funding indicates that borrowing from the TSLF was not perceived to carry stigma. Some dealers with a high pre-BSC private collateral share maxed out their funding under TSLF. Where did they fund there excess private collateral? As we know from Figure 8, they did not obtain further repo funding from MMF with this type of col- lateral. Column (4) of Table 10 provides the answer: They turned to the PDCF. The amount borrowed from the PDCF is strongly positively correlated with the pre-BSC private collateral share. Unlike the TSLF, dealer banks with high Agency collateral 10 Private collateral on this date included a substantial amount of corporate equities, which was not eligible as TSLF collateral. However, the average repo rates for corporate debt and corporate equities were virtually identical on this date. 43
- 45. shares however avoided the PDCF even though funding rates were attractive for pri- vate collateral (2.25% on 9/30/08), and all collateral eligible for tri-party repo funding was also eligible for borrowing under the PDCF. This is consistent with the view that borrowing from the PDCF was viewed as carrying a stigma similar to the stigma associ- ated with discount-window borrowing from the Fed (on which the PDCF was modeled). Borrowing from the PDCF seems to be viewed as a last resort that dealer banks try to avoid at possibly high cost. For example, Lehman Brothers did not access the PDCF prior to its bankruptcy filing (Valukas (2010)). D Summary Overall, these findings reiterate that the problem of repo was one of funding private collateral. Any heterogeneity in funding conditions among dealer banks was driven by the type of collateral held by the banks. The dealers with high private collateral shares found themselves in difficulty not because of a run on a counterparty per se, but because getting repo financing with private collateral became expensive. To avoid high financing costs in the repo market, dealer banks with high private collateral shares turned to the TSLF and PDCF. Dealer banks with low private collateral shares, in contrast, avoided the PDCF, despite the attractively low rates charged in the PDCF relative to market rates at the time. VII Conclusion We examine data on the repo lending by money market funds and security lenders to understand the role of repo in the demise of the shadow banking system, and as a factor in the financial crisis. Money market funds and securities lenders provide 44
- 46. the majority of repo funding to the shadow banking system. During the financial crisis, repo funding with (non-Agency) securitized assets collateral contracted sharply. The data is consistent with the “run on repo” that has been prominently emphasized by Gorton and Metrick (2010, 2011b, 2011a). However, repo accounts for only a small fraction of the short-term funding of securitized assets in the shadow banking system prior to the crisis. This finding does not support the emphasis that Gorton and Metrick (2010, 2011b, 2011a) Adrian and Shin (2010) have placed on the repo market in explaining the collapse of the shadow banking system. Instead, the short-term funding of securitized assets through ABCP and direct investments by money market investors are an order of magnitude larger then repo funding, and the contraction in ABCP is an order of magnitude larger than the run on repo. Troubles in funding securitized assets with repo may have been a major factor in the problems of some dealer banks that were most heavily exposed to these assets, but for the shadow banking system as a whole, the role of the repo market appears small. Overall, our findings are consistent with views of the crisis which emphasize a significant run on short-term debt financing, but raises questions about the specific instruments and channels underlying this run. More research is needed to understand these important details. 45
- 47. References Acharya, Viral, Philipp Schnabl, and Gustavo Suarez, 2010, Securitization Without Risk Transfer, working paper , NYU. Adrian, Tobias, Karin Kimbrough, and Dina Marchoni, 2010, The Federal Reserves Commercial Paper Funding Facility, FRBNY Economic Policy Review , forth- coming. Adrian, Tobias, and Hyun Song Shin, 2010, Liquidity and Leverage, Journal of Financial Intermediation 19, 418–437. Brunnermeier, Markus K., 2009, Deciphering the Liquidity and Credit Crunch 2007- 2008, Journal of Economic Perspectives 23, 77–100. Caballero, Ricardo, and Arvind Krishnamurthy, 2009, Global Imbalances and Fi- nancial Fragility, American Economic Review 99(2), 584–88. Copeland, Adam, Antoine Martin, and Michael Walker, 2010, The Tri-Party Repo Market before the 2010 Reforms, working paper , Federal Reserve Bank of New York. Duffie, Darrell, 1996, Special Repo Rates, Journal of Finance 51(2), 493–526. Duffie, Darrell, 2010. How Big Banks Fail and What to Do about It. Princeton, NJ: Princeton University Press. Duffie, Darrell, and Haoxiang Zhu, 2010, Does a Central Clearing Counterparty Reduce Counterparty Risk?, working paper , Stanford University. Federal Reserve Bank of New York, 2010, Tri-Party Repo Infrastructure Reform. White paper. 46
- 48. Fleming, Michael J., Warren B. Hrung, and Frank M. Keane, 2009, Repo Market Effects of the Term Securities Lending Facility. working paper, Federal Reserve Bank of New York. Garbade, Kenneth D., 2006, The Evolution of Repo Contracting Conventions in the 1980s, FRBNY Policy Review , 27–42. May. Geanakoplos, John, 2009, The Leverage Cycle, in Daron Acemoglu, Kenneth Rogoff, and Michael Woodford, eds.: NBER Macroeconomics Annual. Gorton, Gary, and Andrew Metrick, 2010, Haircuts, Federal Reserve Bank of St. Louis Review 92(6), 507–519. Gorton, Gary, and Andrew Metrick, 2011a, Regulating the Shadow Banking System, Brookings Papers on Economic Activity, forthcoming. Gorton, Gary, and Andrew Metrick, 2011b, Securitized Banking and the Run on Repo, Journal of Financial Economics, forthcoming. Greenlaw, David, Jan Hatzius, Anil K. Kashyap, and Hyun Song Shin, 2008, Lever- aged Losses: Lessons from the Mortgage Market Meltdown, Proceedings of the U.S. Monetary Policy Forum. He, Zhiguo, In Gu Khang, and Arvind Krishnamurthy, 2010, Balance Sheet Adjust- ments during the 2008 Crisis, working paper , Northwestern University. King, Matt, 2008, Are the Brokers Broken? Report, Citigroup European Quantita- tive Credit Strategy and Analysis. Krishnamurthy, Arvind, 2010, How Debt Markets Have Malfunctioned in the Crisis, Journal of Economic Perspectives 24(1), 3–28. Krishnamurthy, Arvind, and Vissing-Jorgensen, 2010, The Aggregate Demand for 47
- 49. Treasury Debt, working paper , Northwestern University. Pozsar, Zoltan, Tobias Adrian, Adam Ashcraft, and Hayley Boesky, 2010, Shadow Banking, working paper . Federal Reserve Bank of New York. Shleifer, Andrei, 2010, Comments on Gorton and Metrick: Regulating the Shadow Banking System, Brookings Papers on Economic Activity, forthcoming. Singh, Manmohan, and James Aitken, 2010, The (sizable) Role of Rehypothecation in the Shadow Banking System, working paper , IMF. Valukas, Anton R., 2010, Report of Anton R. Valukas, Examiner, report, Bankruptcy Court, Southern District of New York, Chapter 11 Case No. 08–13555 (JMP). 48
- 50. Appendix A Money Market Mutual Fund SEC Filings Data Table A.I lists the fund families for which we have collected repo data as of the time of this writing, along with the CIK numbers under which their portfolio holdings reports are filed with the SEC. Often the reports of many or all money market funds of a family are filed under the same CIK number. In other cases (e.g., Dreyfus), the reports are filed under different CIK numbers. The most difficult part of the data collection is the classification of collateral. Typ- ically, the holdings reports provide a brief description of the collateral underlying the repo agreement, such as ”U.S. Treasury Securities”, or a list of specific securities (in terms of maturity, coupon rate, and issuer). In some cases, the portfolio of securities underlying a repo agreement can be a mix of different types of securities. The most common case of mixed collateral involves Treasury securities mixed with Agency bonds or Agency-backed MBS. Non-Agency backed MBS/ABS or corporate bonds are only very rarely mixed with Treasuries and Agency securities. Except in rare cases, the filings do not report the portfolio weights. To approximate the portfolio weights, we count the number of securities in the list of securities in the portfolio, and we assign portfolio weights based on the relative number of times a collateral type is mentioned in this list. For quantity calculations, we split the notional value of a repo agreement with a portfolio of collateral based on these portfolio weights. For calculations involv- ing repo terms by collateral, we assign the collateral type that has the highest number of counts in the list of securities. Some fund families (e.g. Goldman Sachs and Fidelity) have the funds in their family 49
- 51. Table A.I: Sample of Money Market Fund Families Fund family CIK numbers Blackrock 97098 Dreyfus 1171061, 819940, 717341, 871967, 312564, 885409, 831363, 878092, 863471, 814236, 865440, 779128, 885408, 30158, 30160, 846421, 759667, 820482, 740766 Federated 856517, 852495 Fidelity 278001, 35315, 276516, 356173, 704207, 917286 Goldman Sachs 822977 JP Morgan 1217286, 763852 Morgan Stanley 1227155 Reserve 83335 Schwab 857156 Vanguard 106830 pool much of their repo investments in a joint account. For these joint accounts, the filings report a list of counterparties to the repos in this joint account, but only one repo rate for the whole account, and only the total collateral amount for the whole joint account, while notional values are listed by counterparty. We assign the single repo rate and the same haircuts to all counterparties to the repos in this joint account. B Risk Management Association Securities Lender Data Some securities lenders do not participate in the RMA survey in some quarters (see table A.II. Participants are marked with “x”). The biggest worry in this regard is about the non-participation of State Street in some of the surveys. State Street’s cash 50
- 52. collateral reinvestments amount to more than $0.5 trillion, and so omission of State Street would substantially understate the role of securities lenders. For this reason, we impute State Streets’ cash collateral reinvestment position (marked with “e” in Table A.II). We collect the total cash collateral reinvestment amount from State Street’s 10-K and 10-Q filings, and we assume that State Streets cash collateral is invested in the same way as the aggregate cash collateral portfolio of the securities lenders that participate in the RMA survey in a given quarter. A comparison of the portfolio allocations in adjacent quarters in which State Street does and does not participate does not reveal any substantial shifts in allocations. This indicates that State Streets portfolio allocation is unlikely to be very different from the allocation of other securities lenders. 51