Equilibrium and Kinetics of Adsorption of Cationic Dyes by STISHOVITE Clay – Tio2 Nan composite
•
1 like•598 views

http://www.ijmer.com/papers/Vol2_Issue6/AA2639893995.pdf

Recommended
Recommended
More Related Content
What's hot
What's hot (19)
Viewers also liked
Viewers also liked (20)
Similar to Equilibrium and Kinetics of Adsorption of Cationic Dyes by STISHOVITE Clay – Tio2 Nan composite
Similar to Equilibrium and Kinetics of Adsorption of Cationic Dyes by STISHOVITE Clay – Tio2 Nan composite (20)
More from IJMER
More from IJMER (20)
Equilibrium and Kinetics of Adsorption of Cationic Dyes by STISHOVITE Clay – Tio2 Nan composite
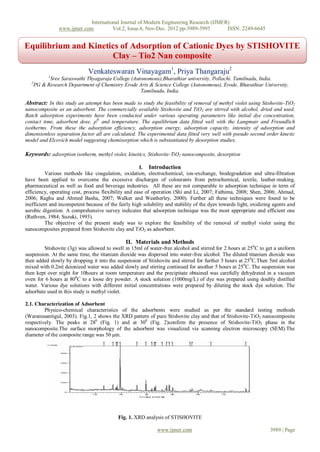
- 1. International Journal of Modern Engineering Research (IJMER) www.ijmer.com Vol.2, Issue.6, Nov-Dec. 2012 pp-3989-3995 ISSN: 2249-6645 Equilibrium and Kinetics of Adsorption of Cationic Dyes by STISHOVITE Clay – Tio2 Nan composite Venkateswaran Vinayagam1, Priya Thangaraju2 1 Sree Saraswathi Thyagaraja College (Autonomous),Bharathiar university, Pollachi. Tamilnadu, India. 2 PG & Research Department of Chemistry Erode Arts & Science College (Autonomous), Erode, Bharathiar University, Tamilnadu, India. Abstract: In this study an attempt has been made to study the feasibility of removal of methyl violet using Stishovite-TiO2 nanocomposite as an adsorbent. The commercially available Stishovite and TiO2 are stirred with alcohol, dried and used. Batch adsorption experiments have been conducted under various operating parameters like initial dye concentration, contact time, adsorbent dose, pH and temperature. The equilibrium data fitted well with the Langmuir and Freundlich isotherms. From these the adsorption efficiency, adsorption energy, adsorption capacity, intensity of adsorption and dimensionless separation factor all are calculated. The experimental data fitted very well with pseudo second order kinetic model and Elcovich model suggesting chemisorption which is substantiated by desorption studies. Keywords: adsorption isotherm, methyl violet, kinetics, Stishovite-TiO2 nanocomposite, desorption I. Introduction Various methods like coagulation, oxidation, electrochemical, ion-exchange, biodegradation and ultra-filtration have been applied to overcome the excessive discharges of colourants from petrochemical, textile, leather-making, pharmaceutical as well as food and beverage industries. All these are not comparable to adsorption technique in term of efficiency, operating cost, process flexibility and ease of operation (Shi and Li, 2007; Fathima, 2008; Shen, 2006; Ahmad, 2006; Raghu and Ahmed Basha, 2007; Walker and Weatherley, 2000). Further all these techniques were found to be inefficient and incompetent because of the fairly high solubility and stability of the dyes towards light, oxidizing agents and aerobic digestion. A comprehensive survey indicates that adsorption technique was the most appropriate and efficient one (Ruthven, 1984; Suzuki, 1993). The objective of the present study was to explore the feasibility of the removal of methyl violet using the nanocomposites prepared from Stishovite clay and TiO2 as adsorbent. II. Materials and Methods Stishovite (3g) was allowed to swell in 15ml of water-free alcohol and stirred for 2 hours at 250C to get a uniform suspension. At the same time, the titanium dioxide was dispersed into water-free alcohol. The diluted titanium dioxide was then added slowly by dropping it into the suspension of Stishovite and stirred for further 5 hours at 250C.Then 5ml alcohol mixed with 0.2ml deionized water was added slowly and stirring continued for another 5 hours at 250C. The suspension was then kept over night for 10hours at room temperature and the precipitate obtained was carefully dehydrated in a vacuum oven for 6 hours at 800C to a loose dry powder. A stock solution (1000mg/L) of dye was prepared using doubly distilled water. Various dye solutions with different initial concentrations were prepared by diluting the stock dye solution. The adsorbate used in this study is methyl violet. 2.1. Characterization of Adsorbent Physico-chemical characteristics of the adsorbents were studied as per the standard testing methods (Waranusantigul, 2003). Fig.1, 2 shows the XRD pattern of pure Stishovite clay and that of Stishovite-TiO2 nanocomposite respectively. The peaks at 280 (Fig. 1) and at 300 (Fig. 2)confirm the presence of Stishovite-TiO2 phase in the nanocomposite.The surface morphology of the adsorbent was visualized via scanning electron microscopy (SEM).The diameter of the composite range was 50 µm. Fig. 1. XRD analysis of STISHOVITE www.ijmer.com 3989 | Page
- 2. International Journal of Modern Engineering Research (IJMER) www.ijmer.com Vol.2, Issue.5, Nov-Dec. 2012 pp-2594-2600 ISSN: 2249-6645 Fig. 2. X RD analysis of STISHOVITE-TiO2 COMPOSITE Fig. 3.SEM of STISHOVITE Fig. 4. SEM of STISHOVITE – TiO2 COMPOSITE IR Spectroscopy: Stishovite Clay : Si-O-Si = 1011 cm-1 , Si-O-Ti = 872 cm-1 ,Ti-O-Si = 872 cm-1 , Ti-O-Ti = 1633 cm-1 Stishovite + TiO2 NC : Si-O-Si = 1014 cm-1 , Si-O-Ti = 873 cm-1 ,Ti-O-Si = 873 cm-1 , Ti-O-Ti = 1796 cm-1 III. Batch adsorption experiments Entire batch mode experiments were carried out in the temperature range 303K to 311K by taking 50ml of the respective dye solution and known amount of the adsorbent in a 100ml conical flask. The flasks were agitated for pre- www.ijmer.com 3990 | Page
- 3. International Journal of Modern Engineering Research (IJMER) www.ijmer.com Vol.2, Issue.5, Nov-Dec. 2012 pp-2594-2600 ISSN: 2249-6645 determined time intervals in a thermostat attached with a shaker at the desired temperature .The adsorbent and adsorbate were separated by filtration. Studies on the effects of agitation time, p H, initial dye concentration, adsorbent dose and temperature were carried out by using known amount of adsorbent and 50ml of dye solution of different concentrations. Dye solution (50ml) with different amounts of adsorbent was taken to study the effect of adsorbent dosage on the removal of dyes. IV. Results and Discussion 4.1. Effect of agitation time and initial dye concentration The effect of initial dye concentration and contact time for the removal of methyl violet is shown in Fig.5. For this study 50ml of 10 to 40 mg/L of dye solution was agitated with 100mg of adsorbent. The extent of removal of dye was faster in initial stages, then showed decreasing pattern and finally became constant showing the attainment of equilibrium. The extent of removal was found to be 88%. The curves obtained are single and smooth, indicating monolayer coverage on the adsorbent surface. Fig. 5. Effect of initial dye concentration 4.2. Effect of adsorbent dosage on adsorption process The effect of adsorbent dosage on basic dye removal was studied by keeping all other experimental conditions constant except that of adsorption dosage. The amount adsorbed per unit mass of the adsorbent decreased with increase in adsorbent concentration (Fig.6). The decrease in unit adsorption with increasing dose of adsorbent may basically be due to the fact that adsorption sites remaining unsaturated during the adsorption process. Fig 6. Effect of adsorbent dosage 4.3. Effect of pH Adsorption experiments were carried out at various pH values ranging from 6 to 11 maintaining the required pH by adding necessary amount of dilute hydrochloric acid and sodium hydroxide solutions. A p H meter calibrated with 4.0 and 9.0 buffers were used. Fig.7 indicates that maximum dye removal had occurred in basic medium. It was observed that as the p H increases the sorption capacity also increases. The pHzpc for the nanocomposite was determined as 8.0. www.ijmer.com 3991 | Page
- 4. International Journal of Modern Engineering Research (IJMER) www.ijmer.com Vol.2, Issue.5, Nov-Dec. 2012 pp-2594-2600 ISSN: 2249-6645 Fig. 7. Effect of pH 4.4. Effect of temperature Temperature has an important effect on the adsorption process. Fig.8 shows effect of different temperature on the removal of methyl violet by the nanocomposite. The amount of basic dye adsorbed increases with increasing temperature from 303K to 311K indicating the adsorption process to be endothermic. This may be due to the fact that as the temperature increases, rate of diffusion of adsorbate molecules across the external boundary layer and internal pores of adsorbent particle increase. Fig. 8. Effect of temperature 4.5. Adsorption isotherm The relationship between the amount of dye adsorbed and its equilibrium concentration was analysed using Langmuir and Freundlich isotherms. 4.5.1. Langmuir isotherm The Langmuir adsorption isotherm which assumes that adsorption takes place at specific homogeneous sites within the adsorbent has been used successfully for many systems that involve monolayer adsorptions. The linearized Langmuir equation (Eq.1): Ce / qe i / bq0 Ce / q0 (1) Where Ce is the equilibrium concentration of the adsorbate (mg/L), qe is the amount of dye adsorbed per unit mass of adsorbent (mg/L) and qo and b are Langmuir constants related to adsorption capacity and adsorption rate respectively. As required by equation (1) plotting Ce/qe against Ce gave a straight line, indicating that the adsorption of basic dyes on the nanocomposite follow the Langmuir isotherm. The Langmuir constants b and q 0 were evaluated, from the slope and intercept of the graph. The essential characteristics of the Langmuir isotherm can be expressed in terms of a dimensionless equilibrium parameter RL which is defined by, RL 1 / 1 bC0 (2) Where, C0 is the highest initial solute concentration, ‘b’ the Langmuir adsorption constant (L/mg). www.ijmer.com 3992 | Page
- 5. International Journal of Modern Engineering Research (IJMER) www.ijmer.com Vol.2, Issue.5, Nov-Dec. 2012 pp-2594-2600 ISSN: 2249-6645 If the value of R is less than one then it indicates favourable adsorption. The RL values shown in Table 1 all are less than one indicating the applicability of Langmuir isotherm to this adsorption process. Fig.9: Plot of Langmuir adsorption isotherm Table 1. The values of Langmuir constant Q 0 and b in addition to RL Methyl violet Concentration of dye(mg/L) RL b Qº mg/g R2 20 0.9939 40 0.9879 60 0.9819 0.000306 57.208 0.9962 80 0.9761 100 0.9703 120 0.9645 4.5.2. Freundlich Model The Freundlich isotherm, an empirical relationship used to describe heterogeneous systems can be expressed in its logarithmic form (Eq.3): log qe log K f 1 / n log Ce (3) Where Kf and 1/n are Freundlich constants related to adsorption capacity and adsorption intensity of the sorbent respectively.qe is the amount adsorbed at equilibrium (mg/g); Ce is the equilibrium concentration of the adsorbate. The values of Kf and 1/n calculated from the intercept and slope respectively are recorded in Table 2.The plot of log q e versus log Ce gave a straight line (Fig.10) with good regression coefficient indicating that the adsorption of methyl violet follows the Freundlich isotherm. 2 R2 = 0.9979 1.8 1.6 1.4 1.2 1 0.8 0.6 0.4 0.2 0 1 2 3 4 5 6 7 www.ijmer.com 3993 | Page
- 6. International Journal of Modern Engineering Research (IJMER) www.ijmer.com Vol.2, Issue.5, Nov-Dec. 2012 pp-2594-2600 ISSN: 2249-6645 Fig.10: Plot of Freundlich adsorption isotherm Table 2 .The values of Freundlich constant K f and n Dye Kf L/mg n mg/g R2 Methyl violet 10.9647 2.0000 0.9979 4.6. Kinetics of adsorption In order to investigate the mechanism of adsorption of methyl violet by the nanocomposite the following three kinetic models were considered. 4.6.1. Pseudo first order kinetic model The integrated linear form of this model proposed by Lagergren (Eq.4): log qe qt log qe k1 / 2.303 t (4) Where qe is the amount of dye adsorbed at equilibrium (mg/g), and qt is the amount of dye adsorbed (mg/g) at time t, k1 is the first order rate constant (min -1) and t is time (m).Hence a linear trace is expected between the two parameters log (qe-qt) and t, provided the adsorption follows first order kinetics. It is observed that the data does not fit in to first order equation. 4.6.2. Pseudo second order kinetics The adsorption may also be described by pseudo second order kinetic model .The linearised form of the pseudo second order model (Eq.5): t q 1 k q 2 1 q t (5) t 2 e e Where k2 is the second order rate constant (g/mg min).A plot of t/q t vs t should be linear if the adsorption follows second order.qe and k2 can be calculated from the slope and intercept of the plot. methyl violet obeys the pseudo order kinetics. 4.7. Elovich kinetic model The Elovich equation is mainly applicable for chemisorption processes involving heterogeneous adsorbing surfaces. The Elovich model in its integrated form can be Q 1 b ln ab 1 b ln t (6) t www.ijmer.com 3994 | Page
- 7. International Journal of Modern Engineering Research (IJMER) www.ijmer.com Vol.2, Issue.5, Nov-Dec. 2012 pp-2594-2600 ISSN: 2249-6645 Fig.12: Elkovich kinetic model Where ‘a’ is the initial adsorption rate (mg/g min) and ‘b’ is related to the extent of surface coverage and the activation energy for chemisorptions (g/mg). A plot of q t vs ln t is a straight line, as expected, with a slope of 1/b and an intercept log 1/b ln (ab) with good correlation coefficients confirming the chemisorptive nature of adsorption. 4.8. Thermodynamic of Adsorption Thermodynamic parameters like ΔH0 and ΔS0 were evaluated using Van’t Hoff’s equation: ln K S 0 R - H 0 RT (8) c Where KC is the Langmuir equilibrium constant, ΔH0 and ΔS0, are the standard enthalpy and entropy changes of adsorption respectively and their values are calculated from the slopes and intercepts respectively of the linear plot of ln K c vs 1/T.The free energy change for the adsorption process ΔG0 (kJ/mol) is derived (Eq.9): G 0 H 0 - TS 0 (9) Negative free energy change and positive entropy change of adsorption (Table 3) indicate that the adsorption process is favourable and spontaneous in nature. The endothermic nature of adsorption is confirmed by the positive ΔH 0 value. Table 3: Thermodynamic parameters for adsorption of methyl violet on Stishovite-TiO2 NC -∆G0 kJ/mol Dyes ∆S0 kJ/mol ∆H0 kJ/mol 303K 307K 311K Methyl violet 1.631 1.652 1.673 5.320 19.745 V. Desorption studies Desorption studies with acetic acid revealed that the regeneration of adsorbent was not satisfactory, which confirms the chemisorptive nature of adsorption. VI. Conclusion The present investigation showed that Stishovite-TiO2 nanocomposite can be used as adsorbent for removal of methyl violet. The amount of dye adsorbed varied with initial dye concentration, adsorbent dose, p H and temperature. Removal of methyl violet by nanocomposite obeyed both Langmuir and Freundlich isotherms. The adsorption process followed pseudo second order kinetics. This has been further supported by Elkovich chemisorptive kinetic model. Desorption studies reveals that no satisfactory desorption taking place confirming chemisorptive nature of adsorption. Evaluation of thermodynamic parameters showed the process as endothermic and spontaneous. References [1] Shi, B.G.Li, (2007), Removal of direct dyes by coagulation: The performance polymeric aluminium species. Journal of Hazardous Materials, 143 (1-2): 567-574. [2] Fathima, N.N. (2008), Dye house wastewater treatment through advanced oxidation process using Cu-exchanged Y zeolite: A heterogenous catalytic approach .Chemosphere 70(6):1146-1151. [3] Shen, Z. M. (2006), Methods to improve electrochemical treatment effect of dye wastewater. Journal of Hazardous Materials, 131(1-3): 90-97. [4] Ahmad, (2006), Micellar-enhancement ultra filtration for removal of reactive dyes from an aqueous solution.Desalination, 191(1- 3):153-161. [5] Raghu, S. and C.Ahmed Basha, (2007), Chemical or electrochemical techniques, followed by ion exchange for recycle of textile dye wastewater. Journal of Hazardous Materials, 149(2):324-330. [6] Walker, G.M. and L.R.Weatherley, (2000), Biodegradation and biosorption of acid anthraquinone dye. Environmental Pollution, 108(2):219-223. [7] Ruthven, D.M. (1984), Principles of Adsorption and Desorption Processes, John Willey and Sons, New York. [8] Suzuki. 1993, Fundamentals of Adsorption IV, Kodansha, Tokyo. [9] M.Ittal, (2008) Removal and recovery of hazardous triphenylamine dye, Methyl Violet through adsorption over granulated waste materials, Journal of Hazardous Materials, 150:364-375. [10] Lillie, R.D. and H.J.Conn, (1977), Biological Stains: A Handbook on the Nature and Uses of the Dyes Employed in the Biological laboratory, Williams & Wilkins, Baltimore. [11] Waranusantigul.P, (2003), Kinetics of basic dyes biosorption by giant duckweed, Environ Pollu., 125, 385-392. www.ijmer.com 3995 | Page