The water footprint of livestock products
•Descargar como PPT, PDF•
3 recomendaciones•6,496 vistas

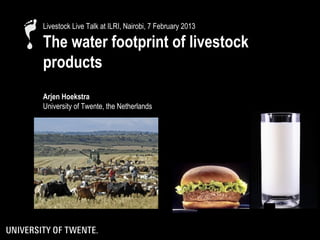
Presented by Arjen Hoekstra, University of Twente, the Netherlands, at the Livestock Live Talk at ILRI, Nairobi, 7 February 2013

Recomendados
Recomendados
Más contenido relacionado
La actualidad más candente
La actualidad más candente (20)
Destacado
Destacado (20)
Similar a The water footprint of livestock products
Similar a The water footprint of livestock products (20)
Más de ILRI
Más de ILRI (20)
Último
Último (20)
The water footprint of livestock products
- 1. Livestock Live Talk at ILRI, Nairobi, 7 February 2013 The water footprint of livestock products Arjen Hoekstra University of Twente, the Netherlands
- 2. The total water footprint of the average consumer in the world 3800 litre/day 3.8% of the water footprint relates to home water use 96.2% of the water footprint is ‘invisible’, related to the products bought on the market 91.5% agricultural products, 4.7% industrial products 22% of the water footprint does not lie within the country of the consumer, but other parts of the world Source: Hoekstra & Mekonnen (2012) The Water Footprint of Humanity, PNAS
- 3. Water footprint of national consumption Animal products Global average water footprint Animal products Source: Hoekstra & Mekonnen (2012) The Water Footprint of Humanity, PNAS
- 4. The water footprint of animal products ► The water footprint of the agricultural sector is 92% of the total water footprint of humanity. ► The water footprint of animal production is 29% of the water footprint of the global agricultural sector. Source: Mekonnen & Hoekstra (2012) A global assessment of the water footprint of farm animal products, Ecosystems
- 5. Meat consumption per capita World meat production India 3.3 kg/yr UK 86 kg/yr Global average 47 kg/yr Kenya 16 kg/yr USA 123 kg/yr Source: FAOSTAT (2010). Data for 2007.
- 6. Overview of presentation ► Globalization of water ► The water footprint concept ► The water footprint of animal products ► What can we do?
- 7. The spatial distribution of the water footprint of humanity Source: Hoekstra & Mekonnen (2012) The Water Footprint of Humanity, PNAS
- 8. The spatial distribution of the water footprint within Europe Source: Hoekstra & Mekonnen (2012) The Water Footprint of Humanity, PNAS
- 9. Europe: the world’s largest virtual water import region wheat, sunflower seed, cotton, industrial products soybean cotton cotton, wheat industrial products cotton cocoa cotton coffee soybean coffee soybean, sunflower seed 41% of the water footprint of European consumers is outside Europe Source: Hoekstra & Mekonnen (2012) The Water Footprint of Humanity, PNAS
- 10. Number of months with blue water scarcity > 100% Blue water scarcity = blue water footprint / blue water availability Source: Hoekstra et al. (2012) Global monthly water scarcity: blue water footprints versus blue water availability, PLoS ONE
- 11. The water footprint concept
- 12. The water footprint of a product the volume of fresh water used to produce the product, summed over the various steps of the production chain. when and where the water was used: a water footprint includes a temporal and spatial dimension. Source: Hoekstra et al. (2011) The Water Footprint Assessment Manual, Earthscan, London, UK
- 13. The water footprint of a product Green water footprint volume of rainwater evaporated or incorporated into a product Blue water footprint volume of surface or groundwater evaporated or incorporated into a product Grey water footprint volume of polluted water Source: Hoekstra et al. (2011) The Water Footprint Assessment Manual, Earthscan, London, UK
- 14. Components of a water footprint Traditional water use Direct water footprint Indirect water footprint statistics Green water footprint Green water footprint Gross water withdrawal Water consumption Return flow Blue water footprint Blue water footprint = Net water withdrawal Water Grey water footprint Grey water footprint pollution Source: Hoekstra et al. (2011) The Water Footprint Assessment Manual, Earthscan, London, UK
- 15. The water footprint of animal products
- 16. The water footprint of food Global average water footprint litre/kg litre/kcal starchy roots 400 0.5 cereals 1600 0.5 sugar crops 200 0.7 pulses 4000 1.1 vegetables 300 1.3 fruits 1000 2.1 pork 6000 2.2 poultry 4000 3.0 beef 15000 10.2 Source: Mekonnen & Hoekstra (2012) A global assessment of the water footprint of farm animal products, Ecosystems
- 17. The water footprint of crop products ► 146 crops and over 200 derived crop products, including various flours, beverages, fibres and biofuels. ► global coverage ► high spatial resolution (5x5 arc minute grid) ►explicit distinction rainfed-irrigated ► explicit distinction green-blue-grey
- 18. Global water footprint of wheat Source: Mekonnen & Hoekstra (2010) The green, blue and grey water footprint of crops and derived crop products, Value of Water Research Report Series No.47, UNESCO-IHE.
- 19. Global water footprint of soybean Source: Mekonnen & Hoekstra (2010) The green, blue and grey water footprint of crops and derived crop products, Value of Water Research Report Series No.47, UNESCO-IHE.
- 20. The water footprint of animal products ► six animal types ► global coverage ► per country ► explicit distinction extensive-mixed-intensive production systems ► accounting for composition and origin of animal feed ► explicit distinction green-blue-grey
- 21. The water footprint of a cow Food ► 1300 kg of grains (wheat, oats, barley, corn, dry peas, soybean, etc) ► 7200 kg of roughages (pasture, dry hay, silage, etc) 99% Water 1% ► 24000 litres for drinking ► 7000 litres for servicing Source: Hoekstra & Chapagain (2008) Globalization of Water, Blackwell, Oxford, UK
- 22. The water footprint of beef Source: Hoekstra & Chapagain (2008) Globalization of Water, Blackwell, Oxford, UK
- 23. ≠
- 24. Grazing systems Water footprint: •mostly green •local Mixed systems Water footprint: •green-blue-grey •local Water footprint: •green-blue-grey •partly imported Industrial systems
- 25. Dryland Grazing in dry- and wetlands: water footprint has a low opportunity cost Wetland
- 26. Factory farming: water footprint has a high opportunity cost
- 27. The water footprint of an animal product The two major factors Type of Feed conversion efficiency Water footprint of an production system Feed composition animal product grazing, mixed or concentrates vs. roughages Water footprint of the industrial feed Feed origin organic or organic or conventional Water footprint related to conventional drinking and other on-farm rain-fed or irrigated imported or local activities Source: Mekonnen & Hoekstra (2012) A global assessment of the water footprint of farm animal products, Ecosystems
- 28. The two major factors 80 60 Feed conversion ► feed conversion improves from grazing to industrial systems. kg feed (dry mass)/kg output 40 20 0 mixed mixed mixed grazing grazing grazing industrial industrial industrial poultry pork beef 100 Concentrate feed in total feed dry matter ► but at the cost of more 80 high-nutrient concentrate feed with a 60 larger water footprint than roughages. % 40 20 0 mixed mixed mixed grazing grazing grazing industrial industrial industrial Source: Mekonnen & Hoekstra (2012) A global assessment of poultry pork beef the water footprint of farm animal products, Ecosystems
- 29. The water footprint of animal versus vegetal products Water footprint Food item Litre per kg Litre per kcal Litre per gram protein Litre per gram fat Sugar crops 197 0.69 0.0 0.0 Vegetables 322 1.34 26 154 Starchy roots 387 0.47 31 226 Fruits 962 2.09 180 348 Cereals 1644 0.51 21 112 Oil crops 2364 0.81 16 11 Pulses 4055 1.19 19 180 Nuts 9063 3.63 139 47 Milk 1020 1.82 31 33 Eggs 3265 2.29 29 33 Chicken meat 4325 3.00 34 43 Butter 5553 0.72 - 6.4 Pig meat 5988 2.15 57 23 Sheep/goat meat 8763 4.25 63 54 Bovine meat 15415 10.19 112 153 Source: Mekonnen & Hoekstra (2012) A global assessment of the water footprint of farm animal products, Ecosystems
- 30. The water footprint of animal versus vegetal products ► The water footprint of any animal product is larger than the water footprint of a wisely chosen crop product with equivalent nutritional value. Source: Mekonnen & Hoekstra (2012) A global assessment of the water footprint of farm animal products, Ecosystems
- 31. Meat versus vegetarian diet Industrialised countries: Vegetarian Meat diet kcal/day litre/kcal litre/day kcal/day litre/kcal litre/day diet Animal Animal 950 2.5 2375 300 2.5 750 origin origin Vegetable Vegetable 2450 0.5 1225 3100 0.5 1550 origin origin Total 3400 3600 Total 3400 2300 Source: Hoekstra (2013) The Water Footprint of Modern Consumer Society, Routledge, London, UK.
- 32. Meat versus vegetarian diet Industrialised countries: Meat diet kcal/day litre/kcal litre/day Vegetarian kcal/day litre/kcal litre/day diet Animal 950 2.5 2375 Animal origin 300 2.5 750 origin Vegetable Vegetable 2450 0.5 1225 3100 0.5 1550 origin origin Total 3400 3600 Total 3400 2300 Source: Hoekstra (2013) The Water Footprint of Modern Consumer Society, Routledge, London, UK.
- 33. Meat versus vegetarian diet Developing countries: Meat diet kcal/day litre/kcal litre/day Vegetarian kcal/day litre/kcal litre/day diet Animal 350 2.5 875 Animal origin 200 2.5 500 origin Vegetable Vegetable 2350 0.5 1175 2500 0.5 1250 origin origin Total 2700 2050 Total 2700 1750 Source: Hoekstra (2013) The Water Footprint of Modern Consumer Society, Routledge, London, UK.
- 34. What can we do?
- 35. Reducing the water footprint of animal products Feed crop cultivation Livestock raising Reduce green - Increase green water productivity more From industrial towards grazing or mixed systems water footprint production from rain-fed lands - Reduce concentrate feed - Increase fraction of roughages Preferably grazing in areas unsuitable for crop Reduce blue - Towards supplementary or deficit irrigation growth (dry lands, wetlands, mountains) water footprint - Precision irrigation Reduce grey Organic or precision farming: - No preventive antibiotics water footprint reduce use of fertilisers and pesticides - No excessive manure
- 36. Reducing humanity’s water footprint – Companies Shared terminology & calculation standards – Global Water Footprint Standard Product transparency – water footprint reporting / disclosure – labelling of products – certification of businesses Quantitative footprint reduction targets – benchmarking The Water Footprint Assessment Manual Earthscan, London, UK, 2011
- 37. The Water Footprint Network Mission: Promoting sustainable, equitable and efficient water use through development of shared standards on water footprint accounting and guidelines for the reduction and offsetting of impacts of water footprints. Network: bringing together expertise from academia, businesses, civil society, governments and international organisations.
- 38. Overview of partners Water Footprint Network Partners by category XL company 30 Large company 10 Medium company 23 Small company 33 Government 10 International organisation 9 Academic Institute 29 Civil society / ngo 25 www.waterfootprint.org
Notas del editor
- Picture left: Kenya Picture right: kenya narok area rift valley; agriculture harvest grain & masai herders with grazing cows
- Source: Hoekstra, A.Y. and Mekonnen, M.M. (2012) The water footprint of humanity, Proceedings of the National Academy of Sciences , 109(9): 3232–3237. Mekonnen, M.M. and Hoekstra, A.Y. (2011) National water footprint accounts: the green, blue and grey water footprint of production and consumption, Value of Water Research Report Series No.50, UNESCO-IHE, Delft, the Netherlands.
- Source: Mekonnen, M.M. and Hoekstra, A.Y. (2010) The green, blue and grey water footprint of farm animals and animal products, Value of Water Research Report Series No.48, UNESCO-IHE, Delft, the Netherlands.
- Source: http://chartsbin.com/view/bhy
- Virtual water balance per country and gross virtual water import and export of EU27 related to trade in agricultural and industrial products over the period 1996-2005. Only the biggest gross flows (>13 Gm 3 ∕yr) are shown.
- The water footprint of a product (a commodity, good or service) is the total volume of freshwater used to produce the product, summed over the various steps of the production chain. The water footprint of a product refers not only to the total volume of water used; it also refers to where and when the water is used. Source: Hoekstra, A.Y., Chapagain, A.K., Aldaya, M.M. and Mekonnen, M.M. (2011) The water footprint assessment manual: Setting the global standard, Earthscan, London, UK. See page 195.
- Green water footprint – Volume of rainwater consumed during the production process. This is particularly relevant for agricultural and forestry products (products based on crops or wood), where it refers to the total rainwater evapotranspiration (from fields and plantations) plus the water incorporated into the harvested crop or wood. Blue water footprint – Volume of surface and groundwater consumed as a result of the production of a good or service. Consumption refers to the volume of freshwater used and then evaporated or incorporated into a product. It also includes water abstracted from surface or groundwater in a catchment and returned to another catchment or the sea. It is the amount of water abstracted from groundwater or surface water that does not return to the catchment from which it was withdrawn. Grey water footprint – The grey water footprint of a product is an indicator of freshwater pollution that can be associated with the production of a product over its full supply chain. It is defined as the volume of freshwater that is required to assimilate the load of pollutants based on natural background concentrations and existing ambient water quality standards. It is calculated as the volume of water that is required to dilute pollutants to such an extent that the quality of the water remains above agreed water quality standards. Source: Hoekstra, A.Y., Chapagain, A.K., Aldaya, M.M. and Mekonnen, M.M. (2011) The water footprint assessment manual: Setting the global standard, Earthscan, London, UK. See page 187, 189, 190.
- Water footprint – The water footprint is an indicator of freshwater use that looks at both direct and indirect water use of a consumer or producer. Green water footprint – Volume of rainwater consumed during the production process. This is particularly relevant for agricultural and forestry products (products based on crops or wood), where it refers to the total rainwater evapotranspiration (from fields and plantations) plus the water incorporated into the harvested crop or wood. Blue water footprint – Volume of surface and groundwater consumed as a result of the production of a good or service. Consumption refers to the volume of freshwater used and then evaporated or incorporated into a product. It also includes water abstracted from surface or groundwater in a catchment and returned to another catchment or the sea. It is the amount of water abstracted from groundwater or surface water that does not return to the catchment from which it was withdrawn. Grey water footprint – The grey water footprint of a product is an indicator of freshwater pollution that can be associated with the production of a product over its full supply chain. It is defined as the volume of freshwater that is required to assimilate the load of pollutants based on natural background concentrations and existing ambient water quality standards. It is calculated as the volume of water that is required to dilute pollutants to such an extent that the quality of the water remains above agreed water quality standards. As an indicator of ‘water use’, the water footprint differs from the classical measure of ‘water withdrawal’ in three respects: 1. It does not include blue water use, in so far as this water is returned to where it came from. 2. It is not restricted to blue water use, but also includes green and grey water. 3. It is not restricted to direct water use, but also includes indirect water use. Source: Hoekstra, A.Y., Chapagain, A.K., Aldaya, M.M. and Mekonnen, M.M. (2011) The water footprint assessment manual: Setting the global standard, Earthscan, London, UK. See page 3.
- Livestock products typically require more water per kilogram (or per calorie) than crop products.
- Mekonnen, M.M. and Hoekstra, A.Y. (2011) The green, blue and grey water footprint of crops and derived crop products, Hydrology and Earth System Sciences , 15(5): 1577-1600. Mekonnen, M.M. and Hoekstra, A.Y. (2010) The green, blue and grey water footprint of crops and derived crop products, Value of Water Research Report Series No.47, UNESCO-IHE.
- Source: Mekonnen, M.M. and Hoekstra, A.Y. (2010) A global and high-resolution assessment of the green, blue and grey water footprint of wheat, Hydrology and Earth System Sciences , 14(7), 1259–1276. Mekonnen, M.M. and Hoekstra, A.Y. (2010) A global and high-resolution assessment of the green, blue and grey water footprint of wheat, Value of Water Research Report Series No.42, UNESCO-IHE.
- Source: Mekonnen, M.M. and Hoekstra, A.Y. (2010) A global and high-resolution assessment of the green, blue and grey water footprint of wheat, Hydrology and Earth System Sciences , 14(7), 1259–1276. Mekonnen, M.M. and Hoekstra, A.Y. (2010) A global and high-resolution assessment of the green, blue and grey water footprint of wheat, Value of Water Research Report Series No.42, UNESCO-IHE.
- Mekonnen, M.M. and Hoekstra, A.Y. (2012) A global assessment of the water footprint of farm animal products, Ecosystems , 15(3): 401–415. Mekonnen, M.M. and Hoekstra, A.Y. (2010) The green, blue and grey water footprint of farm animals and animal products, Value of Water Research Report Series No.48, UNESCO-IHE.
- The water footprint of a beef cow is 3,100,000 litres. In an industrial beef production system, it takes in average three years before the animal is slaughtered to produce about 200 kg of boneless beef. The animal consumes nearly 1300 kg of grains (wheat, oats, barley, corn, dry peas, soybean meal and other small grains), 7200 kg of roughages (pasture, dry hay, silage and other roughages), 24 cubic meter of water for drinking and 7 cubic meter of water for servicing. This means that to produce one kilogram of boneless beef, we use about 6.5 kg of grain, 36 kg of roughages, and 155 litres of water (only for drinking and servicing). Producing the volume of feed requires about 15300 litres of water in average.
- The water footprint of beef is 15500 litres of water per kg of beef.
- The water footprint of a piece of beef depends on how it was produced, e.g. composition of animal feed, origin of the feed ingredients. Hoekstra, A.Y. (2010) The water footprint of animal products, In: D'Silva, J. and Webster, J. (eds.) The meat crisis: Developing more sustainable production and consumption, Earthscan, London, UK, pp. 22-33.
- Mekonnen, M.M. and Hoekstra, A.Y. (2010) The green, blue and grey water footprint of farm animals and animal products, Value of Water Research Report Series No.48, UNESCO-IHE, Delft, the Netherlands.
- Source: Mekonnen, M.M. and Hoekstra, A.Y. (2010) The green, blue and grey water footprint of farm animals and animal products, Value of Water Research Report Series No.48, UNESCO-IHE, Delft, the Netherlands.
- Source: Mekonnen, M.M. and Hoekstra, A.Y. (2010) The green, blue and grey water footprint of farm animals and animal products, Value of Water Research Report Series No.48, UNESCO-IHE, Delft, the Netherlands.
- Source: Mekonnen, M.M. and Hoekstra, A.Y. (2010) The green, blue and grey water footprint of farm animals and animal products, Value of Water Research Report Series No.48, UNESCO-IHE, Delft, the Netherlands.
- Source: Mekonnen, M.M. and Hoekstra, A.Y. (2010) The green, blue and grey water footprint of farm animals and animal products, Value of Water Research Report Series No.48, UNESCO-IHE, Delft, the Netherlands.
- Since food consumption gives the most important contribution to the water footprints of people, even in industrialised countries, dietary habits greatly influence the associated water footprint. In industrialised countries the average calorie consumption today is 3400 kcal per day; roughly 30% of that comes from animal products. When we assume that the average daily portion of animal products is a reasonable mix of beef, pork, poultry, fish, eggs and dairy products, we can estimate that 1 kcal of animal product requires roughly 2.5 litres of water on average. Products from vegetable origin, on the other hand, require roughly 0.5 litre of water per kcal, this time assuming a reasonable mix of cereals, pulses, roots, fruit and vegetables. Under these circumstances, producing the food for one day costs 3600 litres of water. In developing countries, the average consumption is lower: about 2700 kcal per day per person, only 13% of which is of animal origin. Such diet costs 2050 litres of water per day. These numbers are averages over averages, because, first, total caloric intakes and meat fractions assumed vary between and within nations, and, second, the water requirements actually vary across production regions and production systems. The averages shown here mainly function to make a comparison between the water footprints of a meat-based versus a vegetarian diet. A vegetarian diet has a smaller fraction of animal origin (not zero, because of dairy products still consumed). For industrialised countries, this reduces the food-related water footprint by 36%. In the case of developing countries, the switch to vegetarian diet saves 15% of water. Consumers can reduce their water footprint through reducing the volume of their meat consumption. Alternatively, or in addition, consumers can reduce their water footprint by being more selective in the choice of which piece of meat they pick. Chickens are less water-intensive than cows and beef from one production system cannot be compared in terms of associated water impacts to beef from another production system. Source: Hoekstra, A.Y. (2010) The water footprint of animal products, In: D'Silva, J. and Webster, J. (eds.) The meat crisis: Developing more sustainable production and consumption, Earthscan, London, UK, pp. 22-33.
- Since food consumption gives the most important contribution to the water footprints of people, even in industrialised countries, dietary habits greatly influence the associated water footprint. In industrialised countries the average calorie consumption today is 3400 kcal per day; roughly 30% of that comes from animal products. When we assume that the average daily portion of animal products is a reasonable mix of beef, pork, poultry, fish, eggs and dairy products, we can estimate that 1 kcal of animal product requires roughly 2.5 litres of water on average. Products from vegetable origin, on the other hand, require roughly 0.5 litre of water per kcal, this time assuming a reasonable mix of cereals, pulses, roots, fruit and vegetables. Under these circumstances, producing the food for one day costs 3600 litres of water. In developing countries, the average consumption is lower: about 2700 kcal per day per person, only 13% of which is of animal origin. Such diet costs 2050 litres of water per day. These numbers are averages over averages, because, first, total caloric intakes and meat fractions assumed vary between and within nations, and, second, the water requirements actually vary across production regions and production systems. The averages shown here mainly function to make a comparison between the water footprints of a meat-based versus a vegetarian diet. A vegetarian diet has a smaller fraction of animal origin (not zero, because of dairy products still consumed). For industrialised countries, this reduces the food-related water footprint by 36%. In the case of developing countries, the switch to vegetarian diet saves 15% of water. Consumers can reduce their water footprint through reducing the volume of their meat consumption. Alternatively, or in addition, consumers can reduce their water footprint by being more selective in the choice of which piece of meat they pick. Chickens are less water-intensive than cows and beef from one production system cannot be compared in terms of associated water impacts to beef from another production system. Source: Hoekstra, A.Y. (2010) The water footprint of animal products, In: D'Silva, J. and Webster, J. (eds.) The meat crisis: Developing more sustainable production and consumption, Earthscan, London, UK, pp. 22-33.
- Since food consumption gives the most important contribution to the water footprints of people, even in industrialised countries, dietary habits greatly influence the associated water footprint. In industrialised countries the average calorie consumption today is 3400 kcal per day; roughly 30% of that comes from animal products. When we assume that the average daily portion of animal products is a reasonable mix of beef, pork, poultry, fish, eggs and dairy products, we can estimate that 1 kcal of animal product requires roughly 2.5 litres of water on average. Products from vegetable origin, on the other hand, require roughly 0.5 litre of water per kcal, this time assuming a reasonable mix of cereals, pulses, roots, fruit and vegetables. Under these circumstances, producing the food for one day costs 3600 litres of water. In developing countries, the average consumption is lower: about 2700 kcal per day per person, only 13% of which is of animal origin. Such diet costs 2050 litres of water per day. These numbers are averages over averages, because, first, total caloric intakes and meat fractions assumed vary between and within nations, and, second, the water requirements actually vary across production regions and production systems. The averages shown here mainly function to make a comparison between the water footprints of a meat-based versus a vegetarian diet. A vegetarian diet has a smaller fraction of animal origin (not zero, because of dairy products still consumed). For industrialised countries, this reduces the food-related water footprint by 36%. In the case of developing countries, the switch to vegetarian diet saves 15% of water. Consumers can reduce their water footprint through reducing the volume of their meat consumption. Alternatively, or in addition, consumers can reduce their water footprint by being more selective in the choice of which piece of meat they pick. Chickens are less water-intensive than cows and beef from one production system cannot be compared in terms of associated water impacts to beef from another production system. Source: Hoekstra, A.Y. (2010) The water footprint of animal products, In: D'Silva, J. and Webster, J. (eds.) The meat crisis: Developing more sustainable production and consumption, Earthscan, London, UK, pp. 22-33.
- Source: Hoekstra, A.Y., Chapagain, A.K., Aldaya, M.M. and Mekonnen, M.M. (2011) The Water Footprint Assessment Manual: Setting the Global Standard, Earthscan, London, UK. Page 106-108.
- Source: Hoekstra, A.Y., Chapagain, A.K., Aldaya, M.M. and Mekonnen, M.M. (2011) The Water Footprint Assessment Manual: Setting the Global Standard, Earthscan, London, UK. Page 109.
- Calculate your own water footprint at www.waterfootprint.org
- Feel free to go to the water footprint website, find much more info and freely download publications.
- Calculate your own water footprint at www.waterfootprint.org