Buy Gruh Finance, CRISIL and ICRA rate Fixed Deposit programme as "AAA"
•
1 recomendación•536 vistas

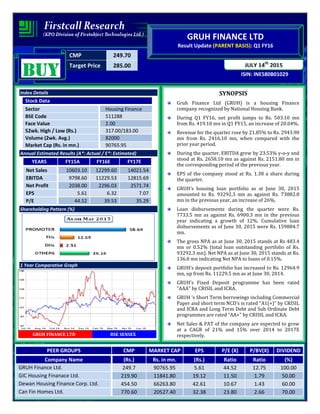
At the current market price of Rs. 249.70, the stock P/E ratio is at 39.53 x FY16E and 35.29 x FY17E respectively.

Recomendados
Recomendados
Más contenido relacionado
La actualidad más candente
La actualidad más candente (18)
Similar a Buy Gruh Finance, CRISIL and ICRA rate Fixed Deposit programme as "AAA"
Similar a Buy Gruh Finance, CRISIL and ICRA rate Fixed Deposit programme as "AAA" (20)
Más de IndiaNotes.com
Más de IndiaNotes.com (20)
Último
Último (20)
Buy Gruh Finance, CRISIL and ICRA rate Fixed Deposit programme as "AAA"
- 1. CMP 249.70 Target Price 285.00 ISIN: INE580B01029 JULY 14th 2015 GRUH FINANCE LTD Result Update (PARENT BASIS): Q1 FY16 BUYBUYBUYBUY Index Details Stock Data Sector Housing Finance BSE Code 511288 Face Value 2.00 52wk. High / Low (Rs.) 317.00/183.00 Volume (2wk. Avg.) 82000 Market Cap (Rs. in mn.) 90765.95 Annual Estimated Results (A*: Actual / E*: Estimated) YEARS FY15A FY16E FY17E Net Sales 10603.10 12299.60 14021.54 EBITDA 9798.60 11229.53 12815.69 Net Profit 2038.00 2296.03 2571.74 EPS 5.61 6.32 7.07 P/E 44.52 39.53 35.29 Shareholding Pattern (%) 1 Year Comparative Graph GRUH FINANCE LTD BSE SENSEX SYNOPSIS Gruh Finance Ltd (GRUH) is a housing Finance company recognized by National Housing Bank. During Q1 FY16, net profit jumps to Rs. 503.10 mn from Rs. 419.10 mn in Q1 FY15, an increase of 20.04%. Revenue for the quarter rose by 21.85% to Rs. 2943.90 mn from Rs. 2416.10 mn, when compared with the prior year period. During the quarter, EBITDA grew by 23.53% y-o-y and stood at Rs. 2658.10 mn as against Rs. 2151.80 mn in the corresponding period of the previous year. EPS of the company stood at Rs. 1.38 a share during the quarter. GRUH’s housing loan portfolio as at June 30, 2015 amounted to Rs. 93292.3 mn as against Rs. 73882.8 mn in the previous year, an increase of 26%. Loan disbursements during the quarter were Rs. 7733.5 mn as against Rs. 6900.3 mn in the previous year indicating a growth of 12%. Cumulative loan disbursements as of June 30, 2015 were Rs. 159884.7 mn. The gross NPA as at June 30, 2015 stands at Rs 483.4 mn or 0.52% (total loan outstanding portfolio of Rs. 93292.3 mn). Net NPA as at June 30, 2015 stands at Rs. 136.0 mn indicating Net NPA to loans of 0.15%. GRUH’s deposit portfolio has increased to Rs. 12964.9 mn, up from Rs. 11229.5 mn as at June 30, 2014. GRUH’s Fixed Deposit programme has been rated “AAA" by CRISIL and ICRA. GRUH ’s Short Term borrowings including Commercial Paper and short term NCD’s is rated “A1(+)” by CRISIL and ICRA and Long Term Debt and Sub Ordinate Debt programmes are rated “AA+" by CRISIL and ICRA. Net Sales & PAT of the company are expected to grow at a CAGR of 21% and 15% over 2014 to 2017E respectively. PEER GROUPS CMP MARKET CAP EPS P/E (X) P/BV(X) DIVIDEND Company Name (Rs.) Rs. in mn. (Rs.) Ratio Ratio (%) GRUH Finance Ltd. 249.7 90765.95 5.61 44.52 12.75 100.00 GIC Housing Finanace Ltd. 219.90 11841.80 19.12 11.50 1.79 50.00 Dewan Housing Finance Corp. Ltd. 454.50 66263.80 42.61 10.67 1.43 60.00 Can Fin Homes Ltd. 770.60 20527.40 32.38 23.80 2.66 70.00
- 2. QUARTERLY HIGHLIGHTS (PARENT BASIS) Results updates- Q1 FY16, Months Jun-15 Jun-14 % Change Net Sales 2943.90 2416.10 21.85 Net Profit 503.10 419.10 20.04 EPS 1.38 1.16 18.99 EBITDA 2658.10 2151.80 23.53 The company net profit jumps to Rs. 503.10 million against Rs. 419.10 million in the corresponding quarter ending of previous year, an increase of 20.04%. Revenue for the quarter rose by 21.85% to Rs. 2943.90 million from Rs. 2416.10 million, when compared with the prior year period. Reported earnings per share of the company stood at Rs. 1.38 a share during the quarter. Profit before interest, depreciation and tax grew by 23.53% y-o-y and stood at Rs. 2658.10 million as against Rs. 2151.80 million in the corresponding period of the previous year. Breakup of expenditure Break up of Expenditure (Rs. in Mn) Q1 FY16 Q1 FY15 % CHNG Employees Benefit Expenses 84.00 78.60 7% Depreciation 7.80 -12.60 -- Other Expenditure 81.00 67.00 21% Provision for contingencies 118.00 117.80 0% Bad Debts Written off 2.80 1.00 180% Latest Updates Loan disbursements during the quarter were Rs. 7733.5 mn as against Rs. 6900.3 mn in the previous year indicating a growth of 12%. Cumulative loan disbursements as of June 30, 2015 were Rs. 159884.7 mn. The gross NPA as at June 30, 2015 stands at Rs 483.4 mn or 0.52% (total loan outstanding portfolio of Rs. 93292.3 mn). Net NPA as at June 30, 2015 stands at Rs. 136.0 mn indicating Net NPA to loans of 0.15%.
- 3. GRUH’s deposit portfolio has increased to Rs. 12964.9 mn, up from Rs. 11229.5 mn as at June 30, 2014. GRUH’s Fixed Deposit programme has been rated “AAA" by CRISIL and ICRA. The rating of “AAA" indicates that the degree of safety of repayment and principal is Very Strong. GRUH ’s Short Term borrowings including Commercial Paper (CP) and short term NCD’s is rated “A1(+)” by CRISIL and ICRA and Long Term Debt and Sub Ordinate Debt programmes are rated “AA+" by CRISIL and ICRA. GRUH has a network of 162 retail offices across 8 states of the country. GRUH has 46 offices in Gujarat, 44 offices in Maharashtra, 17 offices in Karnataka, 23 offices in Madhya Pradesh, 11 offices in Rajasthan, 11 offices in Chhatisgarh, 9 offices in Tamil Nadu and 1 branch in Uttar Pradesh. COMPANY PROFILE GRUH Finance Ltd, subsidiary of HDFC is jointly promoted by HDFC & AKFED, established on July 21, 1986, it commenced in 1988 from Ahemedabad, Gujarat. Gruh Finance has been recognized by National Housing Finance Bank (NHB) for its refinance facility. GRUH has a network of 162 retail offices across eight states of the country. The company‘s main business is to provides loans for purchase, construction of residential house, repairs, renovation of dwellings units. GRUH’s major focus has been to provide home loans to individuals and families for purchase, constructions and extension. GRUH also provides loans for repair and renovations of houses and to families in the self employed category where formal income proofs are not easily available and the repayment capacity of such families are appraised based on their cash flows. Apart from extending home loans, GRUH offers loans for purchase and construction of non-residential properties (NRP). GRUH offers developers finance and mortgage loans on a selective basis.
- 4. FINANCIAL HIGHLIGHT (PARENT BASIS) (A*- Actual, E* -Estimations & Rs. In Millions) Balance Sheet as at March 31, 2014 -2017E GRUH FINANCE LIMITED. FY14A FY15A FY16E FY17E EQUITY AND LIABILITIES: Shareholders’ Funds: Share Capital 360.30 726.80 727.00 727.00 Reserves and Surplus 5712.10 6388.10 8684.13 11255.87 1. Sub-Total Net worth 6072.40 7114.90 9410.93 11982.67 Non-Current Liabilities: Long-term borrowings 50543.30 66241.40 74852.58 80841.00 Deferred Tax Liabilities [Net] 0.00 187.80 200.95 213.00 Other Long Term Liabilities 155.20 359.40 413.31 462.91 Long Term Provisions 528.70 664.30 863.59 993.13 2. Sub-Total Non-Current Liabilities 51227.20 67452.90 76330.43 82510.04 Current Liabilities: Short-term borrowings 4729.90 9731.80 10899.62 11880.48 Trade Payables 8.00 9.20 10.40 11.33 Other Current Liabilities 9743.50 6615.00 5821.20 6170.47 Short Term Provisions 651.20 891.40 980.54 1098.20 3. Sub-Total Current Liabilities 15132.60 17247.40 17711.75 19160.39 TOTAL EQUITY AND LIABILITIES (1+2+3) 72432.20 91815.20 103453.31 113653.31 ASSETS: Non-Current Assets: Fixed Assets Tangible Assets 104.70 127.30 150.21 171.24 Intangible Assets 5.60 10.00 11.70 13.46 a) Sub Total Fixed Assets 110.30 137.30 161.91 184.70 b) Non Current Investments 432.80 505.00 580.75 650.44 c) Deferred tax assets 169.00 0.00 0.00 0.00 d) Long Term Loans and Advances 66064.40 84121.80 94761.44 104116.27 e) Other non-current assets 0.00 212.00 233.20 251.86 4. Sub-Total Non-Current Assets 66776.50 84976.10 95737.30 105203.27 Current Assets: Current Investments 96.80 293.20 337.18 377.64 Cash and Bank Balances 831.70 740.70 799.96 855.95 Short Term Loans and Advances 370.90 390.60 406.22 426.54 Other Current Assets 4356.30 5414.60 6172.64 6789.91 5. Sub-Total Current Assets 5655.70 6839.10 7716.00 8450.04 TOTAL ASSETS (4+5) 72432.20 91815.20 103453.31 113653.31
- 5. Annual Profit & Loss Statement for the period of 2014 to 2017E Value(Rs. Mn) FY14A FY15A FY16E FY17E Description 12m 12m 12m 12m Net Sales 8456.90 10603.10 12299.60 14021.54 Other Income 4.70 0.10 0.00 0.00 Total Income 8461.60 10603.20 12299.60 14021.54 Expenditure -556.20 -804.60 -1070.06 -1205.85 Operating Profit 7905.40 9798.60 11229.53 12815.69 Interest -5436.30 -6777.30 -7997.21 -9228.78 Gross profit 2469.10 3021.30 3232.32 3586.90 Depreciation -24.50 -12.90 -34.50 -39.68 Profit Before Tax 2444.60 3008.40 3197.82 3547.23 Tax -675.00 -777.10 -901.78 -975.49 Profit After Tax 1769.60 2231.30 2296.03 2571.74 Extraordinary Items 0.00 -193.30 0.00 0.00 Net Profit 1769.60 2038.00 2296.03 2571.74 Equity capital 360.30 726.80 727.00 727.00 Reserves and Surplus 5712.10 6388.10 8684.13 11255.87 Face value 2.00 2.00 2.00 2.00 EPS 9.82 5.61 6.32 7.07 Quarterly Profit & Loss Statement for the period of 31st Dec, 2014 to 30th Sep, 2015E Value (Rs. Mn) 31-Dec-14 31-Mar-15 30-Jun-15 30-Sep-15E Description 3m 3m 3m 3m Net Sales 2711.10 3049.90 2943.90 3120.53 Other income 0.00 0.00 0.00 0.00 Total Income 2711.10 3049.90 2943.90 3120.53 Expenditure -294.60 -164.00 -285.80 -273.05 Operating Profit 2416.50 2885.90 2658.10 2847.49 Interest -1736.20 -1827.40 -1901.80 -1996.89 Gross profit 680.30 1058.50 756.30 850.60 Depreciation -7.90 -9.60 -7.80 -8.89 Profit Before Tax 672.40 1048.90 748.50 841.71 Tax -174.00 -255.00 -245.40 -252.51 Profit After Tax 498.40 793.90 503.10 589.19 Extraordinary Items -51.00 -53.30 0.00 0.00 Net Profit 447.40 740.60 503.10 589.19 Equity capital 726.80 726.80 727.00 727.00 Face value 2.00 2.00 2.00 2.00 EPS 1.23 2.04 1.38 1.62
- 6. Ratio Analysis Particulars FY14A FY15A FY16E FY17E EPS (Rs.) 9.82 5.61 6.32 7.07 EBITDA Margin (%) 93.48% 92.41% 91.30% 91.40% PBT Margin (%) 28.91% 28.37% 26.00% 25.30% PAT Margin (%) 20.92% 21.04% 18.67% 18.34% P/E Ratio (x) 25.42 44.52 39.53 35.29 ROE (%) 29.14% 31.36% 24.40% 21.46% ROCE (%) 12.93% 11.81% 11.84% 12.28% Debt Equity Ratio 9.10 10.68 9.11 7.74 EV/EBITDA (x) 12.56 16.91 15.62 14.22 Book Value (Rs.) 33.71 19.58 25.89 32.97 P/BV 7.41 12.75 9.64 7.57 Chart
- 7. OUTLOOK AND CONCLUSION At the current market price of Rs. 249.70, the stock P/E ratio is at 39.53 x FY16E and 35.29 x FY17E respectively. Earning per share (EPS) of the company for the earnings for FY16E and FY17E is seen at Rs.6.32 and Rs.7.07 respectively. Net Sales and PAT of the company are expected to grow at a CAGR of 21% and 15% over 2014 to 2017E respectively. On the basis of EV/EBITDA, the stock trades at 15.62 x for FY16E and 14.22 x for FY17E. Price to Book Value of the stock is expected to be at 9.64 x and 7.57 x for FY16E and FY17E respectively. We expect that the company surplus scenario is likely to continue for the next two to three years, will keep its growth story in the coming quarters also. Hence, we recommend ‘BUY’ for ‘GRUH FINANCE LTD’ with a target price of Rs. 285.00 for medium to long term investment. INDUSTRY OVERVIEW The new government at the centre has infused optimism in the sentiments in general. The Reserve Bank of India has managed to bring down the CPI inflation to 6% from the double digit level of inflation which persisted over the previous two years. A large part of disinflation has been on account of the slump in international crude oil prices. The Union Budget has also announced initiatives to boost investment. As a result, the outlook for the GDP growth has improved. However, the unseasonal rains and hailstorms during the last month could have adverse impact on the agriculture and CPI inflation. Hence, what remains to be seen is the pace with which the acceleration takes place without increasing the inflation. The Reserve Bank of India, in its endeavours to boost the pace of growth, reduced repo rate twice during the year. In its recent bimonthly policy, RBI has also indicated that it will continue to be accommodative in further easing of the rates if the inflation remains within the acceptable range and transmission to lending rates. It is therefore expected that the credit growth which had declined to 9% - lowest in the decade from 14% during the previous year; is likely to improve during the new financial year. The asset quality which had deteriorated in general across the banking sector during the year under review, is expected to remain weak until economic growth gathers momentum. Even, net-interest margins are expected to follow the similar pattern after experiencing decline by the banking sector.
- 8. During the year, the regulator for Housing Finance Companies (HFC)- National Housing Bank (NHB) stipulated that HFCs are required to create Deferred Tax Liability in respect of Special Reserve being created by HFCs. As a result, the reported Profit After Tax (PAT) gets adversely impacted. GRUH is of the opinion that generally HFCs would not be required to utilise Special Reserve since specific provisions towards Standard Loan Assets and Non Performing Loans are being made. Hence, in all probabilities, such creation of Deferred Tax Liability will not get crystallized in the long term period but HFCs will report lower PAT due to such accounting entry. Market Scenario There has been no change in the status of demand in the real estate sector and inventory of unsold properties had bulged to an all time high level. As a result, most of the lenders stepped up the disbursals of loans against existing properties. The spurt in mortgage loans, at a time when the economy has been at its lowest ebb; could prove difficult while effecting recoveries. Hence the risks have increased in the housing finance market when the demand for new residential properties is very sluggish and property valuations have increased. The market scenario has become much more discouraging and it is expected that the scenario might not change for a further period of 12 to 15 months. However, in line with the Central Government’s Housing for all – 2022 programme, various State Governments have taken up housing projects in the affordable segment through their agencies viz. Municipal Corporations, Housing Boards, Development Authorities or through specialised agencies set up for the purpose. GRUH is working with these agencies and lending to beneficiaries who are in the EWS and LIG segment. GRUH has been trying to minimise the risk while lending to these segments as much as possible by entering into Tripartiate agreements wherein the government agencies are a party. Disclaimer: This document is prepared by our research analysts and it does not constitute an offer or solicitation for the purchase or sale of any financial instrument or as an official confirmation of any transaction. The information contained herein is from publicly available data or other sources believed to be reliable but we do not represent that it is accurate or complete and it should not be relied on as such. Firstcall Research or any of its affiliates shall not be in any way responsible for any loss or damage that may arise to any person from any inadvertent error in the information contained in this report. Firstcall Research and/ or its affiliates and/or employees will not be liable for the recipients’ investment decision based on this document.
- 9. Firstcall India Equity Research: Email – info@firstobjectindia.com C.V.S.L.Kameswari Pharma & Diversified U. Janaki Rao Capital Goods B. Anil Kumar Auto, IT & FMCG M. Vinayak Rao Diversified G. Amarender Diversified Firstcall Research Provides Industry Research on all the Sectors and Equity Research on Major Companies forming part of Listed and Unlisted Segments For Further Details Contact: Tel.: 022-2527 2510/2527 6077 / 25276089 Telefax: 022-25276089 040-20000235 /20000233 E-mail: info@firstobjectindia.com www.firstcallresearch.com