Indian chemical industry to reach a size of $350 bn by 2021; Buy Vinyl Chemicals
•
1 like•433 views

The document provides an analysis and stock recommendation for Vinyl Chemicals (India) Ltd. Some key points: - Vinyl Chemicals reported an 11.8% increase in net profit and 12.84% rise in revenue for Q4 FY15 compared to the previous year. - Earnings per share grew 11.8% to Rs. 1.86 for Q4 FY15. - The company recommended a dividend of Rs. 1.5 per share for FY15 and saw net sales increase 51% to Rs. 4415.6 million for the full year. - The analyst recommends buying the stock with a target price of Rs. 83, noting expected revenue and

Recommended
Recommended
More Related Content
What's hot
What's hot (20)
Similar to Indian chemical industry to reach a size of $350 bn by 2021; Buy Vinyl Chemicals
Similar to Indian chemical industry to reach a size of $350 bn by 2021; Buy Vinyl Chemicals (20)
More from IndiaNotes.com
More from IndiaNotes.com (20)
Recently uploaded
Recently uploaded (20)
Indian chemical industry to reach a size of $350 bn by 2021; Buy Vinyl Chemicals
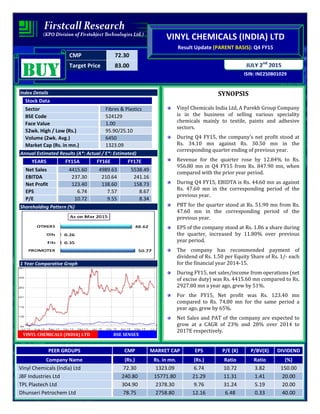
- 1. CMP 72.30 Target Price 83.00 ISIN: INE250B01029 JULY 2nd 2015 VINYL CHEMICALS (INDIA) LTD Result Update (PARENT BASIS): Q4 FY15 BUYBUYBUYBUY Index Details Stock Data Sector Fibres & Plastics BSE Code 524129 Face Value 1.00 52wk. High / Low (Rs.) 95.90/25.10 Volume (2wk. Avg.) 6450 Market Cap (Rs. in mn.) 1323.09 Annual Estimated Results (A*: Actual / E*: Estimated) YEARS FY15A FY16E FY17E Net Sales 4415.60 4989.63 5538.49 EBITDA 237.30 210.64 241.16 Net Profit 123.40 138.60 158.73 EPS 6.74 7.57 8.67 P/E 10.72 9.55 8.34 Shareholding Pattern (%) 1 Year Comparative Graph VINYL CHEMICALS (INDIA) LTD BSE SENSEX SYNOPSIS Vinyl Chemicals India Ltd, A Parekh Group Company is in the business of selling various speciality chemicals mainly to textile, paints and adhesive sectors. During Q4 FY15, the company’s net profit stood at Rs. 34.10 mn against Rs. 30.50 mn in the corresponding quarter ending of previous year. Revenue for the quarter rose by 12.84% to Rs. 956.80 mn in Q4 FY15 from Rs. 847.90 mn, when compared with the prior year period. During Q4 FY15, EBIDTA is Rs. 44.60 mn as against Rs. 47.60 mn in the corresponding period of the previous year. PBT for the quarter stood at Rs. 51.90 mn from Rs. 47.60 mn in the corresponding period of the previous year. EPS of the company stood at Rs. 1.86 a share during the quarter, increased by 11.80% over previous year period. The company has recommended payment of dividend of Rs. 1.50 per Equity Share of Rs. 1/- each for the financial year 2014-15. During FY15, net sales/income from operations (net of excise duty) was Rs. 4415.60 mn compared to Rs. 2927.80 mn a year ago, grew by 51%. For the FY15, Net profit was Rs. 123.40 mn compared to Rs. 74.80 mn for the same period a year ago, grew by 65%. Net Sales and PAT of the company are expected to grow at a CAGR of 23% and 28% over 2014 to 2017E respectively. PEER GROUPS CMP MARKET CAP EPS P/E (X) P/BV(X) DIVIDEND Company Name (Rs.) Rs. in mn. (Rs.) Ratio Ratio (%) Vinyl Chemicals (India) Ltd 72.30 1323.09 6.74 10.72 3.82 150.00 JBF Industries Ltd 240.80 15771.80 21.29 11.31 1.41 20.00 TPL Plastech Ltd 304.90 2378.30 9.76 31.24 5.19 20.00 Dhunseri Petrochem Ltd 78.75 2758.80 12.16 6.48 0.33 40.00
- 2. QUARTERLY HIGHLIGHTS (PARENT BASIS) Results updates- Q4 FY15, Months Mar-15 Mar-14 % Change Net Sales 956.80 847.90 12.84 PAT 34.10 30.50 11.80 EPS 1.86 1.67 11.80 EBITDA 44.60 47.60 (6.30) The company’s net profit stood to Rs. 34.10 million against Rs. 30.50 million in the corresponding quarter ending of previous year. Revenue for the quarter rose by 12.84% to Rs. 956.80 million from Rs. 847.90 million, when compared with the prior year period. Reported earnings per share of the company stood at Rs. 1.86 a share during the quarter, an increase of 11.80% over previous year period. Profit before interest, depreciation and tax is Rs. 44.60 million as against Rs. 47.60 million in the corresponding period of the previous year. Break up of Expenditure Break up of Expenditure Rs. Million Q4 FY15 Q4 FY14 % Change Purchase of Stock in Trade 726.20 809.30 -10% Employee Benefit Expenses 7.80 5.10 53% Other Expenditure 9.60 2.60 269%
- 3. Latest Updates • The company has recommended payment of dividend of Rs. 1.50 per Equity Share of Rs. 1/- each for the financial year 2014-15. • For the FY15, the company’s net sales/income from operations (net of excise duty) was Rs. 4415.60 million compared to Rs. 2927.80 million a year ago. • For the FY15, Net profit was Rs. 123.40 million compared to Rs. 74.80 million for the same period a year ago. COMPANY PROFILE Vinyl Chemicals India Ltd, A Parekh Group Company is in the business of selling various speciality chemicals mainly to textile, paints and adhesive sectors. It primarily sells vinyl acetate monomer to textile, paints, and adhesive sectors.The company was incorporated in 1986 and is based in Mumbai, India. Vinyl Acetate Monomer (VAM) was manufactured in the plant located at Mahad in Raigad Dist , Maharashtra , India and was sold all over the World. The company having major share of business of this product in India. Lately during Dec'07 the said plant was de-merged to resultant parent company Pidilite Industries Ltd for strategic reasons. However, the Company's main focus remains in its product “Vinyl Acetate Monomer “(VAM). The VAM is now imported/sourced from various Global suppliers and distributed / traded in India.
- 4. FINANCIAL HIGHLIGHT (PARENT BASIS) (A*- Actual, E* -Estimations & Rs. In Millions) Balance sheet as at March 31, 2014 to 2017E FY14A FY15A FY16E FY17E SOURCES OF FUNDS Shareholder's Funds Share Capital 18.30 18.30 18.30 18.30 Reserves and Surplus 237.70 328.10 426.53 511.84 1. Sub Total - Net worth 256.00 346.40 444.83 530.14 Non Current Liabilities Long Term Borrowings 4.95 4.90 4.66 4.42 Differed Tax Liability 0.07 0.10 0.13 0.15 Other Long Term Liabilities 1.74 0.00 0.00 0.00 Long Term Provisions 0.40 0.50 0.59 0.66 2. Sub Total - Non Current Liabilities 7.16 5.50 5.37 5.23 Current Liabilities Trade Payables 737.29 597.40 598.49 622.43 Other Current Liabilities 25.25 46.10 56.70 65.78 Short Term Provisions 32.14 41.10 47.68 53.78 3. Sub Total - Current Liabilities 794.68 684.60 702.87 741.98 Total Liabilities (1+2+3) 1057.84 1036.50 1153.07 1277.35 APPLICATION OF FUNDS Non-Current Assets Fixed Assets Tangible assets 2.37 2.30 2.48 2.63 a) Sub Total - Fixed Assets 2.37 2.30 2.48 2.63 b) Long Term Loans and Advances 10.72 8.90 9.79 10.57 1. Sub Total – Non Current Assets 13.09 11.20 12.27 13.21 Current Assets Current Investment 50.97 89.10 110.48 131.48 Inventories 359.98 377.40 407.59 447.27 Trade receivables 525.50 480.40 528.44 576.00 Cash and Bank Balances 69.00 26.90 30.94 34.65 Short-terms loans & advances 39.30 51.50 63.35 74.75 2. Sub Total - Current Assets 1044.75 1025.30 1140.80 1264.14 Total Assets (1+2) 1057.84 1036.50 1153.07 1277.35
- 5. Annual Profit & Loss Statement for the period of 2014 to 2017E Value(Rs.in.mn) FY14A FY15A FY16E FY17E Description 12m 12m 12m 12m Net Sales 2927.80 4415.60 4989.63 5538.49 Other Income 10.40 12.90 13.55 14.09 Total Income 2938.20 4428.50 5003.17 5552.57 Expenditure -2824.50 -4191.20 -4792.54 -5311.41 Operating Profit 113.70 237.30 210.64 241.16 Interest -0.40 -0.70 -0.63 -0.66 Gross profit 113.30 236.60 210.01 240.50 Depreciation 0.00 0.00 0.00 0.00 Exceptional Items 0.00 -49.40 0.00 0.00 Profit Before Tax 113.30 187.20 210.01 240.50 Tax -38.50 -63.80 -71.40 -81.77 Net Profit 74.80 123.40 138.60 158.73 Equity capital 18.30 18.30 18.30 18.30 Reserves 237.70 328.10 426.53 511.84 Face value 1.00 1.00 1.00 1.00 EPS 4.09 6.74 7.57 8.67 Quarterly Profit & Loss Statement for the period of 30th Sep, 2014 to 30th June, 2015E Value(Rs.in.mn) 30-Sep-14 31-Dec-14 31-Mar-15 30-Jun-15E Description 3m 3m 3m 3m Net sales 1166.30 1090.70 956.80 1224.70 Other income 9.10 2.50 1.30 1.48 Total Income 1175.40 1093.20 958.10 1226.19 Expenditure -1102.70 -1068.00 -913.50 -1178.17 Operating profit 72.70 25.20 44.60 48.02 Interest -0.10 -0.20 -0.10 -0.09 Gross profit 72.60 25.00 44.50 47.93 Depreciation 0.00 0.00 0.00 0.00 Exceptional Items 0.00 0.00 7.40 0.00 Profit Before Tax 72.60 25.00 51.90 47.93 Tax -24.80 -8.30 -17.80 -16.39 Net Profit 47.80 16.70 34.10 31.54 Equity capital 18.30 18.30 18.30 18.30 Face value 1.00 1.00 1.00 1.00 EPS 2.61 0.91 1.86 1.72
- 6. Ratio Analysis Particulars FY14A FY15A FY16E FY17E EPS (Rs.) 4.09 6.74 7.57 8.67 EBITDA Margin (%) 3.88% 5.37% 4.22% 4.35% PBT Margin (%) 3.87% 4.24% 4.21% 4.34% PAT Margin (%) 2.55% 2.79% 2.78% 2.87% P/E Ratio (x) 17.69 10.72 9.55 8.34 ROE (%) 29.22% 35.62% 31.16% 29.94% ROCE (%) 43.57% 67.55% 46.86% 45.11% Debt Equity Ratio 0.02 0.01 0.01 0.01 EV/EBITDA (x) 10.63 5.11 5.63 4.82 Book Value (Rs.) 13.99 18.93 24.31 28.97 P/BV 5.17 3.82 2.97 2.50 Charts
- 7. OUTLOOK AND CONCLUSION At the current market price of Rs.72.30, the stock P/E ratio is at 9.55 x FY16E and 8.34 x FY17E respectively. Earning per share (EPS) of the company for the earnings for FY16E and FY17E is seen at Rs.7.57 and Rs.8.67 respectively. Net Sales and PAT of the company are expected to grow at a CAGR of 23% and 28% over 2014 to 2017E respectively. On the basis of EV/EBITDA, the stock trades at 5.63 x for FY16E and 4.82 x for FY17E. Price to Book Value of the stock is expected to be at 2.97 x and 2.50 x for FY16E and FY17E respectively. We recommend ‘BUY’ in this particular scrip with a target price of Rs. 83.00 for Medium to Long term investment. INDUSTRY OVERVIEW The Indian chemical industry stands as the third largest producer in Asia and 12th in world, in terms of volume. This industry could grow at 14 per cent per annum to reach a size of US$ 350 billion by 2021. India accounts for approximately 7 per cent of the world production of dyestuff and dye intermediates and is currently the world's third largest consumer of polymers and fourth largest producer of agrochemicals. The market size of the chemical industry is expected to grow to US$ 350 billion by 2021. With 71 per cent of the total production share, alkali chemicals form the largest segment in the Indian chemical industry. During FY14,
- 8. the production of alkali chemicals stood at 6,265 million tonnes (MT). Total exports of chemicals grew from US$ 3.5 billion in FY03 to US$19.2 billion in FY14, a compound annual growth rate (CAGR) of 16.9 per cent. The Government of India has approved 100 per cent foreign direct investment (FDI) in the chemicals sector and reduced excise duty from 14 per cent to 10 per cent. Policies have been initiated to set up integrated Petroleum, Chemicals and Petrochemicals Investment Regions (PCPIR). PCPIR will be an investment region spread across 250 square kilometres for manufacturing of domestic and export-related products of petroleum, chemicals and petrochemicals. The polymer chemicals sector is anticipated to grow at a higher rate due to growth in plastic demand resulting from increased usage in packaging, construction and automotive sectors. Disclaimer: This document is prepared by our research analysts and it does not constitute an offer or solicitation for the purchase or sale of any financial instrument or as an official confirmation of any transaction. The information contained herein is from publicly available data or other sources believed to be reliable but we do not represent that it is accurate or complete and it should not be relied on as such. Firstcall Research or any of its affiliates shall not be in any way responsible for any loss or damage that may arise to any person from any inadvertent error in the information contained in this report. Firstcall Research and/ or its affiliates and/or employees will not be liable for the recipients’ investment decision based on this document.
- 9. Firstcall India Equity Research: Email – info@firstobjectindia.com C.V.S.L.Kameswari Pharma & Diversified U. Janaki Rao Capital Goods B. Anil Kumar Auto, IT & FMCG M. Vinayak Rao Diversified G. Amarender Diversified Firstcall Research Provides Industry Research on all the Sectors and Equity Research on Major Companies forming part of Listed and Unlisted Segments For Further Details Contact: Tel.: 022-2527 2510/2527 6077 / 25276089 Telefax: 022-25276089 040-20000235 /20000233 E-mail: info@firstobjectindia.com www.firstcallresearch.com