Prabhudas Lilladher reiterates overweight outlook on cement sector
•
0 likes•234 views

All‐India cement production grew 1.9% YoY at 46.4 million for the Jan‐Feb period, as per the published data of Economic Advisor of India. Growth was held back due to sluggish demand from private sector and curtailment in government spending in order to meet fiscal deficit target.

Recommended
Recommended
More Related Content
What's hot
What's hot (20)
Viewers also liked
Viewers also liked (19)
Similar to Prabhudas Lilladher reiterates overweight outlook on cement sector
Similar to Prabhudas Lilladher reiterates overweight outlook on cement sector (20)
More from IndiaNotes.com
More from IndiaNotes.com (20)
Recently uploaded
Recently uploaded (20)
Prabhudas Lilladher reiterates overweight outlook on cement sector
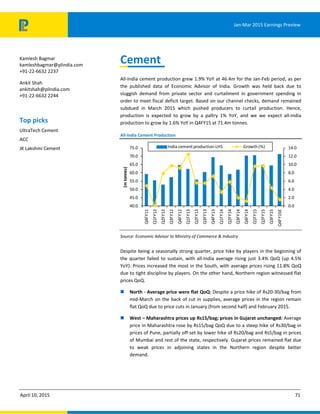
- 1. April 10, 2015 71 Jan‐Mar 2015 Earnings Preview Kamlesh Bagmar kamleshbagmar@plindia.com +91‐22‐6632 2237 Ankit Shah ankitshah@plindia.com +91‐22‐6632 2244 Top picks UltraTech Cement ACC JK Lakshmi Cement Cement All‐India cement production grew 1.9% YoY at 46.4m for the Jan‐Feb period, as per the published data of Economic Advisor of India. Growth was held back due to sluggish demand from private sector and curtailment in government spending in order to meet fiscal deficit target. Based on our channel checks, demand remained subdued in March 2015 which pushed producers to curtail production. Hence, production is expected to grow by a paltry 1% YoY, and we we expect all‐India production to grow by 1.6% YoY in Q4FY15 at 71.4m tonnes. All‐India Cement Production 0.0 2.0 4.0 6.0 8.0 10.0 12.0 14.0 40.0 45.0 50.0 55.0 60.0 65.0 70.0 75.0 Q4FY11 Q1FY12 Q2FY12 Q3FY12 Q4FY12 Q1FY13 Q2FY13 Q3FY13 Q4FY13 Q1FY14 Q2FY14 Q3FY14 Q4FY14 Q1FY15 Q2FY15 Q3FY15 Q4FY15E (m tonnes) India cement production‐LHS Growth (%) Source: Economic Advisor to Ministry of Commerce & Industry Despite being a seasonally strong quarter, price hike by players in the beginning of the quarter failed to sustain, with all‐India average rising just 3.4% QoQ (up 4.5% YoY). Prices increased the most in the South, with average prices rising 11.8% QoQ due to tight discipline by players. On the other hand, Northern region witnessed flat prices QoQ. North ‐ Average price were flat QoQ: Despite a price hike of Rs20‐30/bag from mid‐March on the back of cut in supplies, average prices in the region remain flat QoQ due to price cuts in January (from second half) and February 2015. West – Maharashtra prices up Rs15/bag; prices in Gujarat unchanged: Average price in Maharashtra rose by Rs15/bag QoQ due to a steep hike of Rs30/bag in prices of Pune, partially off‐set by lower hike of Rs20/bag and Rs5/bag in prices of Mumbai and rest of the state, respectively. Gujarat prices remained flat due to weak prices in adjoining states in the Northern region despite better demand.
- 2. April 10, 2015 72 Jan‐Mar 2015 Earnings Preview Central – UP’s price fell by Rs4/bag QoQ; MP settles with a cut of Rs5: Prices in UP fell due to weak secondary sales and infra sector. Prices in MP fell by Rs5/bag QoQ due to weak prices in UP and Bihar (key market for MP‐based producers) and subdued demand in the state. South – Discipline drives steep hike of Rs40/bag QoQ in region's average: After witnessing a dip in prices in the previous quarter, producers resorted to a tight discipline during the quarter. Hence, average prices in Tamil Nadu/Bengaluru/Hyderabad/Kerala rose by Rs50/Rs30/Rs35/Rs45 per bag QoQ, East – Mild price hike of Rs5/bag QoQ: Region's demand was impacted due to contraction in industrial activities across the resource rich states of the region and poor public spending. Prices in West Bengal and Orissa, the most prominent states in the region, rose by Rs5/bag QoQ, while prices in Bihar rose by Rs8/bag. Region‐wise prices 230 245 260 275 290 305 320 335 350 365 380 Apr‐13 May‐13 Jun‐13 Jul‐13 Aug‐13 Sep‐13 Oct‐13 Nov‐13 Dec‐13 Jan‐14 Feb‐14 Mar‐14 Apr‐14 May‐14 Jun‐14 Jul‐14 Aug‐14 Sep‐14 Oct‐14 Nov‐14 Dec‐14 Jan‐15 Feb‐15 Mar‐15 Rs/50kg bag North South West Central East Source: Industry, PL Research EBITDA for our coverage universe is expected to decline by 8% YoY. Lower volumes and weak realisations were the key variables behind the poor performance. PAT is expected to fall by 20% on account of higher depreciation and interest cost. We reiterate our Overweight outlook on the sector on the back of improved demand outlook, slowing pace of capacity addition and exit of weak players. UltraTech cement remains our top pick in the large cap space, given its play on sizeable and efficient operations. In mid‐caps, we continue to like JK Lakshmi cement on the back of its attractive valuations, efficient operations and play on large capacity base.
- 3. April 10, 2015 73 Jan‐Mar 2015 Earnings Preview Stock Performance 1M 3M 6M 12M 1M 3M 6M 12M ACC (0.9) 17.0 16.6 17.8 (1.4) 11.8 6.8 (9.4) Ambuja Cement (0.5) 15.4 22.2 21.6 (1.1) 10.2 12.3 (5.5) JK Lakshmi Cement (3.6) (4.7) 6.6 203.2 (4.2) (9.9) (3.2) 176.0 Shree Cement (1.9) 17.6 29.7 92.5 (2.5) 12.4 19.9 65.4 The Ramco Cements (0.8) 1.3 4.8 51.7 (1.4) (3.9) (5.0) 24.6 Ultratech Cement (1.6) 8.8 19.7 32.2 (2.2) 3.6 9.8 5.1 Absolute Relative to Sensex Source: Bloomberg, PL Research Summary Financials ‐ Quarterly (Rs m) Companies Q4FY15E Q4FY14 YoY gr. (%) Q3FY15 QoQ gr. (%) 12MFY15E 12MFY14 YoY gr. (%) Sales 29,692 29,671 0.1 27,623 7.5 128,947 114,803 12.3 EBITDA 3,330 3,653 (8.9) 1,823 82.7 16,902 12,548 34.7 Margins (%) 11.2 12.3 (110)bps 6.6 461 bps 13.1 10.9 218 bps PAT 2,129 2,501 (14.9) 1,076 97.9 10,586 8,068 31.2 Sales 25,072 26,398 (5.0) 23,790 5.4 110,248 99,107 11.2 EBITDA 4,965 5,776 (14.0) 3,324 49.4 23,908 18,610 28.5 Margins (%) 19.8 21.9 (208)bps 14.0 583 bps 21.7 18.8 291 bps PAT 3,281 4,075 (19.5) 3,198 2.6 110,248 99,107 11.2 Sales 6,126 6,482 (5.5) 5,559 10.2 24,295 20,566 18.1 EBITDA 850 1,121 (24.1) 754 12.8 3,896 3,020 29.0 Margins (%) 13.9 17.3 (341)bps 13.6 32 bps 16.0 14.7 135 bps PAT 467 696 (32.9) 285 64.0 1,822 1,073 69.9 Sales 16,198 16,600 (2.4) 15,419 5.1 44,092 45,822 (3.8) EBITDA 3,308 4,261 (22.4) 3,035 9.0 8,837 10,331 (14.5) Margins (%) 20.4 25.7 (525)bps 19.7 74 bps 20.0 22.5 (250)bps PAT 1,091 2,284 (52.2) 945 15.4 3,768 4,626 (18.5) Sales 10,107 9,244 9.3 7,861 28.6 36,178 36,321 (0.4) EBITDA 2,152 682 215.5 1,001 115.0 6,264 5,117 22.4 Margins (%) 21.3 7.4 1,391 bps 12.7 856 bps 17.3 14.1 323 bps PAT 1,105 20 5,426.5 230 381.4 2,436 1,001 143.4 Sales 61,839 58,319 6.0 54,898 12.6 246,972 214,437 15.2 EBITDA 11,521 11,430 0.8 8,457 36.2 42,352 38,264 10.7 Margins (%) 18.6 19.6 (97)bps 15.4 323 bps 17.1 17.8 (70)bps PAT 6,531 7,424 (12.0) 3,644 79.2 22,440 21,105 6.3 Ultratech Cement ACC Ambuja Cement Shree Cement JK Lakshmi Cement The Ramco Cements Source: Company Data, PL Research ACC & Ambuja Cement ‐ Y/e Dec; Shree Cement ‐ Y/e Jun
- 4. April 10, 2015 74 Jan‐Mar 2015 Earnings Preview Consolidated Sectoral Data Quarterly Table (Rs m) Jan‐Mar'15 Jan‐Mar'14 YoY gr. (%) Oct‐Dec'14 QoQ gr. (%) Net Sales 132,801 130,988 1.4 121,729 9.1 EBITDA 23,124 25,121 (8.0) 16,638 39.0 Margin (%) 17.4 19.2 (177)bps 13.7 374 bps PAT (Excl. Ex Items) 13,032 16,284 (20.0) 8,862 47.1 Note: Revenue, EBITDA and PAT numbers are arrived by totaling corresponding numbers of all companies under our coverage in this sector. Net revenue is expected to be flat YoY as a 6.7% or Rs292/t YoY rise in realizations and 15% growth in RMC revenue is negated by 7.0% fall in volumes. On QoQ basis, realizations are expected to rise by 3.2%/Rs145 per tonne. Cost/t is expected to increase by 8.9%/Rs359/t YoY due to higher freight and raw material cost (due to outsourcing of clinker). Hence, EBITDA/t is expected to fall by 2.0% YoY to Rs553. PAT is likely to fall by 14.9% YoY to Rs2.1bn. Quarterly Table (Rs m) Y/e Dec Q1 CY15E Q1 CY14 YoY gr. (%) Q4 CY14 12M CY15E 12M CY14 YoY gr. (%) Net Sales 29,692 29,671 0.1 27,623 128,947 114,803 12.3 EBITDA 3,330 3,653 (8.9) 1,823 16,902 12,548 34.7 Margin (%) 11.2 12.3 (110)bps 6.6 13.1 10.9 218 bps Reported PAT 2,129 3,999 (46.8) 3,129 10,586 11,618 (8.9) PAT (Excl. Ex Items) 2,129 2,501 (14.9) 1,076 10,586 8,068 31.2 Operating Metrics Volume (mn te) 6.0 6.5 (7.0) 5.8 25.4 24.2 5.0 Net Real. (Rs/te) 4,642 4,350 6.7 4,497 4,784 4,742 0.9 EBITDA (Rs/ te) 553 564 (2.0) 316 665 518 28.3 Key Figures (Rs m) 2015E 2016E 2017E Net Sales 529,987 616,487 720,909 Growth (%) 12.1 16.3 16.9 EBITDA 88,755 119,930 152,250 Margin (%) 16.7 19.5 21.1 PAT 49,603 69,034 93,999 Growth (%) 2.9 39.2 36.2 PE (x) 38.3 27.5 20.2 ACC Rating BUY Price (Rs) 1,636 Target Price (Rs) 1,690 M/Cap (Rs bn) 307.5 Shares o/s (m) 188.0 Key Figures (Rs m) Y/e Dec CY14E CY15E CY16E Net Sales 114,803 128,947 149,563 EBITDA 12,548 16,902 23,203 Margin (%) 10.9 13.1 15.5 PAT 8,068 10,586 14,652 EPS (Rs) 42.9 56.3 78.0 Growth (%) (10.4) 31.2 38.4 RoE (%) 10.1 12.5 16.3 PE (x) 38.1 29.0 21.0 P / BV (x) 3.7 3.6 3.3 EV / E (x) 23.2 17.3 12.1
- 5. Jan‐Mar 2015 Earnings Preview April 10, 2015 134 Prabhudas Lilladher Pvt. Ltd. 3rd Floor, Sadhana House, 570, P. B. Marg, Worli, Mumbai‐400 018, India Tel: (91 22) 6632 2222 Fax: (91 22) 6632 2209 Rating Distribution of Research Coverage PL’s Recommendation Nomenclature 44.6% 39.1% 16.3% 0.0% 0% 10% 20% 30% 40% 50% BUY Accumulate Reduce Sell % of Total Coverage BUY : Over 15% Outperformance to Sensex over 12‐months Accumulate : Outperformance to Sensex over 12‐months Reduce : Underperformance to Sensex over 12‐months Sell : Over 15% underperformance to Sensex over 12‐months Trading Buy : Over 10% absolute upside in 1‐month Trading Sell : Over 10% absolute decline in 1‐month Not Rated (NR) : No specific call on the stock Under Review (UR) : Rating likely to change shortly DISCLAIMER/DISCLOSURES ANALYST CERTIFICATION We/I, Mr. R Sreesankar (B.Sc), Research Analysts, authors and the names subscribed to this report, hereby certify that all of the views expressed in this research report accurately reflect our views about the subject issuer(s) or securities. We also certify that no part of our compensation was, is, or will be directly or indirectly related to the specific recommendation(s) or view(s) in this report. Terms & conditions and other disclosures: Prabhudas Lilladher Pvt. Ltd, Mumbai, India (hereinafter referred to as “PL”) is engaged in the business of Stock Broking, Portfolio Manager, Depository Participant and distribution for third party financial products. PL is a subsidiary of Prabhudas Lilladher Advisory Services Pvt Ltd. which has its various subsidiaries engaged in business of commodity broking, investment banking, financial services (margin funding) and distribution of third party financial/other products, details in respect of which are available at www.plindia.com This document has been prepared by the Research Division of PL and is meant for use by the recipient only as information and is not for circulation. This document is not to be reported or copied or made available to others without prior permission of PL. It should not be considered or taken as an offer to sell or a solicitation to buy or sell any security. The information contained in this report has been obtained from sources that are considered to be reliable. However, PL has not independently verified the accuracy or completeness of the same. Neither PL nor any of its affiliates, its directors or its employees accepts any responsibility of whatsoever nature for the information, statements and opinion given, made available or expressed herein or for any omission therein. Recipients of this report should be aware that past performance is not necessarily a guide to future performance and value of investments can go down as well. The suitability or otherwise of any investments will depend upon the recipient's particular circumstances and, in case of doubt, advice should be sought from an independent expert/advisor. Either PL or its affiliates or its directors or its employees or its representatives or its clients or their relatives may have position(s), make market, act as principal or engage in transactions of securities of companies referred to in this report and they may have used the research material prior to publication. PL may from time to time solicit or perform investment banking or other services for any company mentioned in this document. PL is in the process of applying for certificate of registration as Research Analyst under Securities and Exchange Board of India (Research Analysts) Regulations, 2014 PL submits that no material disciplinary action has been taken on us by any Regulatory Authority impacting Equity Research Analysis activities. PL or its research analysts or its associates or his relatives do not have any financial interest in the subject company. PL or its research analysts or its associates or his relatives do not have actual/beneficial ownership of one per cent or more securities of the subject company at the end of the month immediately preceding the date of publication of the research report. PL or its research analysts or its associates or his relatives do not have any material conflict of interest at the time of publication of the research report. PL or its associates might have received compensation from the subject company in the past twelve months. PL or its associates might have managed or co‐managed public offering of securities for the subject company in the past twelve months or mandated by the subject company for any other assignment in the past twelve months. PL or its associates might have received any compensation for investment banking or merchant banking or brokerage services from the subject company in the past twelve months. PL or its associates might have received any compensation for products or services other than investment banking or merchant banking or brokerage services from the subject company in the past twelve months PL or its associates might have received any compensation or other benefits from the subject company or third party in connection with the research report. PL encourages independence in research report preparation and strives to minimize conflict in preparation of research report. PL or its analysts did not receive any compensation or other benefits from the subject Company or third party in connection with the preparation of the research report. PL or its Research Analysts do not have any material conflict of interest at the time of publication of this report. It is confirmed that Mr. R Sreesankar (B.Sc), Research Analysts of this report have not received any compensation from the companies mentioned in the report in the preceding twelve months Compensation of our Research Analysts is not based on any specific merchant banking, investment banking or brokerage service transactions. The Research analysts for this report certifies that all of the views expressed in this report accurately reflect his or her personal views about the subject company or companies and its or their securities, and no part of his or her compensation was, is or will be, directly or indirectly related to specific recommendations or views expressed in this report. The research analysts for this report has not served as an officer, director or employee of the subject company PL or its research analysts have not engaged in market making activity for the subject company Our sales people, traders, and other professionals or affiliates may provide oral or written market commentary or trading strategies to our clients that reflect opinions that are contrary to the opinions expressed herein, and our proprietary trading and investing businesses may make investment decisions that are inconsistent with the recommendations expressed herein. In reviewing these materials, you should be aware that any or all o the foregoing, among other things, may give rise to real or potential conflicts of interest. PL and its associates, their directors and employees may (a) from time to time, have a long or short position in, and buy or sell the securities of the subject company or (b) be engaged in any other transaction involving such securities and earn brokerage or other compensation or act as a market maker in the financial instruments of the subject company or act as an advisor or lender/borrower to the subject company or may have any other potential conflict of interests with respect to any recommendation and other related information and opinions. DISCLAIMER/DISCLOSURES (FOR US CLIENTS) ANALYST CERTIFICATION The research analysts, with respect to each issuer and its securities covered by them in this research report, certify that: All of the views expressed in this research report accurately reflect his or her or their personal views about all of the issuers and their securities; and No part of his or her or their compensation was, is or will be directly related to the specific recommendation or views expressed in this research report Terms & conditions and other disclosures: This research report is a product of Prabhudas Lilladher Pvt. Ltd., which is the employer of the research analyst(s) who has prepared the research report. The research analyst(s) preparing the research report is/are resident outside the United States (U.S.) and are not associated persons of any U.S. regulated broker‐dealer and therefore the analyst(s) is/are not subject to supervision by a U.S. broker‐dealer, and is/are not required to satisfy the regulatory licensing requirements of FINRA or required to otherwise comply with U.S. rules or regulations regarding, among other things, communications with a subject company, public appearances and trading securities held by a research analyst account. This report is intended for distribution by Prabhudas Lilladher Pvt. Ltd. only to "Major Institutional Investors" as defined by Rule 15a‐6(b)(4) of the U.S. Securities and Exchange Act, 1934 (the Exchange Act) and interpretations thereof by U.S. Securities and Exchange Commission (SEC) in reliance on Rule 15a 6(a)(2). If the recipient of this report is not a Major Institutional Investor as specified above, then it should not act upon this report and return the same to the sender. Further, this report may not be copied, duplicated and/or transmitted onward to any U.S. person, which is not the Major Institutional Investor. In reliance on the exemption from registration provided by Rule 15a‐6 of the Exchange Act and interpretations thereof by the SEC in order to conduct certain business with Major Institutional Investors, Prabhudas Lilladher Pvt. Ltd. has entered into an agreement with a U.S. registered broker‐dealer, Marco Polo Securities Inc. ("Marco Polo"). Transactions in securities discussed in this research report should be effected through Marco Polo or another U.S. registered broker dealer.