SlideShare una empresa de Scribd logo
1 de 53
Your	
  data	
  is	
  telling	
  you	
  something.	


                                              $1B	


                     Who	
  cares?	


                                                             SkillShare:	
  Think	
  Like	
  a	
  PM,	
  Kenton	
  Kivestu	
  
Listen	
  to	
  it.	


                                                                            $1B	
  

         Kevin	
  Systrom	
  realizes	
  customers	
  only	
  use	
  
         their	
  product	
  for	
  one	
  thing:	
  photos.	
  Burbn	
  
                      dies,	
  Instagram	
  is	
  born.	


                                 Who	
  cares?	


                                                                                      SkillShare:	
  Think	
  Like	
  a	
  PM,	
  Kenton	
  Kivestu	
  
Agenda	
  

 •  Background	
  

 •  IdenEfying	
  opportuniEes	
  

 •  Using	
  metrics	
  to	
  prioriEze	
  

 •  TesEng	
  hypothesis	
  with	
  experiments	
  

 •  Running	
  “post-­‐mortem”	
  analysis	
  

                                                      SkillShare:	
  Think	
  Like	
  a	
  PM,	
  Kenton	
  Kivestu	
  
Goals	
  of	
  “Think	
  Like	
  a	
  PM”	
  

  •  Introduce	
  the	
  idea	
  of	
  data	
  driven	
  PM’ing	
  
       –  Focus	
  on	
  an	
  example	
  using	
  user	
  data	
  

  •  Review	
  the	
  “end-­‐to-­‐end”	
  process	
  of	
  a	
  data	
  
     driven	
  feature	
  
       –  Use	
  Foursquare	
  as	
  an	
  illustraEve	
  example	
  

  •  Provide	
  you	
  with	
  another	
  tool	
  for	
  approaching	
  
       product	
  development	


                                                                      SkillShare:	
  Think	
  Like	
  a	
  PM,	
  Kenton	
  Kivestu	
  
How	
  do	
  PMs	
  decide	
  what	
  features	
  to	
  build?	
  

  •    Data	
  
  •    Talking	
  to	
  customers	
  
  •    Vision	
  about	
  the	
  future	
  of	
  the	
  product	
  
  •    Beliefs	
  	
  
  •    Wild-­‐ass	
  guesses	
  
  •    Looking	
  at	
  the	
  compeEEon	
  
  •    DirecEon	
  from	
  managers	
  /	
  execs	
  
  •    They	
  don’t	
  (indecision	
  strikes!)	
  
                                                             SkillShare:	
  Think	
  Like	
  a	
  PM,	
  Kenton	
  Kivestu	
  
What	
  types	
  of	
  data	
  do	
  PMs	
  focus	
  on?	
  

  •  Market	
  data	
  
     –  “CompeEtors	
  that	
  have	
  focused	
  on	
  Z	
  approach	
  have	
  out-­‐
        performed	
  and	
  we	
  should	
  consider	
  that…”	
  

  •  Anecdotal	
  data	
  	
  
      –  Eg,	
  “When	
  we	
  talk	
  to	
  customers,	
  they	
  always	
  complain	
  
         about	
  Y	
  taking	
  too	
  long…”	
  

  •  User	
  data	
  
      –  We	
  know	
  25%	
  of	
  users	
  take	
  X	
  acEon	
  in	
  the	
  game…”	
  
      –  Some	
  famous	
  examples:	
  Instagram’s	
  pivot,	
  Facebook’s	
  
         localizaEon	
  efforts,	
  Zynga’s	
  dominance	
  of	
  FB	
  channels	
  
                                                                         SkillShare:	
  Think	
  Like	
  a	
  PM,	
  Kenton	
  Kivestu	
  
Agenda	
  

 •  Background	
  

 •  Iden4fying	
  opportuni4es	
  

 •  Using	
  metrics	
  to	
  prioriEze	
  

 •  TesEng	
  hypothesis	
  with	
  experiments	
  

 •  Running	
  “post-­‐mortem”	
  analysis	
  

                                                      SkillShare:	
  Think	
  Like	
  a	
  PM,	
  Kenton	
  Kivestu	
  
Why	
  study	
  Foursquare?	
  

  •  Everyone	
  can	
  use	
  it	
  (it’s	
  free)	
  

  •  People	
  are	
  familiar	
  with	
  it	
  (25M	
  users)	
  

  •  It’s	
  an	
  evolving	
  product	
  –	
  you	
  can	
  observe	
  the	
  
     Foursquare	
  team	
  making	
  changes	
  to	
  the	
  product	
  

  •  Clear	
  defined	
  user	
  flows	
  &	
  acEons	
  to	
  study	
  

                                                                SkillShare:	
  Think	
  Like	
  a	
  PM,	
  Kenton	
  Kivestu	
  
Foursquare	
  top	
  level	
  metrics:	
  the	
  “Vanity”	
  
    metrics	
  
             •  2B	
  “check-­‐ins”	
  

             •  25M	
  registered	
  users	
  

             •  7.2M+	
  daily	
  acEve	
  users	
  (DAU)	
  

             •  20%	
  of	
  searches	
  result	
  in	
  a	
  check-­‐in	
  

                                                                                                                         SkillShare:	
  Think	
  Like	
  a	
  PM,	
  Kenton	
  Kivestu	
  
NOTE:	
  Stats	
  from	
  TechCrunch,	
  “Foursquare	
  looks	
  into	
  a	
  4th	
  round”,	
  Nov.	
  2,	
  2012	
  
Two	
  things	
  to	
  remember	
  when	
  working	
  with	
  
    data	


                                                                                                                         What	
  is	
  this?	


                                                                                                                                      SkillShare:	
  Think	
  Like	
  a	
  PM,	
  Kenton	
  Kivestu	
  
NOTE:	
  Stats	
  from	
  TechCrunch,	
  “Foursquare	
  looks	
  into	
  a	
  4th	
  round”,	
  Nov.	
  2,	
  2012	
  
Start	
  with	
  the	
  full	
  picture,	
  peel	
  back	
  layers	
  of	
  
the	
  onion	
  

 Zoom	
  out	
  so	
  you	
  can	
  	
                                And	
  then	
  you	
  can	
  work	
  on	
  	
  
 see	
  the	
  whole	
  picture…	
                                    peeling	
  back	
  the	
  layers…	


                                           It’s	
  a	
  bridge!	


                                                                                       SkillShare:	
  Think	
  Like	
  a	
  PM,	
  Kenton	
  Kivestu	
  
Key	
  steps	
  to	
  idenEfying	
  opportuniEes	
  

  1)  Define	
  a	
  clear,	
  measurable	
  goal	
  
      –  Eg,	
  “We	
  want	
  to	
  increase	
  Foursquare	
  check-­‐ins	
  /	
  day”	
  

  2)  Define	
  the	
  relevant	
  data	
  set	
  
      –  Eg	
  “What	
  drives	
  daily	
  check-­‐ins?”	
  

  3)  Determine	
  the	
  status	
  quo	
  
      –  Eg,	
  “What	
  does	
  the	
  current	
  data	
  show	
  about	
  daily	
  check-­‐
         ins?”	
  

  4)  IdenEfy	
  opportuniEes	
  to	
  improve	
  the	
  goal	
  
      –  Eg,	
  “What	
  are	
  the	
  inflecEon	
  points?”	
  
                                                                         SkillShare:	
  Think	
  Like	
  a	
  PM,	
  Kenton	
  Kivestu	
  
Defining	
  a	
  clear,	
  measurable	
  goal	
  

                                       Foursquare	
  derives	
  value	
  from	
  
                                       loca4on	
  data	
  
                                       •  Check-­‐ins	
  are	
  a	
  criEcal	
  piece	
  
                                          (eg	
  build	
  the	
  database	
  of	
  
                                          locaEon	
  data)	
  
                                       •  They	
  have	
  viral	
  value	
  (eg	
  
                                          “Kenton	
  checked	
  in	
  here…)	
  
                                       •  Check-­‐in	
  rates	
  indicate	
  the	
  
                                          health	
  of	
  the	
  app	
  /	
  user	
  
                                          base	
  (eg,	
  Check-­‐ins	
  /	
  day	
  is	
  a	
  
                                          good	
  indicator	
  of	
  user	
  
                                          acEvity)	
  
                                       •  Result:	
  Check-­‐ins	
  could	
  be	
  a	
  
                                          great	
  piece	
  of	
  data	
  to	
  
                                          understand	
  beCer	
  
                                                                SkillShare:	
  Think	
  Like	
  a	
  PM,	
  Kenton	
  Kivestu	
  
Key	
  steps	
  to	
  idenEfying	
  opportuniEes	
  

  1)  Define	
  a	
  clear,	
  measurable	
  goal	
  
      –  Eg,	
  “We	
  want	
  to	
  increase	
  Foursquare	
  check-­‐ins	
  /	
  day”	
  

  2)  Define	
  the	
  relevant	
  data	
  set	
  
      –  Eg	
  “What	
  drives	
  daily	
  check-­‐ins?”	
  

  3)  Determine	
  the	
  status	
  quo	
  
      –  Eg,	
  “What	
  does	
  the	
  current	
  data	
  show	
  about	
  daily	
  check-­‐
         ins?”	
  

  4)  IdenEfy	
  opportuniEes	
  to	
  improve	
  the	
  goal	
  
      –  Eg,	
  “What	
  are	
  the	
  inflecEon	
  points?”	
  
                                                                         SkillShare:	
  Think	
  Like	
  a	
  PM,	
  Kenton	
  Kivestu	
  
What’s	
  the	
  anatomy	
  of	
  a	
  check-­‐in?	


iPhone	
  home	
  screen	
     Foursquare	
  home	
                 Loca4on	
  picker	
                          Check	
  in	
  details	
  
•  How	
  many	
               •  How	
  many	
  users	
            •  How	
  many	
  users	
                    •  How	
  many	
  users	
  
   users?	
                       reach	
  it	
  daily?	
              reach	
  it	
  daily?	
                      reach	
  it	
  daily?	
  
•  How	
  many	
               •  How	
  many	
                     •  How	
  many	
                             •  How	
  many	
  share	
  on	
  
   decide	
  to	
  login	
        decide	
  to	
  click	
  to	
        decide	
  to	
  select	
                     social	
  media?	
  On	
  
   on	
  any	
  given	
           iniEate	
  a	
  check	
              an	
  actual	
                               twiper?	
  On	
  
   day?	
                         in?	
                                locaEon?	
                                   facebook?	
  
                                                                                                                 •  How	
  many	
  include	
  a	
  
                                                                                                                    photo?	
  
                                                                                                    SkillShare:	
  Think	
  Like	
  a	
  PM,	
  Kenton	
  Kivestu	
  
Key	
  steps	
  to	
  idenEfying	
  opportuniEes	
  

  1)  Define	
  a	
  clear,	
  measurable	
  goal	
  
      –  Eg,	
  “We	
  want	
  to	
  increase	
  Foursquare	
  check-­‐ins	
  /	
  day”	
  

  2)  Define	
  the	
  relevant	
  data	
  set	
  
      –  Eg	
  “What	
  drives	
  daily	
  check-­‐ins?”	
  

  3)  Determine	
  the	
  status	
  quo	
  
      –  Eg,	
  “What	
  does	
  the	
  current	
  data	
  show	
  about	
  daily	
  check-­‐
         ins?”	
  

  4)  IdenEfy	
  opportuniEes	
  to	
  improve	
  the	
  goal	
  
      –  Eg,	
  “What	
  are	
  the	
  inflecEon	
  points?”	
  
                                                                         SkillShare:	
  Think	
  Like	
  a	
  PM,	
  Kenton	
  Kivestu	
  
Foursquare	
  data:	
  the	
  top	
  level	
  funnel	
  of	
  user	
  
    acEvity	
  
      Funnel	
  Step	
                                                                            Users	
  hiGng	
  that	
  step	
                                                            %	
  proceeding	
  from	
  previous	
  

      Total	
  registered	
  users	
                                                                                        25,000,000	
  

      Daily	
  acEve	
  users	
                                                                                               7,200,000	
                                                                                       28.8%	
  

      Click	
  “Check-­‐in”	
                                                                                                 1,800,000	
                                                                                          25%	
  

      Select	
  locaEon	
                                                                                                        900,000	
                                                                                         50%	
  

      Complete	
  check-­‐in	
                                                                                                   630,000	
                                                                                         70%	
  

      Social	
  Media	
  sharing	
                                                                                               189,000	
                                                                                         30%	
  

      Share	
  photo	
                                                                                                           126,000	
                                                                                         20%	
  

      No	
  meta	
  data	
                                                                                                       315,000	
                                                                                         50%	
  

                                                                                                                                                                                                                SkillShare:	
  Think	
  Like	
  a	
  PM,	
  Kenton	
  Kivestu	
  
NOTE:	
  Total	
  registered	
  users,	
  DAU	
  stats	
  from	
  TechCrunch,	
  “Foursquare	
  looks	
  into	
  a	
  4th	
  round”,	
  Nov.	
  2,	
  2012.	
  All	
  other	
  numbers	
  are	
  SWAG	
  at	
  Foursquare	
  core	
  funnel	
  
Key	
  steps	
  to	
  idenEfying	
  opportuniEes	
  

  1)  Define	
  a	
  clear,	
  measurable	
  goal	
  
      –  Eg,	
  “We	
  want	
  to	
  increase	
  Foursquare	
  check-­‐ins	
  /	
  day”	
  

  2)  Define	
  the	
  relevant	
  data	
  set	
  
      –  Eg	
  “What	
  drives	
  daily	
  check-­‐ins?”	
  

  3)  Determine	
  the	
  status	
  quo	
  
      –  Eg,	
  “What	
  does	
  the	
  current	
  data	
  show	
  about	
  daily	
  check-­‐
         ins?”	
  

  4)  IdenEfy	
  opportuniEes	
  to	
  improve	
  the	
  goal	
  
      –  Eg,	
  “What	
  are	
  the	
  inflecEon	
  points?”	
  
                                                                         SkillShare:	
  Think	
  Like	
  a	
  PM,	
  Kenton	
  Kivestu	
  
IdenEfy	
  opportuniEes	
  by	
  understanding	
  what	
  
the	
  data	
  suggests	
  about	
  user	
  behavior	
  
  •  QuesEons	
  to	
  consider:	
  
     –  What’s	
  going	
  on	
  at	
  the	
  top	
  of	
  the	
  funnel?	
  
     –  At	
  the	
  bopom	
  of	
  the	
  funnel?	
  
     –  Which	
  acEons	
  are	
  we	
  most	
  concerned	
  with?	
  
     –  Where	
  do	
  we	
  “lose”	
  the	
  most	
  users?	
  
     –  What’s	
  working	
  well?	
  Why?	


                                                                 SkillShare:	
  Think	
  Like	
  a	
  PM,	
  Kenton	
  Kivestu	
  
Opportunity	
  #1:	
  Increase	
  daily	
  logins	
  

      Funnel	
  Step	
                                                                            Users	
  hiGng	
  that	
  step	
                                                            %	
  proceeding	
  from	
  previous	
  

      Total	
  registered	
  users	
                                                                                        25,000,000	
  

      Daily	
  acEve	
  users	
                                                                                               7,200,000	
                                                                                       28.8%	
  

      Click	
  “Check-­‐in”	
                                                                                                 1,800,000	
                                                                                          25%	
  
                                                                                  1	
  
      Select	
  locaEon	
                                                                                                        900,000	
                                                                                         50%	
  
                                                                                           Only	
  ~29%	
  of	
  the	
  user	
  base	
  logs	
  into	
  the	
  app	
  each	
  
      Complete	
  check-­‐in	
                                                                                   630,000	
  
                                                                                            day.	
  One	
  opportunity	
  would	
  be	
  to	
  apract	
  more	
        70%	
  
                                                                                           users	
  to	
  the	
  app	
  each	
  day.	
  This	
  would	
  “widen	
  the	
  
      Social	
  Media	
  sharing	
                                                                               189,000	
  f	
  the	
  funnel”	
  
                                                                                                                    top	
  o                                           30%	
  

      Share	
  photo	
                                                                                                           126,000	
                                                                                         20%	
  

      No	
  meta	
  data	
                                                                                                       315,000	
                                                                                         50%	
  

                                                                                                                                                                                                                SkillShare:	
  Think	
  Like	
  a	
  PM,	
  Kenton	
  Kivestu	
  
NOTE:	
  Total	
  registered	
  users,	
  DAU	
  stats	
  from	
  TechCrunch,	
  “Foursquare	
  looks	
  into	
  a	
  4th	
  round”,	
  Nov.	
  2,	
  2012.	
  All	
  other	
  numbers	
  are	
  SWAG	
  at	
  Foursquare	
  core	
  funnel	
  
Opportunity	
  #2:	
  Increase	
  the	
  daily	
  check-­‐ins	
  

      Funnel	
  Step	
                                                                            Users	
  hiGng	
  that	
  step	
                                                            %	
  proceeding	
  from	
  previous	
  

      Total	
  registered	
  users	
                                                                                        25,000,000	
  

      Daily	
  acEve	
  users	
                                                                                               7,200,000	
                                                                                       28.8%	
  

      Click	
  “Check-­‐in”	
                                                                                                 1,800,000	
                                                                                          25%	
  

      Select	
  locaEon	
                                                                                                        900,000	
                                                                                         50%	
  
                                                                                  2	
  
      Complete	
  check-­‐in	
                                                                                                   630,000	
                                                                                         70%	
  
                                                                                           Only	
  ~25%	
  of	
  the	
  user	
  base	
  starts	
  the	
  “check-­‐in”	
  
      Social	
  Media	
  sharing	
                                                        process	
  each	
  189,000	
   is	
  opportunity	
  to	
  increase	
  
                                                                                                             day.	
  There	
                                     30%	
  
                                                                                           the	
  number	
  of	
  “check-­‐ins”	
  simply	
  by	
  gewng	
  the	
  
      Share	
  photo	
                                                                                      126,000	
                                            20%	
  
                                                                                                      apenEon	
  of	
  our	
  logged	
  in	
  users	
  
      No	
  meta	
  data	
                                                                                                       315,000	
                                                                                         50%	
  

                                                                                                                                                                                                                SkillShare:	
  Think	
  Like	
  a	
  PM,	
  Kenton	
  Kivestu	
  
NOTE:	
  Total	
  registered	
  users,	
  DAU	
  stats	
  from	
  TechCrunch,	
  “Foursquare	
  looks	
  into	
  a	
  4th	
  round”,	
  Nov.	
  2,	
  2012.	
  All	
  other	
  numbers	
  are	
  SWAG	
  at	
  Foursquare	
  core	
  funnel	
  
Opportunity	
  #3:	
  Increase	
  the	
  %	
  of	
  users	
  
    selecEng	
  locaEon	
  
      Funnel	
  Step	
                                                                            Users	
  hiGng	
  that	
  step	
                                                            %	
  proceeding	
  from	
  previous	
  

      Total	
  registered	
  users	
                                                                                        25,000,000	
  

      Daily	
  acEve	
  users	
                                                                                               7,200,000	
                                                                                       28.8%	
  

      Click	
  “Check-­‐in”	
                                                                                                 1,800,000	
                                                                                          25%	
  

      Select	
  locaEon	
                                                                                                        900,000	
                                                                                         50%	
  

      Complete	
  check-­‐in	
                                                                                                   630,000	
                                                                                         70%	
  
                                                                                  3	
  
      Social	
  Media	
  sharing	
                                                                                               189,000	
                                                                                         30%	
  
                                                                                             Only	
  ~50%	
  of	
  the	
  users	
  that	
  start	
  a	
  “check-­‐in”	
  
      Share	
  photo	
                                                                                      126,000	
                                              20%	
  
                                                                                             actually	
  select	
  their	
  locaEon.	
  There	
  is	
  room	
  to	
  
                                                                                            opEmize	
  this	
  step	
  of	
  the	
  funnel	
  and	
  minimize	
  the	
  
      No	
  meta	
  data	
                                                                                  315,000	
      drop-­‐off	
                             50%	
  

                                                                                                                                                                                                                SkillShare:	
  Think	
  Like	
  a	
  PM,	
  Kenton	
  Kivestu	
  
NOTE:	
  Total	
  registered	
  users,	
  DAU	
  stats	
  from	
  TechCrunch,	
  “Foursquare	
  looks	
  into	
  a	
  4th	
  round”,	
  Nov.	
  2,	
  2012.	
  All	
  other	
  numbers	
  are	
  SWAG	
  at	
  Foursquare	
  core	
  funnel	
  
Opportunity	
  #4:	
  Increase	
  the	
  number	
  of	
  users	
  
    compleEng	
  the	
  final	
  check-­‐in	
  step	
  
      Funnel	
  Step	
                                                                            Users	
  hiGng	
  that	
  step	
                                                            %	
  proceeding	
  from	
  previous	
  

      Total	
  registered	
  4	
  sers	
  
                             u                                                                                              25,000,000	
  

      Daily	
  acEve	
  users	
                                                                  7,200,000	
                                                                                                                    28.8%	
  
                                                                We	
  lose	
  another	
  30%	
  of	
  users	
  on	
  the	
  final	
  step	
  of	
  
      Click	
  “Check-­‐in”	
                                   the	
  “check-­‐in.”	
  Is	
  there	
  anyway	
  to	
  prevent	
  that?	
  
                                                                                                 1,800,000	
                                                                                                                       25%	
  

      Select	
  locaEon	
                                                                                                        900,000	
                                                                                         50%	
  

      Complete	
  check-­‐in	
                                                                                                   630,000	
                                                                                         70%	
  

      Social	
  Media	
  sharing	
                                                                                               189,000	
                                                                                         30%	
  

      Share	
  photo	
                                                                                                           126,000	
                                                                                         20%	
  

      No	
  meta	
  data	
                                                                                                       315,000	
                                                                                         50%	
  

                                                                                                                                                                                                                SkillShare:	
  Think	
  Like	
  a	
  PM,	
  Kenton	
  Kivestu	
  
NOTE:	
  Total	
  registered	
  users,	
  DAU	
  stats	
  from	
  TechCrunch,	
  “Foursquare	
  looks	
  into	
  a	
  4th	
  round”,	
  Nov.	
  2,	
  2012.	
  All	
  other	
  numbers	
  are	
  SWAG	
  at	
  Foursquare	
  core	
  funnel	
  
Summary:	
  4	
  key	
  steps	
  to	
  idenEfying	
  product	
  
opportuniEes	
  with	
  data	
  
  Key	
  things	
  to	
  remember:	
  
  1)  Define	
  a	
  clear,	
  measurable	
  goal:	
  “Increasing	
  
      check-­‐ins”	
  
  2)  Collect	
  the	
  relevant	
  data	
  set	
  &	
  assemble	
  it	
  
  3)  Determine	
  the	
  status	
  quo	
  
  4)  IdenEfy	
  opportuniEes	
  to	
  improve	
  the	
  goal	


                                                          SkillShare:	
  Think	
  Like	
  a	
  PM,	
  Kenton	
  Kivestu	
  
Dennis	
  says:	
  “I’ve	
  just	
  realized	
  that	
  …	
  ”	
  

                                       …	
  for	
  every	
  photo	
  that	
  gets	
  shared	
  on	
  
                                       Twiper	
  via	
  Foursquare,	
  we	
  acquire	
  2	
  
                                       new	
  users.	
  If	
  we	
  could	
  double	
  the	
  
                                       amount	
  of	
  photos	
  shared,	
  we’d	
  double	
  
                                       our	
  user	
  base.	
  How	
  many	
  more	
  photos	
  
                                       can	
  we	
  get	
  users	
  sharing	
  on	
  Twiper?”	


                                                                       SkillShare:	
  Think	
  Like	
  a	
  PM,	
  Kenton	
  Kivestu	
  
Which	
  of	
  the	
  4	
  opportuniEes	
  does	
  Dennis	
  
want	
  to	
  take	
  advantage	
  of?	


                                        Eeeny	
  …	
  meeny	
  …	
  miny	
  …	
  moe	
  ….	


                                                                 SkillShare:	
  Think	
  Like	
  a	
  PM,	
  Kenton	
  Kivestu	
  
Opportunity	
  #5:	
  Increase	
  the	
  top	
  of	
  the	
  
    funnel	
  by	
  increasing	
  the	
  bopom!	
  
      Funnel	
  Step	
                                                                            Users	
  hiGng	
  that	
  step	
                                                            %	
  proceeding	
  from	
  previous	
  

      Total	
  registered	
  users	
                                                                                        25,000,000	
  

      Daily	
  acEve	
  users	
                                                                                               7,200,000	
                                                                                       28.8%	
  

      Click	
  “Check-­‐in”	
                                                                                           5	
   1,800,000	
                                                                                          25%	
  

      Select	
  locaEon	
                                                                                                     900,000	
                                              50%	
  
                                                                                                                             Dennis’	
  insight:	
  If	
  we	
  increase	
  those	
  sharing	
  photos,	
  
                                                                                                                              We	
  lose	
  another	
  30%	
  of	
  users	
  on	
  the	
  final	
  step	
  of	
  
                                                                                                                             we	
  will	
  get	
  more	
  users	
  which	
  will	
  increase	
  the	
  top	
  of	
  
      Complete	
  check-­‐in	
                                                                                                 the	
  “check-­‐in.”	
  Is	
  there	
  anyway	
  t70%	
  
                                                                                                                              630,000	
                                              o	
  prevent	
  that?	
  
                                                                                                                                                              the	
  funnel	
  

      Social	
  Media	
  sharing	
                                                                                               189,000	
                                                                                         30%	
  

      Share	
  photo	
                                                                                                           126,000	
                                                                                         20%	
  

      No	
  meta	
  data	
                                                                                                       315,000	
                                                                                         50%	
  

                                                                                                                                                                                                                SkillShare:	
  Think	
  Like	
  a	
  PM,	
  Kenton	
  Kivestu	
  
NOTE:	
  Total	
  registered	
  users,	
  DAU	
  stats	
  from	
  TechCrunch,	
  “Foursquare	
  looks	
  into	
  a	
  4th	
  round”,	
  Nov.	
  2,	
  2012.	
  All	
  other	
  numbers	
  are	
  SWAG	
  at	
  Foursquare	
  core	
  funnel	
  
Agenda	
  

 •  Background	
  

 •  IdenEfying	
  opportuniEes	
  

 •  Using	
  metrics	
  to	
  priori4ze	
  

 •  TesEng	
  hypothesis	
  with	
  experiments	
  

 •  Running	
  “post-­‐mortem”	
  analysis	
  

                                                      SkillShare:	
  Think	
  Like	
  a	
  PM,	
  Kenton	
  Kivestu	
  
Given	
  Dennis’	
  goals	
  of	
  increasing	
  photo	
  shares,	
  
we	
  need	
  to	
  beper	
  understand	
  that	
  data	
  

  •  QuesEons	
  to	
  consider	
  
      –  What	
  does	
  the	
  photo	
  sharing	
  funnel	
  look	
  like?	
  
      –  What	
  drives	
  photo	
  sharing?	
  
      –  How	
  do	
  photos	
  get	
  shared	
  today?	
  
      –  How	
  can	
  we	
  encourage/discourage	
  that	
  behavior	
  
         to	
  achieve	
  our	
  goals?	


                                                             SkillShare:	
  Think	
  Like	
  a	
  PM,	
  Kenton	
  Kivestu	
  
Zoom	
  in	
  on	
  the	
  social	
  media	
  and	
  photo	
  
sharing	
  aspect	
  of	
  the	
  funnel	
  
Funnel	
  Step	
                            Users	
  hiGng	
  that	
  step	
     %	
  proceeding	
  from	
  previous	
  

Compete	
  check-­‐ins	
                                   630,000	
  

Social	
  media	
  shared	
                                189,000	
                                      30%	
  

Shared	
  to	
  Twiper	
                                    37,800	
                                      20%	
  

Shared	
  to	
  Twiper	
  w/	
  photo	
                     34,020	
                                      90%	
  

Shared	
  to	
  FB	
                                       151,200	
                                      80%	
  

Shared	
  to	
  FB	
  w/	
  photo	
                         15,120	
                                      10%	
  

                                                                                         SkillShare:	
  Think	
  Like	
  a	
  PM,	
  Kenton	
  Kivestu	
  
#1:	
  Increase	
  the	
  %	
  of	
  users	
  who	
  share	
  a	
  
photo	
  ayer	
  they’ve	
  decided	
  to	
  tweet	
  
Funnel	
  Step	
                                 Users	
  hiGng	
  that	
  step	
                 %	
  proceeding	
  from	
  previous	
  

Compete	
  check-­‐ins	
  
                   1	
                                            630,000	
  

                            If	
  we	
  increase	
  the	
  %	
  of	
  users	
  who	
  share	
  a	
  photo	
  
Social	
  media	
  shared	
   when	
  they	
  tweet,	
  w189,000	
   that	
  do	
  to	
  our	
  
                                                                 hat	
  would	
                                                  30%	
  
                                                           numbers?	
  
Shared	
  to	
  Twiper	
                                         37,800	
                                                        20%	
  

Shared	
  to	
  Twiper	
  w/	
  photo	
                            34,020	
                                                      90%	
  

Shared	
  to	
  FB	
                                              151,200	
                                                      80%	
  

Shared	
  to	
  FB	
  w/	
  photo	
                                15,120	
                                                      10%	
  

                                                                                                                SkillShare:	
  Think	
  Like	
  a	
  PM,	
  Kenton	
  Kivestu	
  
By	
  increasing	
  Twiper	
  sharing,	
  gain	
  10%+	
  
photo	
  shares	
  
Funnel	
  Step	
                            Users	
  hiGng	
  that	
  step	
     %	
  proceeding	
  from	
  previous	
  

Compete	
  check-­‐ins	
                                   630,000	
  

Social	
  media	
  shared	
                                189,000	
                                      30%	
  

Shared	
  to	
  Twiper	
                                    37,800	
                                      20%	
  

Shared	
  to	
  Twiper	
  w/	
  photo	
               37,800	
  (+10%)	
                                100%	
  

Shared	
  to	
  FB	
                                       151,200	
                                      80%	
  

Shared	
  to	
  FB	
  w/	
  photo	
                         15,120	
                                      10%	
  

                                                                                         SkillShare:	
  Think	
  Like	
  a	
  PM,	
  Kenton	
  Kivestu	
  
#2:	
  Increase	
  the	
  %	
  of	
  people	
  sharing	
  via	
  social	
  
media	
  channels	
  
Funnel	
  Step	
                                  Users	
  hiGng	
  that	
  step	
                 %	
  proceeding	
  from	
  previous	
  

Compete	
  check-­‐ins	
                                           630,000	
  

Social	
  media	
  shared	
                                        189,000	
                                                  30%	
  

Shared	
  to	
  Twiper	
                                            37,800	
                                                  20%	
  

                          2	
  
Shared	
  to	
  Twiper	
  w/	
  photo	
                                                                                       90%	
  
                                        What	
  happens	
  if	
  we	
  increase	
  the	
  %	
  of	
  people	
  
Shared	
  to	
  FB	
                                             151,200	
  
                                         sharing	
  via	
  social	
  media	
  from	
  30%	
  to	
  50%?	
                     80%	
  

Shared	
  to	
  FB	
  w/	
  photo	
                                 15,120	
                                                  10%	
  

                                                                                                             SkillShare:	
  Think	
  Like	
  a	
  PM,	
  Kenton	
  Kivestu	
  
By	
  increasing	
  %	
  of	
  people	
  sharing	
  via	
  social,	
  
gain	
  66.6%+	
  more	
  photo	
  shares!	
  
Funnel	
  Step	
                            Users	
  hiGng	
  that	
  step	
     %	
  proceeding	
  from	
  previous	
  

Compete	
  check-­‐ins	
                                   630,000	
  

Social	
  media	
  shared	
                                315,000	
                                      50%	
  

Shared	
  to	
  Twiper	
                                    63,000	
                                      20%	
  

Shared	
  to	
  Twiper	
  w/	
  photo	
              56,700	
  (+66.6%)	
                                 90%	
  

Shared	
  to	
  FB	
                                       252,000	
                                      80%	
  

Shared	
  to	
  FB	
  w/	
  photo	
                         25,200	
                                      10%	
  

                                                                                         SkillShare:	
  Think	
  Like	
  a	
  PM,	
  Kenton	
  Kivestu	
  
#3:	
  Increase	
  the	
  %	
  of	
  users	
  sharing	
  via	
  Twiper	
  
vs.	
  Facebook	
  
Funnel	
  Step	
                               Users	
  hiGng	
  that	
  step	
                %	
  proceeding	
  from	
  previous	
  

Compete	
  check-­‐ins	
                                        630,000	
  

Social	
  media	
  shared	
                                     189,000	
                                                  30%	
  

Shared	
  to	
  Twiper	
                                         37,800	
                                                  20%	
  

Shared	
  to	
  Twiper	
  w/	
  photo	
                          34,020	
                                                  90%	
  

                             3	
  
Shared	
  to	
  FB	
                                            151,200	
                                                  80%	
  
                                 What	
  happens	
  if	
  we	
  increase	
  the	
  %	
  of	
  users	
  who	
  
Shared	
  to	
  FB	
  w/	
  photo	
                         15,120	
  
                                         share	
  via	
  Twiper	
  from	
  20%	
  to	
  50%?	
                             10%	
  

                                                                                                          SkillShare:	
  Think	
  Like	
  a	
  PM,	
  Kenton	
  Kivestu	
  
By	
  increasing	
  mix	
  of	
  social	
  shares	
  to	
  Twiper,	
  
gain	
  125%+	
  photo	
  –	
  holy	
  cow!!	
  
Funnel	
  Step	
                            Users	
  hiGng	
  that	
  step	
     %	
  proceeding	
  from	
  previous	
  

Compete	
  check-­‐ins	
                                   630,000	
  

Social	
  media	
  shared	
                                189,000	
                                      30%	
  

Shared	
  to	
  Twiper	
                                    94,500	
                                      50%	
  

Shared	
  to	
  Twiper	
  w/	
  photo	
              85,050	
  (+125%)	
                                  90%	
  

Shared	
  to	
  FB	
                                        94,500	
                                      50%	
  

Shared	
  to	
  FB	
  w/	
  photo	
                          9,450	
                                      10%	
  

                                                                                         SkillShare:	
  Think	
  Like	
  a	
  PM,	
  Kenton	
  Kivestu	
  
If	
  you	
  were	
  forced	
  to	
  only	
  make	
  1	
  change,	
  
which	
  would	
  it	
  be?	
  
  •  Increase	
  the	
  %	
  of	
  users	
  who	
  share	
  a	
  photo	
  when	
  TweeEng	
  their	
  
     check-­‐in	
  
      –  Expected	
  impact:	
  +10%	
  increase	
  in	
  Tweets	
  w/	
  photo	
  

  •  Increase	
  the	
  %	
  of	
  users	
  who	
  decide	
  to	
  share	
  his/her	
  check-­‐in	
  on	
  
     social	
  media	
  
      –  Expected	
  impact:	
  +66%	
  increase	
  in	
  Tweets	
  w/	
  photo	
  

  •  Increase	
  %	
  of	
  users	
  who	
  share	
  his/her	
  check-­‐in	
  on	
  Twiper	
  vs.	
  
     Facebook	
  
      –  Expected	
  impact:	
  +125%	
  increase	
  in	
  Tweets	
  w/	
  photo	


                                                                                      SkillShare:	
  Think	
  Like	
  a	
  PM,	
  Kenton	
  Kivestu	
  
How	
  could	
  you	
  increase	
  %	
  of	
  users	
  sharing	
  via	
  
Twiper	
  vs.	
  Facebook?	
  
                                  Op4ons	
  to	
  increase	
  %	
  of	
  TwiCer	
  
                                  shares	
  
                                  •  Remove	
  FB	
  as	
  an	
  opEon	
  
                                  •  Make	
  Twiper	
  “Opt-­‐out”	
  
                                  •  Provide	
  incenEve	
  to	
  “Tweet”	
  (eg,	
  
                                     “Extra	
  Foursquare	
  points”	
  
                                  •  Make	
  it	
  mandatory	
  for	
  any	
  user	
  w/	
  
                                     a	
  linked	
  Twiper	
  account	
  
                                  •  Move	
  it	
  “up”	
  in	
  the	
  funnel	
  
                                  •  Move	
  it	
  “down”	
  in	
  the	
  funnel	
  and	
  
                                     make	
  it	
  “opt-­‐out”	


                                                                    SkillShare:	
  Think	
  Like	
  a	
  PM,	
  Kenton	
  Kivestu	
  
AddiEonal	
  consideraEons	
  when	
  prioriEzing	
  

•    What	
  if	
  we	
  did	
  mul4ple	
  features	
  together?	
  
      –  Sure!	
  That	
  could	
  increase	
  the	
  expected	
  impacts	
  even	
  further	
  
      –  NOTE:	
  Must	
  be	
  careful	
  w/	
  experiment	
  design	
  here	
  so	
  results	
  aren’t	
  muddled	
  

•    What	
  is	
  the	
  maximum	
  %	
  of	
  social	
  media	
  shares	
  that	
  TwiCer	
  could	
  get?	
  
      –  Data	
  needed:	
  What	
  %	
  of	
  users	
  have	
  linked	
  Twiper	
  accounts?	
  

•    What	
  if	
  20%	
  is	
  the	
  maximum	
  share	
  percentage	
  (because	
  only	
  20%	
  of	
  users	
  have	
  
     TwiCer	
  linked)	
  
      –  You	
  need	
  to	
  apack	
  a	
  different	
  part	
  of	
  the	
  funnel	
  
      –  Build	
  a	
  feature	
  that	
  encourages	
  users	
  to	
  link	
  Twiper	
  accounts	
  

•    But	
  there	
  must	
  be	
  more!?	
  
      –  Could	
  be	
  even	
  *more*	
  aggressive	
  by	
  puwng	
  social	
  media	
  and	
  photo	
  sharing	
  higher	
  
            in	
  the	
  funnel	
  
      –  Or	
  could	
  make	
  social	
  media	
  sharing	
  “opt-­‐out”	
  vs.	
  “opt-­‐in”	
   SkillShare:	
  Think	
  Like	
  a	
  PM,	
  Kenton	
  Kivestu	
  
Agenda	
  

 •  Background	
  

 •  IdenEfying	
  opportuniEes	
  

 •  Using	
  metrics	
  to	
  prioriEze	
  

 •  Tes4ng	
  hypothesis	
  with	
  experiments	
  

 •  Running	
  “post-­‐mortem”	
  analysis	
  

                                                  SkillShare:	
  Think	
  Like	
  a	
  PM,	
  Kenton	
  Kivestu	
  
A	
  good	
  experiment	
  begins	
  with	
  a	
  clear	
  hypothesis	
  

  •  Our	
  hypothesis:	
  
      –  We	
  can	
  increase	
  the	
  %	
  of	
  users	
  sharing	
  to	
  Twiper	
  
         vs.	
  Facebook	
  to	
  50%	
  by	
  making	
  Twiper	
  “opt-­‐out”	
  
      –  This	
  will,	
  in	
  turn,	
  drive	
  the	
  number	
  of	
  Tweeted	
  
         photos	
  up	
  125%+	
  
      –  For	
  every	
  addiEonal	
  Tweeted	
  photo,	
  Foursquare	
  
         will	
  gain	
  2	
  new	
  users	
  /	
  day	


                                                                    SkillShare:	
  Think	
  Like	
  a	
  PM,	
  Kenton	
  Kivestu	
  
The	
  goal:	
  Prove	
  the	
  criEcal	
  aspects	
  of	
  our	
  
hypothesis	
  

  •  CriEcal	
  aspects:	
  
       –  Get	
  50%	
  of	
  social	
  media	
  sharers	
  to	
  use	
  Twiper	
  
       –  Drive	
  up	
  Tweeted	
  photos	
  +125%	
  
       –  Acquire	
  2	
  new	
  users	
  for	
  each	
  addiEonal	
  photo	
  

  •  To	
  prove:	
  
       –  Run	
  a	
  controlled	
  A/B	
  test	
  
       –  Setup	
  a	
  test	
  where	
  50%	
  of	
  users	
  get	
  status	
  quo	
  flow	
  
       –  The	
  other	
  50%	
  get	
  the	
  new	
  Twiper	
  “opt-­‐out”	
  flow	
  
       –  Make	
  sure	
  you	
  have	
  staEsEcally	
  significant	
  sample	
  
          sizes	
  (eg	
  here	
  were	
  using	
  50%,	
  ~300K	
  check-­‐ins)	
  
                                                                          SkillShare:	
  Think	
  Like	
  a	
  PM,	
  Kenton	
  Kivestu	
  
Agenda	
  

 •  Background	
  

 •  IdenEfying	
  opportuniEes	
  

 •  Using	
  metrics	
  to	
  prioriEze	
  

 •  TesEng	
  hypothesis	
  with	
  experiments	
  

 •  Running	
  “post-­‐mortem”	
  analysis	
  

                                                      SkillShare:	
  Think	
  Like	
  a	
  PM,	
  Kenton	
  Kivestu	
  
Key	
  steps	
  to	
  assembling	
  the	
  post-­‐mortem	
  
analysis	
  
  1)  Collect	
  &	
  assemble	
  data	
  from	
  test	
  vs.	
  control	
  
     –  Eg,	
  “What	
  is	
  the	
  core	
  data	
  from	
  the	
  experiment”	


  2)  Compare	
  test	
  results	
  vs.	
  expected	
  results	
  
     –  Eg	
  “What	
  exceeded	
  or	
  missed	
  expectaEons?”	


  3)  What	
  are	
  the	
  next	
  steps	
  
     –  Eg,	
  “Should	
  we	
  invest	
  more	
  Eme/effort?	
  If	
  so,	
  on	
  
        what?	
  What	
  will	
  be	
  the	
  impact?”	


                                                            SkillShare:	
  Think	
  Like	
  a	
  PM,	
  Kenton	
  Kivestu	
  
Test	
  shows	
  40%	
  sharing	
  on	
  Twiper,	
  resulEng	
  
    in	
  +78%	
  in	
  tweeted	
  photos	
  
      Funnel	
  Step	
                                                                Control	
  (50%	
  of	
                      Test	
  (50%	
  of	
  users)	
  
                                                                                      users)	
  
      Compete	
  check-­‐ins	
                                                                         315,000	
                               315,000	
  

      Social	
  media	
  shared	
                                                                        94,500	
        30%	
                  94,500	
                                             30%	
  

      Shared	
  to	
  Twiper	
                                                                           18,900	
        20%	
                  37,800	
                                             40%	
  

      Shared	
  to	
  Twiper	
  w/	
                                                                     17,000	
        90%	
            30,240	
  (+78%)	
                                         80%	
  
      photo	
  
      Shared	
  to	
  FB	
                                                                               75,600	
        80%	
                  56,700	
                                             60%	
  

      Shared	
  to	
  FB	
  w/	
  photo	
                                                                  7,560	
       10%	
                   5,670	
                                             10%	
  

                                                                                                                                                  SkillShare:	
  Think	
  Like	
  a	
  PM,	
  Kenton	
  Kivestu	
  
NOTE:	
  Stats	
  from	
  TechCrunch,	
  “Foursquare	
  looks	
  into	
  a	
  4th	
  round”,	
  Nov.	
  2,	
  2012	
  
Key	
  steps	
  to	
  assembling	
  the	
  post-­‐mortem	
  
analysis	
  
  1)  Collect	
  &	
  assemble	
  data	
  from	
  test	
  vs.	
  control	
  
     –  Eg,	
  “What	
  is	
  the	
  core	
  data	
  from	
  the	
  experiment”	


  2)  Compare	
  test	
  results	
  vs.	
  expected	
  results	
  
     –  Eg	
  “What	
  exceeded	
  or	
  missed	
  expectaEons?”	


  3)  What	
  are	
  the	
  next	
  steps	
  
     –  Eg,	
  “Should	
  we	
  invest	
  more	
  Eme/effort?	
  If	
  so,	
  on	
  
        what?	
  What	
  will	
  be	
  the	
  impact?”	


                                                            SkillShare:	
  Think	
  Like	
  a	
  PM,	
  Kenton	
  Kivestu	
  
How	
  does	
  this	
  compare	
  to	
  expectaEons?	
  Why	
  
did	
  this	
  happen?	
  
Funnel	
  Step	
                         Expecta4ons	
          %	
  proceeding	
     Test	
  (50%	
  of	
  users)	
        %	
  proceeding	
                    Delta	


Compete	
  check-­‐ins	
                    315,000	
                                          315,000	


Social	
  media	
  shared	
                  94,500	
                30%	
                      94,500	
                              30%	
                                  ~	


Shared	
  to	
  Twiper	
                     47,250	
                50%	
                      37,800	
                              40%	
                             -­‐10%	


Shared	
  to	
  Twiper	
  w/	
          42,525	
  (+125%)	
          90%	
                30,240	
  (+78%)	
                          80%	
                             -­‐10%	
  
photo	
  

Shared	
  to	
  FB	
                         47,250	
                50%	
                      56,700	
                              60%	
                            +10%	


Shared	
  to	
  FB	
  w/	
  photo	
           4,725	
                10%	
                       5,670	
                              10%	
                                  ~	


                                                                                                                         SkillShare:	
  Think	
  Like	
  a	
  PM,	
  Kenton	
  Kivestu	
  
Key	
  steps	
  to	
  assembling	
  the	
  post-­‐mortem	
  
analysis	
  
  1)  Collect	
  &	
  assemble	
  data	
  from	
  test	
  vs.	
  control	
  
     –  Eg,	
  “What	
  is	
  the	
  core	
  data	
  from	
  the	
  experiment”	


  2)  Compare	
  test	
  results	
  vs.	
  expected	
  results	
  
     –  Eg	
  “What	
  exceeded	
  or	
  missed	
  expectaEons?”	


  3)  What	
  are	
  take	
  aways	
  &	
  next	
  steps	
  
     –  Eg,	
  “Should	
  we	
  invest	
  more	
  Eme/effort?	
  If	
  so,	
  on	
  
        what?	
  What	
  will	
  be	
  the	
  impact?”	


                                                            SkillShare:	
  Think	
  Like	
  a	
  PM,	
  Kenton	
  Kivestu	
  
Key	
  quesEons	
  &	
  take-­‐aways	
  

Key	
  ques4on	
                             Result	
                      Why?	
                                                          Next	
  steps	


Did	
  we	
  get	
  50%	
  of	
  users	
     No.	
  We	
  got	
  40%	
     •    Maybe	
  hit	
  a	
  natural	
  limit	
  (%	
  of	
        •       Determine	
  natural	
  limit	
  
to	
  share	
  on	
  Twiper?	
                                                  users	
  w/	
  Twiper	
  accounts)	
                       •       Consider	
  encouraging	
  
                                                                                                                                                   account	
  linking	
  

Did	
  we	
  get	
  +125%	
                  No.	
  We	
  got	
  78%	
     •    Photo	
  sharing	
  %	
  dropped	
  to	
                   •       Can	
  we	
  increase	
  photo	
  
increase	
  in	
  photo	
                                                       80%	
                                                              sharing	
  %?	
  
sharing?	
                                                                 •    We	
  only	
  got	
  40%	
  sharing	
  via	
  
                                                                                Twiper	
  (vs.	
  expected	
  50%)	


What’s	
  the	
  upside	
  ley?	
            12,525	
  photo	
             •    If	
  we	
  can	
  tweak	
  to	
  hit	
  goals	
  of	
     •       What	
  %	
  of	
  that	
  upside	
  is	
  
                                             shares	
  /	
  day	
               50%	
  and	
  90%	
                                                *truly*	
  achievable	
  given	
  
                                                                                                                                                   our	
  results?	
  

Was	
  the	
  test	
  a	
  success?	
        Yes!	
                        •    Proved	
  that	
  tweaking	
  Twiper	
                     •       Evaluate	
  above	
  opEons,	
  
                                                                                opEon	
  can	
  drive	
  photo	
  shares	
                         determine	
  prioriEes	
  &	
  
                                                                                                                                                   repeat!	
  

                                                                                                                                                SkillShare:	
  Think	
  Like	
  a	
  PM,	
  Kenton	
  Kivestu	
  
Conclusions	
  

 •  OrganizaEon	
  is	
  key	
  
     –  Start	
  with	
  the	
  big	
  picture,	
  peel	
  back	
  the	
  layers	
  

 •  Define	
  clear	
  goals,	
  hypothesis	
  	
  
     –  You	
  won’t	
  know	
  if	
  your	
  tests	
  or	
  features	
  worked	
  if	
  you	
  
        don’t	
  pre-­‐define	
  a	
  good	
  goal	
  and	
  hypothesis	
  

 •  Data	
  driven	
  PM’ing	
  is	
  applicable	
  to	
  all	
  aspects	
  	
  
     –  We	
  focused	
  on	
  internal	
  data	
  but	
  you	
  could	
  use	
  it	
  on	
  
        market	
  data,	
  with	
  surveys,	
  with	
  organizaEonal	
  issues,	
  
        almost	
  anything…	
  

                                                                          SkillShare:	
  Think	
  Like	
  a	
  PM,	
  Kenton	
  Kivestu	
  
Thanks	
  &	
  final	
  notes	
  

  •  Slides	
  will	
  be	
  sent	
  out	
  

  •  Contact	
  info:	
  
      –  @kivestu	
  
      –  kivestu@gmail.com	
  
      –  kentonkivestu.com	
  (thoughts	
  on	
  product	
  
         development,	
  mobile)	


                                                       SkillShare:	
  Think	
  Like	
  a	
  PM,	
  Kenton	
  Kivestu	
  

Más contenido relacionado

Similar a SkillShare: Think Like a PM

Change 改變 (2011.06.30@STL 明光社)
Change 改變 (2011.06.30@STL 明光社)Change 改變 (2011.06.30@STL 明光社)
Change 改變 (2011.06.30@STL 明光社)Calvin C. Yu
 
Enterprise Scale Knowledge Graphs
Enterprise Scale Knowledge GraphsEnterprise Scale Knowledge Graphs
Enterprise Scale Knowledge GraphsAnant Narayanan
 
Noticing the Nuance: Designing intelligent systems that can understand semant...
Noticing the Nuance: Designing intelligent systems that can understand semant...Noticing the Nuance: Designing intelligent systems that can understand semant...
Noticing the Nuance: Designing intelligent systems that can understand semant...Elizabeth Murnane
 
SIGCOMM '16 Outrageous Opinion by Marco Canini
SIGCOMM '16 Outrageous Opinion by Marco CaniniSIGCOMM '16 Outrageous Opinion by Marco Canini
SIGCOMM '16 Outrageous Opinion by Marco CaniniMarco Canini
 
NYC Data Web (static version) - A Semantic, Open Public Data Exchange for NYC
NYC Data Web (static version) - A Semantic, Open Public Data Exchange for NYCNYC Data Web (static version) - A Semantic, Open Public Data Exchange for NYC
NYC Data Web (static version) - A Semantic, Open Public Data Exchange for NYCJoel Natividad
 
Smart Cities, Open Data and SMW - SMWCon Spring 2012 Keynote
Smart Cities, Open Data and SMW - SMWCon Spring 2012 KeynoteSmart Cities, Open Data and SMW - SMWCon Spring 2012 Keynote
Smart Cities, Open Data and SMW - SMWCon Spring 2012 KeynoteJoel Natividad
 
Value Mining: How Entity Extraction Informs Analysis
Value Mining: How Entity Extraction Informs AnalysisValue Mining: How Entity Extraction Informs Analysis
Value Mining: How Entity Extraction Informs Analysisikanow
 
Leveraging Data for the Internet of Things
Leveraging Data for the Internet of Things Leveraging Data for the Internet of Things
Leveraging Data for the Internet of Things CLEVER°FRANKE
 
Enterprise ux pres
Enterprise ux presEnterprise ux pres
Enterprise ux presMike McCoy
 
8 better practices from information architecture By: Lou Rosenfeld
8 better practices from information architecture By: Lou Rosenfeld8 better practices from information architecture By: Lou Rosenfeld
8 better practices from information architecture By: Lou RosenfeldWIADColombia
 
Natural Intelligence the human factor in AI
Natural Intelligence the human factor in AINatural Intelligence the human factor in AI
Natural Intelligence the human factor in AIBill Liu
 
Privacy, Ethics, and Future Uses of the Social Web
Privacy, Ethics, and Future Uses of the Social WebPrivacy, Ethics, and Future Uses of the Social Web
Privacy, Ethics, and Future Uses of the Social WebMatthew Russell
 
Developing Staff Competencies in Emerging Technologies
Developing Staff Competencies in Emerging TechnologiesDeveloping Staff Competencies in Emerging Technologies
Developing Staff Competencies in Emerging TechnologiesDouglas Joubert
 
Context Mining and Integration in Web Predictive Analytics
Context Mining and Integration in Web Predictive AnalyticsContext Mining and Integration in Web Predictive Analytics
Context Mining and Integration in Web Predictive AnalyticsJulia Kiseleva
 
Future Forces Affecting Financial Planning 2015-2025
Future Forces Affecting Financial Planning 2015-2025Future Forces Affecting Financial Planning 2015-2025
Future Forces Affecting Financial Planning 2015-2025Rachel Hatch
 
A Social Cloud for Public eResearch
A Social Cloud for Public eResearchA Social Cloud for Public eResearch
A Social Cloud for Public eResearchSimon Caton
 
Mmig talk jan 245 2011
Mmig talk jan 245 2011Mmig talk jan 245 2011
Mmig talk jan 245 2011Brock Dubbels
 

Similar a SkillShare: Think Like a PM (20)

Change 改變 (2011.06.30@STL 明光社)
Change 改變 (2011.06.30@STL 明光社)Change 改變 (2011.06.30@STL 明光社)
Change 改變 (2011.06.30@STL 明光社)
 
Enterprise Scale Knowledge Graphs
Enterprise Scale Knowledge GraphsEnterprise Scale Knowledge Graphs
Enterprise Scale Knowledge Graphs
 
Context, Narratives & Big Data Analytics
Context, Narratives & Big Data AnalyticsContext, Narratives & Big Data Analytics
Context, Narratives & Big Data Analytics
 
Noticing the Nuance: Designing intelligent systems that can understand semant...
Noticing the Nuance: Designing intelligent systems that can understand semant...Noticing the Nuance: Designing intelligent systems that can understand semant...
Noticing the Nuance: Designing intelligent systems that can understand semant...
 
SIGCOMM '16 Outrageous Opinion by Marco Canini
SIGCOMM '16 Outrageous Opinion by Marco CaniniSIGCOMM '16 Outrageous Opinion by Marco Canini
SIGCOMM '16 Outrageous Opinion by Marco Canini
 
NYC Data Web (static version) - A Semantic, Open Public Data Exchange for NYC
NYC Data Web (static version) - A Semantic, Open Public Data Exchange for NYCNYC Data Web (static version) - A Semantic, Open Public Data Exchange for NYC
NYC Data Web (static version) - A Semantic, Open Public Data Exchange for NYC
 
Smart Cities, Open Data and SMW - SMWCon Spring 2012 Keynote
Smart Cities, Open Data and SMW - SMWCon Spring 2012 KeynoteSmart Cities, Open Data and SMW - SMWCon Spring 2012 Keynote
Smart Cities, Open Data and SMW - SMWCon Spring 2012 Keynote
 
Value Mining: How Entity Extraction Informs Analysis
Value Mining: How Entity Extraction Informs AnalysisValue Mining: How Entity Extraction Informs Analysis
Value Mining: How Entity Extraction Informs Analysis
 
Leveraging Data for the Internet of Things
Leveraging Data for the Internet of Things Leveraging Data for the Internet of Things
Leveraging Data for the Internet of Things
 
Enterprise ux pres
Enterprise ux presEnterprise ux pres
Enterprise ux pres
 
8 better practices from information architecture By: Lou Rosenfeld
8 better practices from information architecture By: Lou Rosenfeld8 better practices from information architecture By: Lou Rosenfeld
8 better practices from information architecture By: Lou Rosenfeld
 
Lecture4 Social Web
Lecture4 Social Web Lecture4 Social Web
Lecture4 Social Web
 
Natural Intelligence the human factor in AI
Natural Intelligence the human factor in AINatural Intelligence the human factor in AI
Natural Intelligence the human factor in AI
 
Privacy, Ethics, and Future Uses of the Social Web
Privacy, Ethics, and Future Uses of the Social WebPrivacy, Ethics, and Future Uses of the Social Web
Privacy, Ethics, and Future Uses of the Social Web
 
Developing Staff Competencies in Emerging Technologies
Developing Staff Competencies in Emerging TechnologiesDeveloping Staff Competencies in Emerging Technologies
Developing Staff Competencies in Emerging Technologies
 
Context Mining and Integration in Web Predictive Analytics
Context Mining and Integration in Web Predictive AnalyticsContext Mining and Integration in Web Predictive Analytics
Context Mining and Integration in Web Predictive Analytics
 
Future Forces Affecting Financial Planning 2015-2025
Future Forces Affecting Financial Planning 2015-2025Future Forces Affecting Financial Planning 2015-2025
Future Forces Affecting Financial Planning 2015-2025
 
A Social Cloud for Public eResearch
A Social Cloud for Public eResearchA Social Cloud for Public eResearch
A Social Cloud for Public eResearch
 
Mmig talk jan 245 2011
Mmig talk jan 245 2011Mmig talk jan 245 2011
Mmig talk jan 245 2011
 
Social Media Dataset
Social Media DatasetSocial Media Dataset
Social Media Dataset
 

SkillShare: Think Like a PM

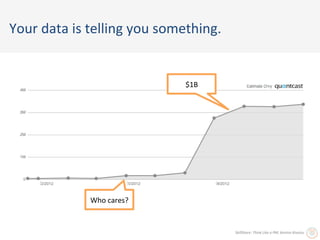
  • 1. Your  data  is  telling  you  something.     $1B   Who  cares?   SkillShare:  Think  Like  a  PM,  Kenton  Kivestu  
  • 2. Listen  to  it.   $1B   Kevin  Systrom  realizes  customers  only  use   their  product  for  one  thing:  photos.  Burbn   dies,  Instagram  is  born.   Who  cares?   SkillShare:  Think  Like  a  PM,  Kenton  Kivestu  
  • 3. Agenda   •  Background   •  IdenEfying  opportuniEes   •  Using  metrics  to  prioriEze   •  TesEng  hypothesis  with  experiments   •  Running  “post-­‐mortem”  analysis   SkillShare:  Think  Like  a  PM,  Kenton  Kivestu  
  • 4. Goals  of  “Think  Like  a  PM”   •  Introduce  the  idea  of  data  driven  PM’ing   –  Focus  on  an  example  using  user  data   •  Review  the  “end-­‐to-­‐end”  process  of  a  data   driven  feature   –  Use  Foursquare  as  an  illustraEve  example   •  Provide  you  with  another  tool  for  approaching   product  development     SkillShare:  Think  Like  a  PM,  Kenton  Kivestu  
  • 5. How  do  PMs  decide  what  features  to  build?   •  Data   •  Talking  to  customers   •  Vision  about  the  future  of  the  product   •  Beliefs     •  Wild-­‐ass  guesses   •  Looking  at  the  compeEEon   •  DirecEon  from  managers  /  execs   •  They  don’t  (indecision  strikes!)   SkillShare:  Think  Like  a  PM,  Kenton  Kivestu  
  • 6. What  types  of  data  do  PMs  focus  on?   •  Market  data   –  “CompeEtors  that  have  focused  on  Z  approach  have  out-­‐ performed  and  we  should  consider  that…”   •  Anecdotal  data     –  Eg,  “When  we  talk  to  customers,  they  always  complain   about  Y  taking  too  long…”   •  User  data   –  We  know  25%  of  users  take  X  acEon  in  the  game…”   –  Some  famous  examples:  Instagram’s  pivot,  Facebook’s   localizaEon  efforts,  Zynga’s  dominance  of  FB  channels   SkillShare:  Think  Like  a  PM,  Kenton  Kivestu  
  • 7. Agenda   •  Background   •  Iden4fying  opportuni4es   •  Using  metrics  to  prioriEze   •  TesEng  hypothesis  with  experiments   •  Running  “post-­‐mortem”  analysis   SkillShare:  Think  Like  a  PM,  Kenton  Kivestu  
  • 8. Why  study  Foursquare?   •  Everyone  can  use  it  (it’s  free)   •  People  are  familiar  with  it  (25M  users)   •  It’s  an  evolving  product  –  you  can  observe  the   Foursquare  team  making  changes  to  the  product   •  Clear  defined  user  flows  &  acEons  to  study   SkillShare:  Think  Like  a  PM,  Kenton  Kivestu  
  • 9. Foursquare  top  level  metrics:  the  “Vanity”   metrics   •  2B  “check-­‐ins”   •  25M  registered  users   •  7.2M+  daily  acEve  users  (DAU)   •  20%  of  searches  result  in  a  check-­‐in   SkillShare:  Think  Like  a  PM,  Kenton  Kivestu   NOTE:  Stats  from  TechCrunch,  “Foursquare  looks  into  a  4th  round”,  Nov.  2,  2012  
  • 10. Two  things  to  remember  when  working  with   data   What  is  this?   SkillShare:  Think  Like  a  PM,  Kenton  Kivestu   NOTE:  Stats  from  TechCrunch,  “Foursquare  looks  into  a  4th  round”,  Nov.  2,  2012  
  • 11. Start  with  the  full  picture,  peel  back  layers  of   the  onion   Zoom  out  so  you  can     And  then  you  can  work  on     see  the  whole  picture…   peeling  back  the  layers…   It’s  a  bridge!   SkillShare:  Think  Like  a  PM,  Kenton  Kivestu  
  • 12. Key  steps  to  idenEfying  opportuniEes   1)  Define  a  clear,  measurable  goal   –  Eg,  “We  want  to  increase  Foursquare  check-­‐ins  /  day”   2)  Define  the  relevant  data  set   –  Eg  “What  drives  daily  check-­‐ins?”   3)  Determine  the  status  quo   –  Eg,  “What  does  the  current  data  show  about  daily  check-­‐ ins?”   4)  IdenEfy  opportuniEes  to  improve  the  goal   –  Eg,  “What  are  the  inflecEon  points?”   SkillShare:  Think  Like  a  PM,  Kenton  Kivestu  
  • 13. Defining  a  clear,  measurable  goal   Foursquare  derives  value  from   loca4on  data   •  Check-­‐ins  are  a  criEcal  piece   (eg  build  the  database  of   locaEon  data)   •  They  have  viral  value  (eg   “Kenton  checked  in  here…)   •  Check-­‐in  rates  indicate  the   health  of  the  app  /  user   base  (eg,  Check-­‐ins  /  day  is  a   good  indicator  of  user   acEvity)   •  Result:  Check-­‐ins  could  be  a   great  piece  of  data  to   understand  beCer   SkillShare:  Think  Like  a  PM,  Kenton  Kivestu  
  • 14. Key  steps  to  idenEfying  opportuniEes   1)  Define  a  clear,  measurable  goal   –  Eg,  “We  want  to  increase  Foursquare  check-­‐ins  /  day”   2)  Define  the  relevant  data  set   –  Eg  “What  drives  daily  check-­‐ins?”   3)  Determine  the  status  quo   –  Eg,  “What  does  the  current  data  show  about  daily  check-­‐ ins?”   4)  IdenEfy  opportuniEes  to  improve  the  goal   –  Eg,  “What  are  the  inflecEon  points?”   SkillShare:  Think  Like  a  PM,  Kenton  Kivestu  
  • 15. What’s  the  anatomy  of  a  check-­‐in?   iPhone  home  screen   Foursquare  home   Loca4on  picker   Check  in  details   •  How  many   •  How  many  users   •  How  many  users   •  How  many  users   users?   reach  it  daily?   reach  it  daily?   reach  it  daily?   •  How  many   •  How  many   •  How  many   •  How  many  share  on   decide  to  login   decide  to  click  to   decide  to  select   social  media?  On   on  any  given   iniEate  a  check   an  actual   twiper?  On   day?   in?   locaEon?   facebook?   •  How  many  include  a   photo?   SkillShare:  Think  Like  a  PM,  Kenton  Kivestu  
  • 16. Key  steps  to  idenEfying  opportuniEes   1)  Define  a  clear,  measurable  goal   –  Eg,  “We  want  to  increase  Foursquare  check-­‐ins  /  day”   2)  Define  the  relevant  data  set   –  Eg  “What  drives  daily  check-­‐ins?”   3)  Determine  the  status  quo   –  Eg,  “What  does  the  current  data  show  about  daily  check-­‐ ins?”   4)  IdenEfy  opportuniEes  to  improve  the  goal   –  Eg,  “What  are  the  inflecEon  points?”   SkillShare:  Think  Like  a  PM,  Kenton  Kivestu  
  • 17. Foursquare  data:  the  top  level  funnel  of  user   acEvity   Funnel  Step   Users  hiGng  that  step   %  proceeding  from  previous   Total  registered  users   25,000,000   Daily  acEve  users   7,200,000   28.8%   Click  “Check-­‐in”   1,800,000   25%   Select  locaEon   900,000   50%   Complete  check-­‐in   630,000   70%   Social  Media  sharing   189,000   30%   Share  photo   126,000   20%   No  meta  data   315,000   50%   SkillShare:  Think  Like  a  PM,  Kenton  Kivestu   NOTE:  Total  registered  users,  DAU  stats  from  TechCrunch,  “Foursquare  looks  into  a  4th  round”,  Nov.  2,  2012.  All  other  numbers  are  SWAG  at  Foursquare  core  funnel  
  • 18. Key  steps  to  idenEfying  opportuniEes   1)  Define  a  clear,  measurable  goal   –  Eg,  “We  want  to  increase  Foursquare  check-­‐ins  /  day”   2)  Define  the  relevant  data  set   –  Eg  “What  drives  daily  check-­‐ins?”   3)  Determine  the  status  quo   –  Eg,  “What  does  the  current  data  show  about  daily  check-­‐ ins?”   4)  IdenEfy  opportuniEes  to  improve  the  goal   –  Eg,  “What  are  the  inflecEon  points?”   SkillShare:  Think  Like  a  PM,  Kenton  Kivestu  
  • 19. IdenEfy  opportuniEes  by  understanding  what   the  data  suggests  about  user  behavior   •  QuesEons  to  consider:   –  What’s  going  on  at  the  top  of  the  funnel?   –  At  the  bopom  of  the  funnel?   –  Which  acEons  are  we  most  concerned  with?   –  Where  do  we  “lose”  the  most  users?   –  What’s  working  well?  Why?   SkillShare:  Think  Like  a  PM,  Kenton  Kivestu  
  • 20. Opportunity  #1:  Increase  daily  logins   Funnel  Step   Users  hiGng  that  step   %  proceeding  from  previous   Total  registered  users   25,000,000   Daily  acEve  users   7,200,000   28.8%   Click  “Check-­‐in”   1,800,000   25%   1   Select  locaEon   900,000   50%   Only  ~29%  of  the  user  base  logs  into  the  app  each   Complete  check-­‐in   630,000   day.  One  opportunity  would  be  to  apract  more   70%   users  to  the  app  each  day.  This  would  “widen  the   Social  Media  sharing   189,000  f  the  funnel”   top  o 30%   Share  photo   126,000   20%   No  meta  data   315,000   50%   SkillShare:  Think  Like  a  PM,  Kenton  Kivestu   NOTE:  Total  registered  users,  DAU  stats  from  TechCrunch,  “Foursquare  looks  into  a  4th  round”,  Nov.  2,  2012.  All  other  numbers  are  SWAG  at  Foursquare  core  funnel  
  • 21. Opportunity  #2:  Increase  the  daily  check-­‐ins   Funnel  Step   Users  hiGng  that  step   %  proceeding  from  previous   Total  registered  users   25,000,000   Daily  acEve  users   7,200,000   28.8%   Click  “Check-­‐in”   1,800,000   25%   Select  locaEon   900,000   50%   2   Complete  check-­‐in   630,000   70%   Only  ~25%  of  the  user  base  starts  the  “check-­‐in”   Social  Media  sharing   process  each  189,000   is  opportunity  to  increase   day.  There   30%   the  number  of  “check-­‐ins”  simply  by  gewng  the   Share  photo   126,000   20%   apenEon  of  our  logged  in  users   No  meta  data   315,000   50%   SkillShare:  Think  Like  a  PM,  Kenton  Kivestu   NOTE:  Total  registered  users,  DAU  stats  from  TechCrunch,  “Foursquare  looks  into  a  4th  round”,  Nov.  2,  2012.  All  other  numbers  are  SWAG  at  Foursquare  core  funnel  
  • 22. Opportunity  #3:  Increase  the  %  of  users   selecEng  locaEon   Funnel  Step   Users  hiGng  that  step   %  proceeding  from  previous   Total  registered  users   25,000,000   Daily  acEve  users   7,200,000   28.8%   Click  “Check-­‐in”   1,800,000   25%   Select  locaEon   900,000   50%   Complete  check-­‐in   630,000   70%   3   Social  Media  sharing   189,000   30%   Only  ~50%  of  the  users  that  start  a  “check-­‐in”   Share  photo   126,000   20%   actually  select  their  locaEon.  There  is  room  to   opEmize  this  step  of  the  funnel  and  minimize  the   No  meta  data   315,000   drop-­‐off   50%   SkillShare:  Think  Like  a  PM,  Kenton  Kivestu   NOTE:  Total  registered  users,  DAU  stats  from  TechCrunch,  “Foursquare  looks  into  a  4th  round”,  Nov.  2,  2012.  All  other  numbers  are  SWAG  at  Foursquare  core  funnel  
  • 23. Opportunity  #4:  Increase  the  number  of  users   compleEng  the  final  check-­‐in  step   Funnel  Step   Users  hiGng  that  step   %  proceeding  from  previous   Total  registered  4  sers   u 25,000,000   Daily  acEve  users   7,200,000   28.8%   We  lose  another  30%  of  users  on  the  final  step  of   Click  “Check-­‐in”   the  “check-­‐in.”  Is  there  anyway  to  prevent  that?   1,800,000   25%   Select  locaEon   900,000   50%   Complete  check-­‐in   630,000   70%   Social  Media  sharing   189,000   30%   Share  photo   126,000   20%   No  meta  data   315,000   50%   SkillShare:  Think  Like  a  PM,  Kenton  Kivestu   NOTE:  Total  registered  users,  DAU  stats  from  TechCrunch,  “Foursquare  looks  into  a  4th  round”,  Nov.  2,  2012.  All  other  numbers  are  SWAG  at  Foursquare  core  funnel  
  • 24. Summary:  4  key  steps  to  idenEfying  product   opportuniEes  with  data   Key  things  to  remember:   1)  Define  a  clear,  measurable  goal:  “Increasing   check-­‐ins”   2)  Collect  the  relevant  data  set  &  assemble  it   3)  Determine  the  status  quo   4)  IdenEfy  opportuniEes  to  improve  the  goal   SkillShare:  Think  Like  a  PM,  Kenton  Kivestu  
  • 25. Dennis  says:  “I’ve  just  realized  that  …  ”   …  for  every  photo  that  gets  shared  on   Twiper  via  Foursquare,  we  acquire  2   new  users.  If  we  could  double  the   amount  of  photos  shared,  we’d  double   our  user  base.  How  many  more  photos   can  we  get  users  sharing  on  Twiper?”   SkillShare:  Think  Like  a  PM,  Kenton  Kivestu  
  • 26. Which  of  the  4  opportuniEes  does  Dennis   want  to  take  advantage  of?   Eeeny  …  meeny  …  miny  …  moe  ….   SkillShare:  Think  Like  a  PM,  Kenton  Kivestu  
  • 27. Opportunity  #5:  Increase  the  top  of  the   funnel  by  increasing  the  bopom!   Funnel  Step   Users  hiGng  that  step   %  proceeding  from  previous   Total  registered  users   25,000,000   Daily  acEve  users   7,200,000   28.8%   Click  “Check-­‐in”   5   1,800,000   25%   Select  locaEon   900,000   50%   Dennis’  insight:  If  we  increase  those  sharing  photos,   We  lose  another  30%  of  users  on  the  final  step  of   we  will  get  more  users  which  will  increase  the  top  of   Complete  check-­‐in   the  “check-­‐in.”  Is  there  anyway  t70%   630,000   o  prevent  that?   the  funnel   Social  Media  sharing   189,000   30%   Share  photo   126,000   20%   No  meta  data   315,000   50%   SkillShare:  Think  Like  a  PM,  Kenton  Kivestu   NOTE:  Total  registered  users,  DAU  stats  from  TechCrunch,  “Foursquare  looks  into  a  4th  round”,  Nov.  2,  2012.  All  other  numbers  are  SWAG  at  Foursquare  core  funnel  
  • 28. Agenda   •  Background   •  IdenEfying  opportuniEes   •  Using  metrics  to  priori4ze   •  TesEng  hypothesis  with  experiments   •  Running  “post-­‐mortem”  analysis   SkillShare:  Think  Like  a  PM,  Kenton  Kivestu  
  • 29. Given  Dennis’  goals  of  increasing  photo  shares,   we  need  to  beper  understand  that  data   •  QuesEons  to  consider   –  What  does  the  photo  sharing  funnel  look  like?   –  What  drives  photo  sharing?   –  How  do  photos  get  shared  today?   –  How  can  we  encourage/discourage  that  behavior   to  achieve  our  goals?   SkillShare:  Think  Like  a  PM,  Kenton  Kivestu  
  • 30. Zoom  in  on  the  social  media  and  photo   sharing  aspect  of  the  funnel   Funnel  Step   Users  hiGng  that  step   %  proceeding  from  previous   Compete  check-­‐ins   630,000   Social  media  shared   189,000   30%   Shared  to  Twiper   37,800   20%   Shared  to  Twiper  w/  photo   34,020   90%   Shared  to  FB   151,200   80%   Shared  to  FB  w/  photo   15,120   10%   SkillShare:  Think  Like  a  PM,  Kenton  Kivestu  
  • 31. #1:  Increase  the  %  of  users  who  share  a   photo  ayer  they’ve  decided  to  tweet   Funnel  Step   Users  hiGng  that  step   %  proceeding  from  previous   Compete  check-­‐ins   1   630,000   If  we  increase  the  %  of  users  who  share  a  photo   Social  media  shared   when  they  tweet,  w189,000   that  do  to  our   hat  would   30%   numbers?   Shared  to  Twiper   37,800   20%   Shared  to  Twiper  w/  photo   34,020   90%   Shared  to  FB   151,200   80%   Shared  to  FB  w/  photo   15,120   10%   SkillShare:  Think  Like  a  PM,  Kenton  Kivestu  
  • 32. By  increasing  Twiper  sharing,  gain  10%+   photo  shares   Funnel  Step   Users  hiGng  that  step   %  proceeding  from  previous   Compete  check-­‐ins   630,000   Social  media  shared   189,000   30%   Shared  to  Twiper   37,800   20%   Shared  to  Twiper  w/  photo   37,800  (+10%)   100%   Shared  to  FB   151,200   80%   Shared  to  FB  w/  photo   15,120   10%   SkillShare:  Think  Like  a  PM,  Kenton  Kivestu  
  • 33. #2:  Increase  the  %  of  people  sharing  via  social   media  channels   Funnel  Step   Users  hiGng  that  step   %  proceeding  from  previous   Compete  check-­‐ins   630,000   Social  media  shared   189,000   30%   Shared  to  Twiper   37,800   20%   2   Shared  to  Twiper  w/  photo   90%   What  happens  if  we  increase  the  %  of  people   Shared  to  FB   151,200   sharing  via  social  media  from  30%  to  50%?   80%   Shared  to  FB  w/  photo   15,120   10%   SkillShare:  Think  Like  a  PM,  Kenton  Kivestu  
  • 34. By  increasing  %  of  people  sharing  via  social,   gain  66.6%+  more  photo  shares!   Funnel  Step   Users  hiGng  that  step   %  proceeding  from  previous   Compete  check-­‐ins   630,000   Social  media  shared   315,000   50%   Shared  to  Twiper   63,000   20%   Shared  to  Twiper  w/  photo   56,700  (+66.6%)   90%   Shared  to  FB   252,000   80%   Shared  to  FB  w/  photo   25,200   10%   SkillShare:  Think  Like  a  PM,  Kenton  Kivestu  
  • 35. #3:  Increase  the  %  of  users  sharing  via  Twiper   vs.  Facebook   Funnel  Step   Users  hiGng  that  step   %  proceeding  from  previous   Compete  check-­‐ins   630,000   Social  media  shared   189,000   30%   Shared  to  Twiper   37,800   20%   Shared  to  Twiper  w/  photo   34,020   90%   3   Shared  to  FB   151,200   80%   What  happens  if  we  increase  the  %  of  users  who   Shared  to  FB  w/  photo   15,120   share  via  Twiper  from  20%  to  50%?   10%   SkillShare:  Think  Like  a  PM,  Kenton  Kivestu  
  • 36. By  increasing  mix  of  social  shares  to  Twiper,   gain  125%+  photo  –  holy  cow!!   Funnel  Step   Users  hiGng  that  step   %  proceeding  from  previous   Compete  check-­‐ins   630,000   Social  media  shared   189,000   30%   Shared  to  Twiper   94,500   50%   Shared  to  Twiper  w/  photo   85,050  (+125%)   90%   Shared  to  FB   94,500   50%   Shared  to  FB  w/  photo   9,450   10%   SkillShare:  Think  Like  a  PM,  Kenton  Kivestu  
  • 37. If  you  were  forced  to  only  make  1  change,   which  would  it  be?   •  Increase  the  %  of  users  who  share  a  photo  when  TweeEng  their   check-­‐in   –  Expected  impact:  +10%  increase  in  Tweets  w/  photo   •  Increase  the  %  of  users  who  decide  to  share  his/her  check-­‐in  on   social  media   –  Expected  impact:  +66%  increase  in  Tweets  w/  photo   •  Increase  %  of  users  who  share  his/her  check-­‐in  on  Twiper  vs.   Facebook   –  Expected  impact:  +125%  increase  in  Tweets  w/  photo   SkillShare:  Think  Like  a  PM,  Kenton  Kivestu  
  • 38. If  you  were  forced  to  only  make  1  change,   which  would  it  be?   •  Increase  the  %  of  users  who  share  a  photo  when  TweeEng  their   check-­‐in   –  Expected  impact:  +10%  increase  in  Tweets  w/  photo   •  Increase  the  %  of  users  who  decide  to  share  his/her  check-­‐in  on   social  media   –  Expected  impact:  +66%  increase  in  Tweets  w/  photo   •  Increase  %  of  users  who  share  his/her  check-­‐in  on  Twiper  vs.   Facebook   –  Expected  impact:  +125%  increase  in  Tweets  w/  photo   SkillShare:  Think  Like  a  PM,  Kenton  Kivestu  
  • 39. How  could  you  increase  %  of  users  sharing  via   Twiper  vs.  Facebook?   Op4ons  to  increase  %  of  TwiCer   shares   •  Remove  FB  as  an  opEon   •  Make  Twiper  “Opt-­‐out”   •  Provide  incenEve  to  “Tweet”  (eg,   “Extra  Foursquare  points”   •  Make  it  mandatory  for  any  user  w/   a  linked  Twiper  account   •  Move  it  “up”  in  the  funnel   •  Move  it  “down”  in  the  funnel  and   make  it  “opt-­‐out”   SkillShare:  Think  Like  a  PM,  Kenton  Kivestu  
  • 40. How  could  you  increase  %  of  users  sharing  via   Twiper  vs.  Facebook?   Op4ons  to  increase  %  of  TwiCer   shares   •  Remove  FB  as  an  opEon   •  Make  Twiper  “Opt-­‐out”   •  Provide  incenEve  to  “Tweet”  (eg,   “Extra  Foursquare  points”   •  Make  it  mandatory  for  any  user  w/   a  linked  Twiper  account   •  Move  it  “up”  in  the  funnel   •  Move  it  “down”  in  the  funnel  and   make  it  “opt-­‐out”   SkillShare:  Think  Like  a  PM,  Kenton  Kivestu  
  • 41. AddiEonal  consideraEons  when  prioriEzing   •  What  if  we  did  mul4ple  features  together?   –  Sure!  That  could  increase  the  expected  impacts  even  further   –  NOTE:  Must  be  careful  w/  experiment  design  here  so  results  aren’t  muddled   •  What  is  the  maximum  %  of  social  media  shares  that  TwiCer  could  get?   –  Data  needed:  What  %  of  users  have  linked  Twiper  accounts?   •  What  if  20%  is  the  maximum  share  percentage  (because  only  20%  of  users  have   TwiCer  linked)   –  You  need  to  apack  a  different  part  of  the  funnel   –  Build  a  feature  that  encourages  users  to  link  Twiper  accounts   •  But  there  must  be  more!?   –  Could  be  even  *more*  aggressive  by  puwng  social  media  and  photo  sharing  higher   in  the  funnel   –  Or  could  make  social  media  sharing  “opt-­‐out”  vs.  “opt-­‐in”   SkillShare:  Think  Like  a  PM,  Kenton  Kivestu  
  • 42. Agenda   •  Background   •  IdenEfying  opportuniEes   •  Using  metrics  to  prioriEze   •  Tes4ng  hypothesis  with  experiments   •  Running  “post-­‐mortem”  analysis   SkillShare:  Think  Like  a  PM,  Kenton  Kivestu  
  • 43. A  good  experiment  begins  with  a  clear  hypothesis   •  Our  hypothesis:   –  We  can  increase  the  %  of  users  sharing  to  Twiper   vs.  Facebook  to  50%  by  making  Twiper  “opt-­‐out”   –  This  will,  in  turn,  drive  the  number  of  Tweeted   photos  up  125%+   –  For  every  addiEonal  Tweeted  photo,  Foursquare   will  gain  2  new  users  /  day   SkillShare:  Think  Like  a  PM,  Kenton  Kivestu  
  • 44. The  goal:  Prove  the  criEcal  aspects  of  our   hypothesis   •  CriEcal  aspects:   –  Get  50%  of  social  media  sharers  to  use  Twiper   –  Drive  up  Tweeted  photos  +125%   –  Acquire  2  new  users  for  each  addiEonal  photo   •  To  prove:   –  Run  a  controlled  A/B  test   –  Setup  a  test  where  50%  of  users  get  status  quo  flow   –  The  other  50%  get  the  new  Twiper  “opt-­‐out”  flow   –  Make  sure  you  have  staEsEcally  significant  sample   sizes  (eg  here  were  using  50%,  ~300K  check-­‐ins)   SkillShare:  Think  Like  a  PM,  Kenton  Kivestu  
  • 45. Agenda   •  Background   •  IdenEfying  opportuniEes   •  Using  metrics  to  prioriEze   •  TesEng  hypothesis  with  experiments   •  Running  “post-­‐mortem”  analysis   SkillShare:  Think  Like  a  PM,  Kenton  Kivestu  
  • 46. Key  steps  to  assembling  the  post-­‐mortem   analysis   1)  Collect  &  assemble  data  from  test  vs.  control   –  Eg,  “What  is  the  core  data  from  the  experiment”   2)  Compare  test  results  vs.  expected  results   –  Eg  “What  exceeded  or  missed  expectaEons?”   3)  What  are  the  next  steps   –  Eg,  “Should  we  invest  more  Eme/effort?  If  so,  on   what?  What  will  be  the  impact?”     SkillShare:  Think  Like  a  PM,  Kenton  Kivestu  
  • 47. Test  shows  40%  sharing  on  Twiper,  resulEng   in  +78%  in  tweeted  photos   Funnel  Step   Control  (50%  of   Test  (50%  of  users)   users)   Compete  check-­‐ins   315,000   315,000   Social  media  shared   94,500   30%   94,500   30%   Shared  to  Twiper   18,900   20%   37,800   40%   Shared  to  Twiper  w/   17,000   90%   30,240  (+78%)   80%   photo   Shared  to  FB   75,600   80%   56,700   60%   Shared  to  FB  w/  photo   7,560   10%   5,670   10%   SkillShare:  Think  Like  a  PM,  Kenton  Kivestu   NOTE:  Stats  from  TechCrunch,  “Foursquare  looks  into  a  4th  round”,  Nov.  2,  2012  
  • 48. Key  steps  to  assembling  the  post-­‐mortem   analysis   1)  Collect  &  assemble  data  from  test  vs.  control   –  Eg,  “What  is  the  core  data  from  the  experiment”   2)  Compare  test  results  vs.  expected  results   –  Eg  “What  exceeded  or  missed  expectaEons?”   3)  What  are  the  next  steps   –  Eg,  “Should  we  invest  more  Eme/effort?  If  so,  on   what?  What  will  be  the  impact?”     SkillShare:  Think  Like  a  PM,  Kenton  Kivestu  
  • 49. How  does  this  compare  to  expectaEons?  Why   did  this  happen?   Funnel  Step   Expecta4ons   %  proceeding   Test  (50%  of  users)   %  proceeding   Delta     Compete  check-­‐ins   315,000   315,000   Social  media  shared   94,500   30%   94,500   30%   ~   Shared  to  Twiper   47,250   50%   37,800   40%   -­‐10%   Shared  to  Twiper  w/   42,525  (+125%)   90%   30,240  (+78%)   80%   -­‐10%   photo   Shared  to  FB   47,250   50%   56,700   60%   +10%   Shared  to  FB  w/  photo   4,725   10%   5,670   10%   ~   SkillShare:  Think  Like  a  PM,  Kenton  Kivestu  
  • 50. Key  steps  to  assembling  the  post-­‐mortem   analysis   1)  Collect  &  assemble  data  from  test  vs.  control   –  Eg,  “What  is  the  core  data  from  the  experiment”   2)  Compare  test  results  vs.  expected  results   –  Eg  “What  exceeded  or  missed  expectaEons?”   3)  What  are  take  aways  &  next  steps   –  Eg,  “Should  we  invest  more  Eme/effort?  If  so,  on   what?  What  will  be  the  impact?”     SkillShare:  Think  Like  a  PM,  Kenton  Kivestu  
  • 51. Key  quesEons  &  take-­‐aways   Key  ques4on   Result   Why?   Next  steps     Did  we  get  50%  of  users   No.  We  got  40%   •  Maybe  hit  a  natural  limit  (%  of   •  Determine  natural  limit   to  share  on  Twiper?   users  w/  Twiper  accounts)   •  Consider  encouraging   account  linking   Did  we  get  +125%   No.  We  got  78%   •  Photo  sharing  %  dropped  to   •  Can  we  increase  photo   increase  in  photo   80%   sharing  %?   sharing?   •  We  only  got  40%  sharing  via   Twiper  (vs.  expected  50%)   What’s  the  upside  ley?   12,525  photo   •  If  we  can  tweak  to  hit  goals  of   •  What  %  of  that  upside  is   shares  /  day   50%  and  90%   *truly*  achievable  given   our  results?   Was  the  test  a  success?   Yes!   •  Proved  that  tweaking  Twiper   •  Evaluate  above  opEons,   opEon  can  drive  photo  shares   determine  prioriEes  &   repeat!   SkillShare:  Think  Like  a  PM,  Kenton  Kivestu  
  • 52. Conclusions   •  OrganizaEon  is  key   –  Start  with  the  big  picture,  peel  back  the  layers   •  Define  clear  goals,  hypothesis     –  You  won’t  know  if  your  tests  or  features  worked  if  you   don’t  pre-­‐define  a  good  goal  and  hypothesis   •  Data  driven  PM’ing  is  applicable  to  all  aspects     –  We  focused  on  internal  data  but  you  could  use  it  on   market  data,  with  surveys,  with  organizaEonal  issues,   almost  anything…   SkillShare:  Think  Like  a  PM,  Kenton  Kivestu  
  • 53. Thanks  &  final  notes   •  Slides  will  be  sent  out   •  Contact  info:   –  @kivestu   –  kivestu@gmail.com   –  kentonkivestu.com  (thoughts  on  product   development,  mobile)   SkillShare:  Think  Like  a  PM,  Kenton  Kivestu