Recomendados

Recomendados
Más contenido relacionado
Más de JLL_Midwest_Great_Lakes_Research
Más de JLL_Midwest_Great_Lakes_Research (20)
Último
Último (20)
JLL Chart of the Week
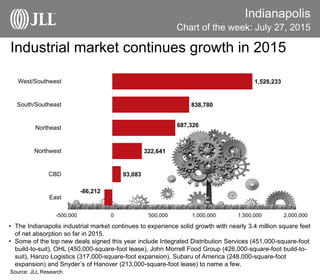
- 1. Indianapolis Chart of the week: July 27, 2015 Source: JLL Research • The Indianapolis industrial market continues to experience solid growth with nearly 3.4 million square feet of net absorption so far in 2015. • Some of the top new deals signed this year include Integrated Distribution Services (451,000-square-foot build-to-suit), OHL (450,000-square-foot lease), John Morrell Food Group (426,000-square-foot build-to- suit), Hanzo Logistics (317,000-square-foot expansion), Subaru of America (248,000-square-foot expansion) and Snyder’s of Hanover (213,000-square-foot lease) to name a few. Industrial market continues growth in 2015 -86,212 93,083 322,641 687,326 838,780 1,528,233 -500,000 0 500,000 1,000,000 1,500,000 2,000,000 East CBD Northwest Northeast South/Southeast West/Southwest