Recomendados

Recomendados
Más contenido relacionado
Destacado
Similar a Poster_ABRCMS
Similar a Poster_ABRCMS (20)
Poster_ABRCMS
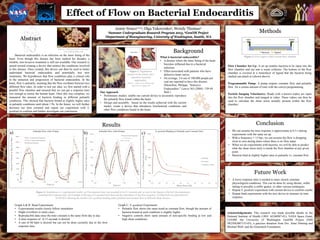
- 1. . Jamie Nunez1,2,3, Olga Yakovenko3, Wendy Thomas3 1Summer Undergraduate Research Program 2015, 2GenOM Project 3Department of Bioengineering, University of Washington, Seattle, WA Methods Background Acknowledgements: This research was made possible thanks to the National Institute of Health (1R01 AI106987-01), NASA Space Grant, LSAMP, the University of Washington GenOM Project (NIH 5R25HG007153-03), a gracious donation from Drs. Anne Dinning and Michael Wolf, and the Genentech Foundation. Results Effect of Flow on Bacterial Endocarditis Bacterial endocarditis is an infection on the inner lining of the heart. Even though this disease has been studied for decades, a reliable, non-invasive treatment is still not available. Our research is aimed toward creating a device that mimics the conditions involved in this disease. Once created, this device can then be used to better understand bacterial endocarditis and potentially test new treatments. We hypothesize that flow conditions play a critical role in the initiation and progression of bacterial endocarditis. In the heart, flow is pulsatile, meaning that the flow oscillates between two different flow rates. In order to test our idea, we first started with a parallel flow chamber and ensured that we can get a response time low enough to mimic the human heart. Once this was complete, we measured the amount of bacteria binding in different pulsatile conditions. This showed that bacteria bound at slightly higher rates in pulsatile conditions until about 1 Pa. In the future, we will further decrease our time constant and repeat our experiment with S. gordonii to confirm and further investigate our conclusion. Flow Chamber Set Up: A set up enables bacteria to be input into the flow chamber and out into a waste collector. The bottom of the flow chamber is covered in a monolayer of ligand that the bacteria being studied can attach to (shown above). Programmable Pump: A pump outputs constant flow and pulsatile flow for a certain amount of time with the correct programming. Particle Imaging Velocimetry: Beads with a known radius are input into the flow chamber and imaged in video. These videos can then be used to calculate the shear stress actually present within the flow chamber. Inlet Outlet Figure 2: Flow region within current flow chamber Bacteria Ligand Figure 1: Vegetations formed on the mitral valve caused by bacterial endocarditis. Sources: (left) www.e-heart.org, (top) www.scripps.org Our Approach • Preliminary studies: enable our current device to accurately reproduce the pulsatile flow found within the heart. • Design and assembly: based on the results achieved with the current model, create a device that introduces biochemical conditions and other flow conditions found in the heart. What is bacterial endocarditis? • A disease where the inner lining of the heart becomes inflamed due to a bacterial infection. • Often associated with patients who have defective heart valves. • On average, 3.6 out of 100,000 people per year are reported to have this disease. (Moreillon, Philippe. "Infective Endocarditis." Lancet 363 (2004): 139-49. Web.) Abstract Graph A & B: Bead Experiments • Experimental results closely follow simulation • Slight overshoot in some cases • Reproducible data since the time constant is the same from day to day. • A time response of ~0.15 seconds is desired. • A rate of 60 bpm is desired but can not be done currently due to the slow response time. • We can assume the time response is approximate to 0.3 s during experiments with the same set up. • With a frequency = 15 bps, we can assume the flow is dropping close to zero during times where there is no flow input. • When we do experiments with bacteria, we will be able to predict what the shear stress truly is inside the flow chamber at any given point. • Bacteria bind at slightly higher rates in pulsatile vs. constant flow Conclusion Sources: (left) guardianlv.com, (top) www.clipartpanda.com Future Work Figure 4: Simulations vs. experimental results. (a) The response time was assumed to be 0.3 seconds and, as seen in the figures to the left, the experiment confirmed this response time. (b) Example of the pace of a normal heart beat and the importance of the time response. (c) Data from an experiment on 10/20/2015 showing the number of S. gordonii binding under pulsatile and constant flow at different shear stresses. 0% 20% 40% 60% 80% 100% 120% 0.0 0.5 1.0 1.5 2.0 2.5 3.0 3.5 4.0 4.5 PercentageofBacteriaBoundComparedtoPeak Flow Shear Stress (Pa) S. gordonii Binding in Pulsatile and Constant Flow Pulsatile Constant Negative Controls 0% 20% 40% 60% 80% 100% 120% 140% 160% 0.00 2.00 4.00 6.00 8.00 10.00 PercentofVelocityatMaxFlowRate Time (s) Pulsatile Flow with 15 bpm Day 1 Experimental Response Day 2 Experimental Response Predicted Response a) b) 0% 20% 40% 60% 80% 100% 120% 1.00 2.00 3.00 4.00 PercentofVelocityatMaxFlowRate Time (s) Pulsatile Flow with 60 bpm Experimental Response τ = 0.15 sec τ = 0.3 sec c) • A lower response time is needed to more closely simulate physiological conditions. This can be done by using shorter, stiffer tubing or possibly a stiffer gasket, or other various techniques. • Repeat S. gordonii experiment with current device to confirm results. • Repeat bead experiments with the new device to measure its time response. Graph C: S. gordonii Experiment • Pulsatile flow shows the same trend as constant flow, though the amount of bacteria bound at each condition is slightly higher. • Negative controls show same amount of non-specific binding at low and high shear conditions.