2. Managementuittreksel
Titel : Environmental and Economic aspects of using LNG as a fuel for
shipping in The Netherlands
Auteur(s) : Ruud Verbeek
Gerrit Kadijk
Pim van Mensch
Chris Wulffers
Bas van den Beemt
Filipe Fraga
Datum : 1 maart 2011
Opdrachtnr. :
Rapportnr. : TNO-RPT-2011-00166
3. TNO report | TNO-RPT-2011-00166 | 1.0 3
Summary
A study was conducted to investigate the environmental aspects, and to a lesser extent
economic aspects, of using LNG (Liquefied Natural Gas) as a fuel for different types of
ships. The study was supported by the Dutch Maritime Innovation Programme (MIP)
and 12 industrial stakeholders.
The investigation was carried out as a case study for three different types of ships which
have their base in Rotterdam, the Netherlands. The three evaluated cases are:
1) a short sea ship: an 800 TEU container feeder
2) a port ship: an 80 ton harbour tug
3) a 110 x 11.5 m inland ship
The environmental aspects include greenhouse gas (GHG) and air pollutant emissions.
The GHG emission comparison included three LNG chains and three diesel fuel chains
(HFO, MDO/MGO and EN590). In addition a limited economic analysis was done,
comparing the potential fuel cost savings of LNG with the additional costs of LNG
powered vessels. The LNG chains considered are:
• LNG from Peakshaver Rotterdam: Pipeline gas from the North Sea
• LNG supplied by LNG carrier from the Middle East (Qatar).
• LNG from Peakshaver Rotterdam: Pipeline gas from Russia (7000 km).
The last chain is not a realistic option for direct LNG supply to Rotterdam and is merely
added for reference.
Greenhouse gas emissions
The greenhouse gas emissions evaluation includes CO2, CH4 and N2O emissions (sum
is indicated by CO2equivalent). They are primarily dependent on the carbon content of
the fuel and the efficiency of the propulsion engine. Since for the three cases the engine
efficiency with LNG is only about 1% lower than for diesel, greenhouse gas emissions
are simply expressed in g/MJ fuel energy. This is representative for the three cases. The
results of the greenhouse gas emissions comparison of the five main fuel chains is
shown in Figure 1.
4. TNO report | TNO-RPT-2011-00166 | 1.0 4
0.0
10.0
20.0
30.0
40.0
50.0
60.0
70.0
80.0
90.0
100.0
LNG Qatar LNG NL
peak shave
HFO MGO/MDO EN590 10
ppm S
CO2eq.WTP
TTP CH4 + N2O
TTP CO2
WTT CH4 + N2O
WTT CO2
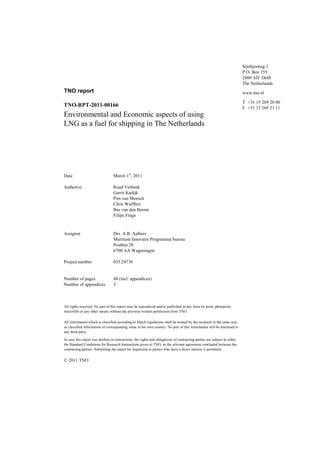
Figure 1. Overview annual Well To Propeller (WTP) GHG emissions [g CO2eq/MJ] of the 5 most realistic
LNG and diesel fuel chains, representative for the three application cases evaluated.
Air pollutant emissions
The comparison of air pollutant emissions included NOx, SOx and particulates (PM)
emissions. It was done for different diesel engine types and diesel fuels reflecting the
time frame 2011 to 2015 and for 2016 and later. For the latter, the diesel engines are
equipped with emissions control devices in order to reduce NOx emissions by more
than 75% which is necessary for Tier III (for sea ships) and the CCNR IV (for inland
ships). This step also includes the use of MGO instead of MDO for sea ships, which
implies that the emissions of the diesel engine (reference) are reduced. It should be
noted that the use of HFO with on-board SOx abatement technologies using scrubber
solutions have not been investigated as part of this study. The results are presented in
Figure 2. For the 2011-2015 time frame, the reduction with LNG is about 60-85% for
both NOx and PM. The SOx reduction is 99% for the short sea case. For the port and
inland ships, the SOx is in absolute terms low for both LNG and diesel due to the use of
low sulphur diesel fuel.
(a) (b)
Figure 2. Comparison of annual Tank To Propeller (TTP) air pollutant emissions between diesel and LNG
engines for 2011 – 2015 (a) and 2016 and later (b). The 3 selected application cases are shown.
Diesel engines will be equipped with SCR deNOx catalyst for 2016 and later.
0%
10%
20%
30%
40%
50%
60%
70%
80%
90%
100%
Short Sea (MDO) Port ship (EN590) Inland ship (EN590)
LNGrelativetoDiesel
NOx
SOx
PM
Reduction with LNGDiesel = 100%
0%
10%
20%
30%
40%
50%
60%
70%
80%
90%
100%
Short Sea (MDO) Port ship (EN590) Inland ship (EN590)
LNGrelativetoDiesel
NOx
SOx
PM
Diesel = 100%
Reduction with LNG
5. TNO report | TNO-RPT-2011-00166 | 1.0 5
Economic aspects
The cost of an LNG engine plus LNG fuel tank system is about twice as high as a diesel
engine plus fuel tank. Also the physical installation of the LNG fuel tank on board of a
ship can be an issue - especially application on the tug is critical. Additional costs of
SCR catalysts necessary for diesel engines in 2016 and later represent only 25% of the
additional costs of the LNG fuel system plus storage. A comparison of LNG with HFO
diesel plus SOx scrubber and fuel treatment was not included in this study.
The economic case for LNG comes from a lower LNG energy price compared to the
price of MDO, MGO or EN590 in order to earn back the additional investment.
A detailed evaluation of future LNG fuel prices was outside of the project’s scope.
Conclusions
The case study led to the following conclusions:
− Well-to-Propeller (WTP) greenhouse gas emissions with the most logical LNG
chains are about 10% lower than the diesel fuel chains. Further improvement is
possible by lowering the relatively high methane (CH4) emissions of the engines
(see Figure 1).
− Replacement of diesel fuel with LNG for the maritime sector offers large
advantages in air pollutant emissions, and it will probably already today meet the
requirements of Tier III and CCNR IV, which will enter into force in 2016.
Incomplete information leads to uncertainties though (see Figure 2a).
− After 2016, when compared to Tier III /CCNR IV-compliant diesel fuelled engines,
LNG will still offers benefits in the area of PM, SOx, and CO2 Well-to-Propeller.
The benefits in NOx emissions performance will however become smaller (see
Figure 2b).
− Further greenhouse gas emission reductions for both LNG and diesel are possible
by using biofuels. LNG can be replaced by bio-LNG or LBG (Liquefied Bio Gas),
without any impact on maintenance. Diesel can be replaced by biodiesel, HVO
(Hydrotreated Vegetable Oil), PPO (Pure Plant Oil) or possibly even pyrolysis
liquid, but these fuels may require engine adaptations and increase maintenance.
− Application of LNG is economically viable if the fuel price is low enough to
compensate for the additional costs of the LNG fuel storage system. The cost of an
LNG engine plus fuel tank is about twice as high as a diesel engine plus fuel tank.
Under the assumptions made in this study, short sea (from 2016) and inland
shipping (already now) seem to offer an attractive case, with realistic LNG price
discounts of 2.5 EUR/MMBTU and 2.1 EUR/MMBTU below prices of diesel fuel,
respectively, for payback within 10 years, and 4.4 EUR/MMBTU and 3.9
EUR/MMBTU below diesel fuel for payback within 5 years.
With the current conventional design, the harbour vessel (tug) would require a
much longer payback time or a very large LNG price discount in comparison with
diesel (10.3 EUR for a payback in 10 years). However, the tug case is expected to
benefit from a hybrid-electric type propulsion system.
6. TNO report | TNO-RPT-2011-00166 | 1.0 6
Recommendations
Since the obtained engine emissions data did not fit well the load pattern, especially for
the tug application, it is recommended to measure or obtain more detailed (real-world)
emissions data. Precise NOx and methane (CH4) emissions data is especially necessary.
Other recommendations are:
− To investigate potential for improvement of CH4 emissions from engines
− To study options for lower cost LNG tanks, such as with alternative insulation
and/or atmospheric (rather than pressurised) configuration.
− Specifically for tugs (harbour ships), follow-up work could explore hybrid drive
systems1
, which may reduce energy consumption and also reduce costs of LNG
storage and engines making the LNG application more attractive.
1
See for example [Offshore 2010] and [SMIT E3 Tug]
7. TNO report | TNO-RPT-2011-00166 | 1.0 7
Contents
Managementuittreksel................................................................................................... 2
Summary ........................................................................................................................ 3
1 Introduction.................................................................................................................... 8
1.1 Background...................................................................................................................... 8
1.2 Stakeholders..................................................................................................................... 9
1.3 Objective and activities.................................................................................................. 10
2 Method.......................................................................................................................... 11
2.1 Description of selected cases ......................................................................................... 11
2.2 Project activities............................................................................................................. 12
3 Results........................................................................................................................... 14
3.1 Well To Tank energy analysis ....................................................................................... 14
3.2 Well To Tank emissions analysis .................................................................................. 17
3.3 Well to Propeller greenhouse gas emissions.................................................................. 21
3.4 Tank To Propeller air pollutant emissions analysis ....................................................... 24
3.5 Economic comparison.................................................................................................... 33
4 Discussion ..................................................................................................................... 39
5 Conclusions................................................................................................................... 42
6 Recommendations........................................................................................................ 43
7 References..................................................................................................................... 44
8 Signatures..................................................................................................................... 46
Appendices
A Appendix A: LNG Compositions
B Appendix B: WTP emissions
8. TNO report | TNO-RPT-2011-00166 | 1.0 8
1 Introduction
1.1 Background
Traditionally, natural gas has been liquefied only to transport it to the markets, where it
is distributed as natural gas after regasifying. For over forty years LNG has been
shipped by carriers with large cargo volumes from liquefaction plants that have been
constructed in regions with large natural gas reserves and less local demand.
With its relatively high energy density, LNG is a very suitable fuel for transport over
long distances. Using LNG as a clean shipping fuel fits with the aim of making ports,
inland waterways and short-sea shipping as well as ferrying and fishing more
sustainable. Until now, the use of LNG as a transport fuel is limited, this mainly being
due to the relatively expensive infrastructure such as cryogenic tanks. Never the less
several transportation companies and gas suppliers in the Netherlands are currently
investing in road transportation with LNG trucks. Primary reasons for using LNG are
the lower noise and pollutant emissions levels of the trucks. With respect to ships, in
Norway a number of ferries, offshore supply vessels and navy vessels are equipped with
LNG engines. Furthermore ship owners/operators in the Baltic Sea are evaluating use of
LNG as marine fuel for different vessels. LNG tankers are then also required to ship
LNG from large terminals to break bulk terminals.
Already within the EU the maximum level of sulphur in ship fuels used in ports and on
inland waterways is 0.001%. In Emission Control Areas (ECAs) the maximum level of
sulphur in fuel is set at 1.0%, and the requirements will be further tightened to 0.1% in
2015. It is expected that the use of LNG as an alternative to low sulphur gasoil or
scrubbers will be more cost effective. Technically there are no obstacles, and while the
small scale LNG supply chain is being completed it can count on various outlets such as
trucks, trains and even stationary customers such as decentralised power plants.
Besides the potential of being a cleaner fuel, the global importance of LNG will grow as
oil is getting scarcer and locally produced gas does not fulfil demand anymore. This is
also the case for the Netherlands - after producing the Groningen gas field for almost
fifty years, in Rotterdam the Gate LNG regasification terminal is being constructed in
what will be the first step of entering imported LNG into the gas grid of the
Netherlands.
As the traditional LNG infrastructure comes into place the possibility of connecting to a
small scale supply chain to provide LNG as a fuel comes into the picture. Using the
existing infrastructure from Gate or the Gasunie Peakshaver, connecting to a small scale
supply chain should be less expensive, and that would make the use of LNG as a fuel
for transport economically feasible.
Of course Rotterdam, being the gateway to Northwest Europe, is a perfect location for
introduction of LNG as a fuel for heavy transportation. From Rotterdam goods find
their way to almost 500 million Europeans by inland vessel, truck, train or coaster, with
the option to use LNG as fuel. The establishment of a small scale LNG supply chain
also fits into the ambition of Rotterdam as being the sustainable energy port, as well as
the gas roundabout policy of the Dutch government. The transition to LNG fuel will
9. TNO report | TNO-RPT-2011-00166 | 1.0 9
also have an economic incentive for maritime equipment suppliers and service
providers and will challenge the local technological knowledge base for new product
developments.
Given this context, the claim of LNG being a cleaner fuel needs to be analysed by
independently covering every step from oil and gas production, refinery or liquefaction,
transport and storage to the actual combustion in a ship engine - what is known as a
‘well-to-propeller’ energy chain. In addition to that, this project briefly touches upon
the economic effect on the shipping costs of LNG versus Diesel fuel.
This project is part of a shared vision of TNO, the Maritiem Innovatie Programma
(MIP) and a large number of sector stakeholders: remove innovation barriers that are
being observed by entrepreneurs which are establishing the LNG chain, such as lack of
legislation, unknown permit conditions and absence of a knowledge base for safety with
LNG technology.
Evaluating the potential emission reduction of LNG as fuel for shipping is only an
important first step. While LNG is in the picture as a transport fuel for both suppliers
and end users in the chain, there is yet to be a breakthrough. With the increasing
possibilities to transfer LNG from traditional LNG supply routes to smaller quantities,
the supply of LNG as fuel will no longer be an obstacle in the near future. However,
one key obstacle to establishing an economically feasible logistical chain is the issue of
who commits to the first extra measures that have to be taken. By performing this kind
of projects collectively in the form of Joint Industry Projects (JIP), the required effort to
take these extra measures is strongly reduced.
The results of this project can be applied for knowledge transfer and establishment of
individual business cases. To have a complete picture though, a clear overview must be
gained of the required links in the fuel infrastructure, such as delivery and receipt of
LNG from bunker ships, land-based or on-board storage and transfer systems as well as
systems for propulsion and storage on board receiving ships.
1.2 Stakeholders
A large group of stakeholders participated in the project. The group covers the whole
range of stakeholders for the small scale LNG supply chain and the use of LNG as fuel
for shipping. The following organizations participated in the project:
− Port of Rotterdam:
Participating in this project fits in the port’s ambition of environmental
sustainability. The Port of Rotterdam plays an important role in identifying suitable
locations for the small scale supply infrastructure and to ensure the safety of port
operations such as LNG bunkering.
− Fuel suppliers, facilitators and energy companies (Shell, Argos, GdF-Cofeley,
Gasunie, Vopak and Dong Energy) will play an important role in the establishment
of the small scale LNG supply chain. These companies have to decide whether or
not to invest in this new infrastructure. This will also directly influence their current
business.
10. TNO report | TNO-RPT-2011-00166 | 1.0 10
− Ship and engine producers:
Marine contractors, designers and engine suppliers (Pon Power, Wärtsilä, Rolls-
Royce, GE Jenbacher) are involved in the development and manufacturing of the
gas-fueled propulsion systems of the ships.
− Ship operators:
Anthony Veder is involved in relatively small scale LNG distribution in Norway,
SMIT is a large, internationally operating, tug service provider.
The stakeholders provided the following type of information to the project:
− Information on standard load patterns, engine efficiencies and emissions was
supplied by Damen Shipyards, SMIT, GE Jenbacher, PON, Rolls Royce and
Wärtsilä. The last 4 (engine suppliers) also provided information on engine costs.
− Information on fuel costs was provided by Shell, Gasunie, Gate and VOPAK.
The precise cases and fuels to be included in the project were defined in the kick off
meeting with the involvement of almost all the project participants.
1.3 Objective and activities
The objective of this project is to make an environmental and economic comparison of
diesel fuel and LNG for sea ships and inland ships. The environmental comparison
includes a well-to-propeller (WTP) comparison of greenhouse gas emissions (CO2, N2O
en CH4) and a tank-to-propeller (TTP) comparison of air quality related emissions
(NOx, SOx and particulate matter).
The following activities were performed:
− Choice of applications (‘cases’) and fuel chains, including a short summary of
application options in the Netherlands.
− Well-to-propeller greenhouse gas emission (CO2, CH4 and N2O) with an emphasis
on the performance of the various engine types in relation to the applications.
− Tank-to-propeller emissions for air quality (NOx, SOx and particulate-matter).
− Economic aspects, focused on an analysis of the consumption of LNG in relation to
diesel for the various applications and, where relevant, for various engine types.
A more detailed description of the activities can be found in chapter 2. The main results
are presented in chapter 3, followed by a discussion (4), conclusions (5) and
recommendations (6).
11. TNO report | TNO-RPT-2011-00166 | 1.0 11
2 Method
2.1 Description of selected cases
For a good understanding of the impact of LNG as fuel, a distinction is made between
three different applications (cases): Short sea, Port ship, and Inland ship. The precise
cases were defined in consultation with the stakeholders during the kick-off meeting.
The reference diesel fuel is chosen in line with the developments in fuel specification
requirements. The IMO Marpol legislation calls for max 1% sulphur in Sulphur
Emission Control Areas (SECA) starting in 2010 (to be further reduces to 0.10% in
2015). For non-road engines European legislation requires max 10 ppm S starting in
2011. For inland shipping, in practice EN590 with S < 10ppm will be used, since the oil
producers have this fuel available in large quantities for road transportation. This also
means that the fuel can contain up to 7% biodiesel2
.
Table 1 contains an overview of the cases.
Table 1: Cases (applications) defined for LNG study
Application
Specification of
ship and engine
Specification for refuelling
Diesel fuel
2011 - 2015
Diesel fuel
2015/2016
Container f. 800 TEU
Short sea
8400 kW @ 500rpm
Several places - 15-20 day
autonomy required (50% of
autonomy with diesel)
MDO
S < 1.00 %
MGO
S < 0.10 %
tug 80 ton
Port ship
2 x 2500 kW @ 1000rpm
Rotterdam
EN590
S < 10 ppm
EN590
S < 10 ppm
110 m 11,45m Rotterdam bunkering
Inland ship
1125 kW @ 1300rpm
Ludwigshafen return trip on 1
tank: 575km
EN590
S < 10 ppm
EN590
S < 10 ppm
The following LNG chains were considered in the comparison with diesel fuels:
− LNG from Peakshaver Rotterdam: Pipeline gas from North Sea
− LNG from Peakshaver Rotterdam: Pipeline gas from Russia (7000 km)
− LNG supplied as LNG, by tanker ship from the Middle East (Qatar).
2
It has been agreed between fuel suppliers and branch organisations (NOVE, CBRB, VIV, Scheepsbouw
Nederland) to supply fuel without biodiesel for the year 2011.
12. TNO report | TNO-RPT-2011-00166 | 1.0 12
2.2 Project activities
2.2.1 Greenhouse gas emission calculations
The following GHG emissions are addressed for both WTT and TTP:
- CO2 emissions: CO2 from a) energy usage during the production and
transports of the fuel and b) the combustion of the fuel by the ship engines
- Other GHG gases composed of CH4 (methane) and N2O (nitrous oxide)
emissions during production/transports of the fuel and during the combustion
by the ship engines.
These are considered to be the three main greenhouse gas emissions. They are summed
up as a total CO2 equivalent (CO2eq). CH4 and N2O emissions weigh much more heavily
than CO2 emission for global warming. As a result CH4 needs to be multiplied by 25
and N2O by a factor of 298 in order to obtain the CO2 equivalent for global warming
[source: IPCC].
The emissions from WTT (Well To Tank) and TTP (Tank To Propeller) are both
expressed in gram per MJ fuel energy and are then summed up:
CO2eq/MJ = (CO2eq/MJ)WTT + (CO2eq/MJ)TTP (1)
If there is a significant difference in engine efficiency with different fuels, engine
efficiency or the MJ of fuel energy needed for the standard load pattern should be taken
into account. The LNG chain can be directly compared with the diesel chain by
applying the following correction to equation (1):
[CO2eq/MJ]LNG corrected = [(CO2eq/MJ)WTT + (CO2eq/MJ)TTP ] x MJLNG (2)
MJdiesel
This should be done for each case, if there is a significant difference in engine
efficiency.
2.2.1.1 TTP analysis
The CO2 emissions are directly linked to the H-C ratio of the fuel. The more energy is
derived from oxidation of H to H2O rather than oxidation of C to CO2, the lower the
specific CO2 emission expressed in gram per MJ fuel energy combusted (g/MJ).
In addition to this CH4 (methane) and N2O emissions are obtained or estimated and
multiplied by their global warming factor of respectively 25 and 298.
2.2.2 Air pollutant emissions
The air pollutant emissions of the ships are addressed from a Tank To Propeller
perspective. The following emissions were evaluated:
- Nitrogen oxide: NOx
- Sulphur oxide: H2SOx
- Particulate Matter (or Particulate Mass): PM
13. TNO report | TNO-RPT-2011-00166 | 1.0 13
SOx can be split up in SO2, which is gaseous and H2SO4 or sulphate which is a part of
the PM. H2SO4 is hygroscopic. As a result of that, the PM weight then also grows
because of adsorbed H2O.
Non Methane Hydrocarbons (also referred to as Volatile Organic Components, VOC)
and carbon monoxide (CO) are not addressed, because those emissions are more than an
order of magnitude smaller than NOx and are considered less harmful for several
reasons. Firstly the ambient concentrations of only NOx and PM are close to and
sometimes surpass the European limit values. Furthermore the air pollutant external
costs (estimates of negative impacts to society) of NOx, PM and SOx are much higher
than for NMVOC (Non Methane VOC). Air pollutant costs include health costs,
building damage, agriculture costs (crop damage) and costs for loss of biodiversity. In
[Maibach 2008] the following numbers are given (reference year 2000):
- NOx: 6600 EUR/tonne
- PM: 422,500 EUR/tonne
- SOx: 13000 EUR/tonne
- NMVOC: 1900 EUR/tonne
Typical NOx (and in case of HFO also SOx) mass emissions are a factor 10-100 higher
than PM and NMVOC emissions. This makes NOx as costly as PM in practise and
NMVOC relatively less important.
The following method was primarily used to evaluate the air pollutant emissions:
− The ship operators were asked to provide the usage pattern of the ship including 4
to 5 characteristic engine operating points. Other load points or transient operating
conditions are not expected to play a significant role in the emissions evaluation.
− The engine manufacturers were asked to provide the emissions data (primarily NOx
and PM) for these characteristic load points.
− SOx emissions were calculated from the fuel sulphur content.
2.2.3 Economic comparison of LNG vs Diesel, based on fuel and on-board equipment costs
Simple calculations were carried out based on figures provided by project participants
and, where needed, expert opinion and brief market consultations. The comparison
focused on the fuel costs and on board equipment costs (mainly engine, aftertreatment
and fuel storage system). For the diesel engines for the year 2016 and later, the
estimated costs of an SCR aftertreatment system were included.
Although an evaluation of future LNG fuel prices was outside of the project’s scope, it
is not expected that long term LNG prices will increase at a higher rate than crude/oil
prices.
Operational costs (maintenance, repair) were judged to be equivalent for both fuels
based on feedback of the engine manufacturers and hence not included. After a brief
consultation, it was also decided not to include potential reductions in fees and
incentives offered by the Port of Rotterdam/inland shipping authorities for LNG (e.g.
ESI, Green award) – while these can amount to 5-10% in some cases, their timing and
application is complex. Other costs which lie outside the scope of this project were not
considered, such as Safety, Education, PR. Since they are relevant for widespread use of
LNG in shipping, it is recommended that they are looked at in follow-up projects.
14. TNO report | TNO-RPT-2011-00166 | 1.0 14
3 Results
This chapter describes the 6 selected fuel production pathways and their Well To Tank
(WTT), Tank To Propeller (TTP) and Well To Propeller (WTP) emissions. All
pathways are chosen for the Dutch situation, i.e. all fuels are delivered and used in The
Netherlands.
For LNG, the following Well to Tank pathways were defined:
− LNG 1 transition path:
For this LNG pathway LNG from Qatar is transported over 10000 km by vessel to
Rotterdam, Gate terminal. From there it is transported as a liquid to a breaker bulk
terminal which can either be near the Gate terminal or this can be combined with
the peakshaver.
− LNG 2 transition path:
For this LNG pathway Dutch natural gas from the North Sea or Slochteren is
transported to and liquefied in Rotterdam at the peakshaver. At the same location a
breaker bulk terminal to load ships is realised.
− LNG 3 transition path:
For this LNG pathway Russian natural gas from Siberia is transported over 7000
km by pipeline to Rotterdam and liquefied in the peakshaver. At the same location
a breaker bulk terminal to load ships is realised.
The LNG pathways are compared to three liquid fuel pathways, namely: HFO,
MDO/MGO and EN590 low sulphur diesel.
3.1 Well To Tank energy analysis
The determination of the required energy for production of a fuel is a very complex task
because fuel sources and refineries are very different and the allocation of certain
energy quantities to products is based on several assumptions. In this study for LNG
three very different but realistic pathways are chosen. The diesel, MDO/MGO and HFO
pathways are related because they are products of one refinery which is a state of the art
production plant in The Netherlands.
3.1.1 Introduction LNG
Natural gas as recovered from the underground contains mainly methane (CH4), but it
also contains heavier gaseous hydrocarbons such as ethane (C2H6), propane (C3H8),
butane (C4H10) and sometimes pentane (C5H12). Some other heavier hydrocarbons are
removed prior to liquefaction. Other gases such as carbon dioxide (CO2), nitrogen (N2),
oxygen (O2), hydrogen sulfide (H2S) and water are also often present. At the
liquefaction process all CO2, H2S, water and heavier hydrocarbons (C5+) are removed.
Natural gas contains small amounts of helium too, and is the main source of helium
production. Small amounts of mercury may also be present. The exact composition
varies from one field to another.
The methane content of LNG is typically 70-90 %, ethane 5-15 %, propane and butane
up to 5%. Water, CO2, sulphur compounds, heavy HCs and mercury (if present) must
be removed before liquefaction.
So the treatment before liquefaction of the LNG depends on the composition of the
natural gas as well as presence of LPG extraction facilities and for each type of natural
gas the treatment can differ.
15. TNO report | TNO-RPT-2011-00166 | 1.0 15
In Appendix A, a list of typical LNG compositions is reported [GIIGNL 2009].
3.1.2 Production and delivery of LNG
The principal steps and transitions from well to tank for LNG are:
1. Production of the natural gas
2. Treatment [Groen 2010], [Kohl 1997], [Butts 1995], [Howard 1998]
- Condensate removal
- CO2 removal
- Dehydration
- Mercury removal
- Potentially LPG extraction
- H2S removal
3. Transportation
4. Refrigeration and liquefaction
-During liquefaction a lot of the components (i.e. O2 and N2) with a lower
liquefaction temperature than methane will be removed.
5. Storage and loading
-When boiling of LNG occurs during storage the extracted vapour is mainly
gaseous methane and nitrogen.
6. Bulk Transportation in large LNG carriers
7. Storage in regas terminal
7. Secondary LNG distribution
8. Tank filling
3.1.3 Energy content of LNG
The caloric value of LNG depends on the type of mixture and the method of production
which is considered. When a well to tank analysis is performed the amount of energy
which is used to produce the “tank product” has to be taken into account.
To make it more complicated for a calculation: sometimes in the modern processes the
heavier hydrocarbons will be (partly) removed from the natural gas (e.g. for LPG
production) whereby the energy content per kg of the LNG decreases, the energy for
production increases and an additional energy line exists.
Examples/facts Higher Calorific Value [GIIGNL 2009]:
LNG Algeria 54,1 MJ/kg
LNG Indonesia 54,5 MJ/kg
LNG Egypt 55,2 MJ/kg
Yemen 50,1 MJ/kg
An overview of LNG specification from sources around the world is presented in
Appendix A.
3.1.4 Situation for LNG usage in The Netherlands
LNG can currently be bought in Norway, Spain, Belgium, France, Italy and the UK
(depending on whether it will be re-exported by truck or small LNG carrier) but for the
scope of this project the best assumption is probably to focus on the type of LNG which
could be delivered at the Gate terminal because this will soon be the most obvious
landing spot for LNG for use in the Netherlands.
16. TNO report | TNO-RPT-2011-00166 | 1.0 16
Basically for Gate-LNG the basic NG composition at the well is unknown and its
composition after cleaning too. Subsequently, the origin of the LNG delivered to the
Gate terminal is unknown and therefore so is the transport distance.
3.1.5 Assumptions for the energy footprint of LNG
In the production and delivery of LNG three main issues determine the energy footprint:
1. Composition of the natural gas at the well.
2. Applied liquefaction process.
3. Distance of transportation.
Although the origin of the gas is unknown, in energy sense a best, mean or poor
situation can be defined for any of these 3 issues. This basically leads to a 3
dimensional matrix of combinations, where each element must be filled with the
required amount of energy.
Liquefaction is the process which costs the most energy. There are many different
processes and there is significant research on that item at the moment. Still most
liquefaction plants are of the pre-cooled mixed refrigerant type (C3 precooled MR)
[Barclay 2005].
For the Qatar case, LNG production in Qatar and transport to Gate Rotterdam, the
following steps are evaluated:
1. Production
Circumstances in the Middle East are quite favourable. Installations are land based and
the composition of the gas from the well is quite good with limited amount of CO2 and
N2. Consequently 1.2% energy consumption is estimated for the production process.
2. Purification
The following gas composition was taken for purification: 5-15% CO2 + N2, 1-3% H2S
and 1-3% water. Applying a conservative calculation, it was calculated that about 640
kJ is needed per kg of gas.
3 Liquefaction
In Qatar, the pre-cooled mixed refrigerant type (C3 precooled MR) is used. This is
relatively well described [Barclay 2005]. The energy consumption is about 3700 kJ/kg.
4. Transportation
The energy consumption due to heat input from the ambient during transportation is
much larger than energy needed to move the ship. To maintain cryogenic temperatures
some LNG is continuously vaporised. A part of it can be used by the engines. With the
newest ships, the vaporised LNG is however re-liquefied and added to the stored LNG
again. For this case (transport from Qatar to Rotterdam), a relatively new ship is chosen
with a ratio between energy needed for cooling and for the engines of a factor of seven.
In combination with the transportation distance via the Suez Canal of about 10,000 km,
this resulted in an energy consumption of 2140 kJ/kg LNG.
5. Terminal
The energy footprint here consists of the energy needed for off-loading from the ship
and the heat input during storage at the Gate terminal. Gate is a terminal with high
throughput since the majority of the gas is vaporised and added to the pipeline
17. TNO report | TNO-RPT-2011-00166 | 1.0 17
infrastructure. So energy consumption for heat input during storage is small.
Consequently for this case, a relative low value within the range specified by Shell was
chosen.
6. Distribution
For the distribution from the Gate terminal to the ships, there are several options. The
first option is a pipeline of 3 km from the gate terminal to the peakshaver LNG storage
facility with a ship bunkering facility at the peakshaver. The second option is a breaking
terminal at Gate to lead bunker ships. The energy consumption and CO2 emission is not
analysed in detail. Instead 50% is used of the estimation form ECN/JRC for distribution
for road transportation. Bunkering of ships should be more efficient due to the much
larger quantities.
An overview of the Well to Tank (WTT) energy consumption is presented in Table 2.
The values are given in kJ/kg and in kJ/MJ. For the latter the energy content of LNG of
49 MJ per kg is used.
In Table 3, the results are compared to typical ranges used by the LNG industry
depending on the natural gas source, the process equipment used and the transportation
distances. It can be seen that the calculated values of this study are within this range.
Table 2: WTT energy consumption for different LNG pathways, mass based and energy based
Qatar, Qatar to Rotterdam
[kJ/kg] [kJ/MJ]
Production 600 12.2
Purification 640 13.1
Liquefaction 3700 75.5
Transport 2142 43.7
Terminal 270 5.5
Distribution 525 11
Table 3: WTT energy consumption for different LNG pathways, energy based
Qatar typical - range
[kJ/MJ] [kJ/MJ]
Production 12.2 10-40
Purification 13.1
Liquefaction 75.5
70 - 110
Transport 43.7 5 - 60
Terminal 5.5 5 - 15
Distribution 11
3.2 Well To Tank emissions analysis
3.2.1 CO2 emissions
LNG Qatar – Rotterdam
In Table 4, an overview of the CO2 emissions is given for the WTT part. The CO2
emission in g/MJ is calculated using a specific CO2 emission of 56 g/MJ. This is
18. TNO report | TNO-RPT-2011-00166 | 1.0 18
assuming that all energy needed is coming from natural gas with high methane content.
Possible direct CO2 emission from the purification is not taken into account. This is not
necessary when the associated CO2 is re-injected in the field or used for another
purpose.
The calculated results are compared with those of the ECN and JRC studies [Kroon
2008] and [JRC 2007]. It can be seen that the values compare reasonably well, except
for the CO2 value for transportation and distribution where ECN and JRC indicate a
factor of two higher. For distribution this was an assumption of this study since the
relative energy needed for bunkering ships is lower that for supplying LNG to trucks.
Table 4: WTT CO2 emission: LNG supply to ships, comparison with ECN/JRC
Qatar ECN / JRC
[g/MJ] [g/MJ]
Production 0.7 1.2
Purification 0.7
Liquefaction 4.2
4.7
Transport 2.5 5.5
Terminal 0.3 0.7
Distribution 0.6 1.2*
Total 9.0 13.3*
* CO2 emission of LNG supply for road transportation
LNG peakshaver: NG from North Sea or Russia via pipeline
Energy consumption and CO2 emission of the pipeline transport of about 7000 km from
Russia vary strongly depending on the reference: [Kroon 2008] gives for the transport a
range from 6% to about 20% for the energy consumption. Corresponding CO2 emission
would range from 3.4 to 10.2 g/MJ. The latter value was chosen, and also used here.
For the liquefaction of the peakshaver a 20% higher energy consumption and CO2
emission is used, because of the small scale installation compared to a typical large
scale installation such as in Qatar. The values are given in Table 5 below.
Table 5: WTT CO2 (only) emission for different LNG pathways for ships
LNG Qatar LNG NL
peakshaver
LNG NL peakshaver
gas pipeline 7000 km
Production 0.7 0.7 0.7
Transport gas - 0.5 10.2
Purification 0.7 0.7 0.7
Liquefaction 4.2 5.0 5.0
Transport LNG 2.5 - -
Terminal 0.3 - -
Distribution 0.6 0.6 0.6
Total 9.0 7.5 17.2
3.2.2 Methane emissions
Methane (CH4) emissions can often be avoided by good design of the systems used. For
example at the production well, some unusable methane or leaked methane can always
be flared and does not need to escape as methane. Of course when flared it still
19. TNO report | TNO-RPT-2011-00166 | 1.0 19
contributes to greenhouse gas emission, but it is not multiplied by the factor of 25 for
methane emission. The LNG engines used for transportation probably do emit some 2
to 3% of the fuel used as methane. This is primarily caused by the lean burn operating
principal of the engines and is hard to avoid. At the distribution part of the chain some
methane emission is possible during the filling of tanks. Careful design with very small
dead volumes of filling nozzles and such could avoid this to a large extent, but this is
not always the case.
LNG Qatar – Rotterdam
The following methane emissions are used:
Production:
Different sources give a large range. According to the national emission registration is it
0.007 g/MJ, while JRC gives a value of 0.09 g/MJ. Experts find the high values
unrealistic, so the 0.007 g/MJ is used here.
Purification / liquefaction:
The value provided by the JRC study of 0.04 g/MJ is used here.
Transport / shipping:
Based on the energy consumption of the ships of 44 kJ per MJ of LNG and a specific
methane emission of the engines from 2-3% the methane emission is about 0.02 g per
MJ of LNG transported. This value is used.
Terminal:
Due to large quantities which are pumped, no significant methane emission will occur:
0 g/MJ is used.
Distribution:
A leakage of 0.5 kg methane per 100 m3
LNG bunkered is equivalent to 0.0002 g
methane per MJ. So even a 10x larger leakage (for example when disconnecting the
filling nozzle) would be negligible. Consequently 0 g/MJ is used.
The methane emissions are summarized in the table below.
Table 6: WTT methane emission from LNG supply from Qatar to Rotterdam for ships
Methane [g/MJ] Remark / Source
Production 0.007 from national emission registration
Purification
Liquefaction
0.04 JRC 2007
Transport 0.02 calculated
Terminal 0 leakage negligible
Distribution 0 leakage negligible
LNG peakshaver: NG from North sea or Russia via pipeline
For most steps within the chain, the same values for methane emissions are used as for
LNG from Qatar. For the pipeline transport from Russia, the value from [Kroon 2008]
is used: 0.19 g/MJ of CH4. This corresponds to a gas leakage of about 1%.
20. TNO report | TNO-RPT-2011-00166 | 1.0 20
Table 7: WTT methane emission for different LNG pathways for ships
Methane LNG Qatar NL Peakshaver NL Peakshaver
pipeline 7000 km
[g/MJ] [g/MJ] [g/MJ]
Production 0.007 0.007 0.007
Transport gas - 0.01 0.19
Purification
Liquefaction
0.04 0.04 0.04
Transport LNG 0.02 - -
Terminal 0.00 - -
Distribution 0.00 0.00 0.00
3.2.3 N2O emissions
[ECN 2008] uses the value zero for N2O for the well to tank emissions. This is also
used for this study. In another study a value of around 10-5
g/MJ is used for both the
production as well as the transportation of the LNG. This would be equivalent to about
1% of the WTT GHG emission.
3.2.4 Well To Tank emissions 6 pathways
In Table 8 the WTT-emissions of 6 fuel pathways are summarised. The detailed
emissions are reported in Appendix B.
Table 8: WTT emissions 6 fuel pathways in g CO2eq/MJ
LNG Qatar LNG NL
peak shave
LNG NL
pipeline
7000 km
HFO MGO /
MDO
EN590 10
ppm S
WTT summary
CO2 9.0 7.5 17.2 9.1 12.0 13.8
CO2 equivalent of CH4 1.7 1.4 5.9 0.7 0.7 0.7
CO2 equivalent of N2O 0.0 0.0 0.0 0.0 0.0 0.0
Total WTT 10.7 8.9 23.1 9.8 12.7 14.4
For refinery products such as HFO, MDO/MGO and EN590 diesel fuel it is hard to
determine the allocation of energy/emissions into products because refinery energy
structures are very complex and diverse. In this study the following assumptions have
been made:
− Energy consumption and emissions of the most complex product (EN590 diesel
fuel) with the highest numbers have been marked as the reference.
− The WTT-emissions of the products with lower quality can be derived from the
reference because production processes are similar but less complex.
The diesel transition path is very well studied by different parties. It consists of the
following steps:
− Exploration
− Crude oil transport
− Refining
− Distribution
21. TNO report | TNO-RPT-2011-00166 | 1.0 21
HFO transition path:
Heavy fuel oil is mainly produced in the first distillation step, i.e. this product requires a
relatively low amount of energy because no further energy consuming processes are
needed. The amount of energy for distillation is 60% of the required energy of an
EN590 diesel fuel [Bredeson2009] and the WTT emission is 9.8 g CO2eq/MJ.
MGO/MDO transition path:
These two diesel fuels require less energy for production than EN590 diesel fuel
because their sulphur content is higher (less desulphurization) and the density
specifications are broader.
In literature no data were found about the MGO/MDO production. The estimated
amount of energy for distillation is 90% of the required energy of an EN590 diesel fuel
and the WTT emission is 12.7 g CO2eq /MJ.
EN590 diesel transition path:
Sulphur free EN590 diesel fuel is the most extensively processed diesel fuel and
consequently its WTT emission is relatively high. The value 14.4 g CO2eq/MJ
corresponds to [JRC 2007]. For MDO/MGO and HFO less treatments of the fuel are
needed and consequently their WTT-emissions are lower.
In The Netherlands crude oil from many sources has been refined to products and
exported. For this study an average crude oil transport distance of 8000 km and an
average Dutch refinery have been chosen.
3.3 Well to Propeller greenhouse gas emissions
The Well To Propeller (WTP) greenhouse gas emissions are calculated by adding up the
Well To Tank (WTT) and the Tank To Propeller (TTP) emissions.
The WTT values were determined in section 3.2.
3.3.1 Tank to propeller emissions
The TTP part consists of the following:
- The direct CO2 emissions of the combustion of the fuel
- The indirect CO2 emissions composed of CH4 (methane) and N2O emissions of
the engines.
The direct CO2 emissions are directly linked to the H-C ratio of the fuel (in case of
biofuel also to possible CO branches with single or double bonds). The more energy is
derived from oxidation of H to H2O rather than oxidation of C to CO2, the lower the
specific CO2 emission expressed in gram per MJ fuel energy combusted (g/MJ). The
specific CO2 emissions can for example be found in [Vreuls 2009]. The values for
combustion are as follows:
- Gasoil / diesel oil (EN590, MDO, MGO): 74.0 g/MJ
- Heavy Fuel Oil (HFO): 77.3 g/MJ
- Natural gas: 56.1 g/MJ
These values correspond to the IPCC good practice guidance for national greenhouse
gas inventories workbook, section 1.6.
22. TNO report | TNO-RPT-2011-00166 | 1.0 22
Apart from the fuel composition the CO2 emission is dependent on the engine
efficiency. The lower the engine efficiency, the more MJ fuel needs to be combusted in
order to have a certain mechanical work output.
The engine efficiency is analysed in section 3.4.3. It is estimated that the efficiency of
the gas engines for the 3 cases is only 0-2% lower than that of the diesel engines. This
means that the WTP analyses can be done on a gram per MJ fuel energy basis, without
special correction for engine efficiency.
Methane (CH4) and N2O emissions weigh much more heavily than CO2 emissions for
global warming. As a result CH4 needs to be multiplied by 25 and N2O by a factor of
298 in order to obtain the CO2 equivalent for global warming.
The methane emissions of the applicable lean-burn spark ignition and (also lean-burn)
compression ignition engines are rather high.
According to [Engelen 2009] the average methane emission of stationary lean-burn gas
engines is 1200 mg C per Nm3 (normal-m3
) at 3% O2. Also refer to [Olthuis 2007].
The gram per MJ CH4 emission can be calculated as follows:
- at 3% O2 the exhaust flow is 16.36 m3/kg fuel or 61 g fuel / Nm3
- 1200 mg C = 1.2 g C = 1.6 g CH4 (per Nm3)
- Slip percentage: 1.6/61 = 2.6% or 26 g/kg
- Lower combustion value of LNG is: Ho= 49 MJ/kg
- Methane emission is 26/49 = 0.53 g/MJ
In combination with the multiplying factor of 25 for CH4, the CO2 equivalent will be:
25 x 0.53 = 13 g/MJ fuel energy.
From one gas engine supplier detailed CH4 data was submitted. This indicated a
relatively constant slip percentage of around 20 g/kg at high loads to a rather variable
slip percentage between 25 and 85 g/kg at very low power points. This means that there
is a risk of higher specific CH4 emission for applications such as the tug with a low
power load pattern.
N2O emissions are generally very small for both diesel and gas engines. If significant
N2O emissions were measured, it was related to a poorly functioning catalyst (oxidation
catalyst or 3-way catalyst). Refer to [Havenith 1995]. In a TNO study of four fuels for
passenger cars, the global warming potential of N2O was always below about 1.2% of
the global warming potential of the CO2 emissions [Hendriksen 2003]. The four fuels
were petrol, diesel, CNG and LPG. For this study a CO2 equivalent value for N2O of 0.4
g/MJ is used for all engines. This corresponds to about 0.6% of the CO2 emission itself.
3.3.2 Well To Propeller emissions
In this section the results of the Well To Tank analysis (section 3.2) and the Tank To
Propeller analysis (section 3.3.1) are combined. The overview is presented below.
23. TNO report | TNO-RPT-2011-00166 | 1.0 23
Table 9: Overview Well To Propeller (WTP) GHG emissions of 6 fuel pathways. Split in Well To Tank (WTT) and Tank To Propeller
(TTP) emissions in g CO2eq/MJ.
LNG Qatar LNG NL
peak shave
LNG NL
pipeline
7000 km
HFO MGO /
MDO
EN590 10
ppm S
WTT summary
CO2 [g/MJ] 9.0 7.5 17.2 9.1 12.0 13.8
CO2 equivalent of CH4 [g/MJ] 1.7 1.4 5.9 0.7 0.7 0.7
CO2 equivalent of N2O [g/MJ] 0.0 0.0 0.0 0.0 0.0 0.0
Total WTT [g/MJ] 10.7 8.9 23.1 9.8 12.7 14.4
Tank To Propeller (TTP)
CO2 [g/MJ] 56.1 56.1 56.1 77.3 74.0 74.0
CO2 equivalent from CH4 [g/MJ] 13.0 13.0 13.0 0 0 0
CO2 equivalent from N2O [g/MJ] 0.4 0.4 0.4 0.4 0.4 0.4
Total TTP [g/MJ] 69.5 69.5 69.5 77.7 74.4 74.4
Total WTP [g/MJ] 80.2 78.4 92.6 87.5 87.1 88.8
port ships
inland ships
Sea shipsSea ships, port ships and inland shipsApplication / case
Note: because of rounding, the partial and global sums may not add up exactly with the individual components.
The table clearly shows that path 3, LNG produced in the Netherlands from pipeline gas
from Russia, has a relatively poor performance compared to the other two LNG
pathways. The cause of the poor performance is the high methane emission during
production and transport. If gas needs to come from far away, production of LNG and
shipment as LNG (path 1) is the more environmentally friendly option. It can also be
seen that the global warming potential of the methane emissions of the LNG engines
(13 g/MJ CO2eq.) is very high. Although this justifies specific attention to this point in
the future, it can still be concluded that the two most logical LNG chains - LNG from
NL peakshaver and LNG from Qatar - have a 10% lower GHG emission than the three
diesel fuel chains.
The five most realistic fuel pathways are presented in Figure 3. LNG NL from pipeline
7000 km is omitted because of its poor performance compared to LNG Qatar and
because LNG is already supplied to Rotterdam.
Table 9 and Figure 4 can directly be applied to the three cases because in section 3.4.4 it
is concluded that the differences in engine efficiency are very small (<2%). The
following diesel fuels are applicable to the application cases:
− Short sea: SECA: MDO (2010 – 2015), MGO (2016 ->). Non SECA: HFO
− Port ship: EN590 (2011 ->)
− Inland ship : EN590 (2011 ->)
24. TNO report | TNO-RPT-2011-00166 | 1.0 24
0.0
10.0
20.0
30.0
40.0
50.0
60.0
70.0
80.0
90.0
100.0
LNG Qatar LNG NL
peak shave
HFO MGO/MDO EN590 10
ppm S
CO2eq.WTP
TTP CH4 + N2O
TTP CO2
WTT CH4 + N2O
WTT CO2
Figure 3. Overview annual Well To Propeller (WTP) GHG emissions [g CO2eq/MJ] of the 5 most realistic
LNG and diesel fuel chains, representative for the three application cases evaluated.
3.3.3 Biofuels
For both the LNG engines and diesel engines the WTP greenhouse gas emission can be
strongly reduced by replacing the fossil fuels by biofuels. LNG can be replaced by bio-
LNG, also called LBG (Liquid Bio Gas). Diesel can be replaced by several types of
biofuel of which the suitability will depend on the application. In [van der Steeg 2009] a
number of biofuel options are analysed regarding their suitability for application in
different ship types.
- Pure Plant Oil (PPO) and pyrolyse liquid can be considered for sea ships
- Biodiesel and BTL or HVO (Hydrotreated Vegetable Oil) are good candidates
for inland ships and port ships.
PPO and biodiesel may require engine adaptation and additional maintenance. This is
certainly the case for pyrolyse liquid which required a special corrosion resistant fuel
injection system. It is desirable that the specific engine is delivered by the manufacturer
for the specific fuel or blend. Effects on emissions and maintenance of the regular
biofuels are for example described in [TNO/CE 2009].
Typical values for the reduction in GHG emissions with the use of biofuels can be
found in the Renewable Energy Directive [EC 2009]:
− Biodiesel: 19 – 83% GHG reduction
− Biogas from pure manure: 81 – 82% GHG reduction
When biogas is made via co-fermentation of manure plus corn, the GHG reduction
potential is smaller [Bleuanus 2010].
3.4 Tank To Propeller air pollutant emissions analysis
3.4.1 Fuel consumption and air pollutant emissions
This chapter contains the fuel consumption and air pollutant emissions calculations.
This is done for the three cases for both the reference with diesel engines and the LNG
engines.
25. TNO report | TNO-RPT-2011-00166 | 1.0 25
Information on standard load patterns, engine efficiencies and emissions was supplied
by Damen Shipyards, SMIT, Jenbacher, PON, Rolls Royce and Wärtsilä.
The calculations were made in the following order:
-Step 1: Obtained data was converted to a uniform format;
-Step 2: Calculate the Total (engine) Work [kWh/y] for each case;
-Step 3: Establish a most common load profile for each case;
-Step 4: Calculate BSFC [g/kWh] at the most common load profile for each engine;
-Step 5: Calculate the total fuel consumption [MJ/y] for each engine;
-Step 6: Calculate the specific NOx, SOx and PM emissions for each engine, at the most
common load profile;
-Step 7: Calculate the total NOx, SOx and PM emissions [kg/y].
A schematic of the overall calculation procedure is presented in Figure 4.
3.4.2 Standard load patterns
For confidentiality reasons, the standard load patterns for the three cases cannot be
shown in this report. Still, the main characteristics such as max power and speed,
average power and speed and propulsion type are presented in Table 10. The average
numbers are weighted averages, which means taking into account the number of hours
per year of each load point. This is calculated by multiplying the parameter per mode
point with the number of hours of that mode point, then adding up al mode points and
dividing this by the total number of hours.
Table 10 shows that the average power can be much lower than the maximum power.
This is especially the case for the tug ship with an average power of only 15% of
maximum power. The container feeder (Short Sea) has a constant speed propulsion
system while the other two ship types have a variable speed propulsion system.
Table 10: Specifications of standard load pattern for the three cases
P_max Max speed P_avg SpeedCase
[kW] [%/P_max] [rpm]
Propulsion Emission test
Cycle
Short Sea 8,400 500 45% 500 Constant speed E2
Port ship 2x 2,500 1000 15% 668 Variable speed E3*
Inland ship 1,250 1500 73% 1,171 Variable speed E3
* not representative for tug application
3.4.3 Engine data
For each case, engine data was provided of one (reference) diesel engine and two or
three LNG engines. In Table 11 an overview is given of the specific engine types for
which energy consumption and emissions data was made available. The table also
shows the engine technology (lean-burn/spark ignition or dual fuel) and the maximum
power output. In some cases, the maximum power of the gas engine is lower than for
the reference diesel engine. This is especially the case with the short sea application
where the power for one LNG engine is almost 17% lower. The reference diesel engine
for the tug (port ship) is normally a Caterpillar engine, but no data for this engine was
available. The Jenbacher engine is a stationary engine, normally applied for total
energy.
26. TNO report | TNO-RPT-2011-00166 | 1.0 26
Table 11: Engine data
PmaxCase Fuel Brand Type Injection
[kW]
Diesel Wärtsilä 8L46 (DE) Conventional 8,400
Rolls Royce B35:40V16AG Lean burn 7,000
Wärtsilä Wärtsilä 8L50 DF (DE) Micropilot/dual fuel 7,600
Short sea
LNG
Wärtsilä Wärtsilä 9L50 DF (DE) Micropilot/dual fuel 8,550
Diesel Wärtsilä 8LW26 (AE/DE) Conventional 2,600
Rolls Royce C26:33L9AG Lean burn 2,430Port ship
LNG
Jenbacher J616 GS Lean burn 2,745
Diesel Caterpillar DM8467 Conventional 1,118
Jenbacher J416 GS Lean burn 1,161Inland ship
LNG
Caterpillar 3512 dual fuel Dual Fuel 1,118
The completeness of the data varied from reasonably complete to very incomplete. This
was different for the several required parameters:
- Fuel or energy consumption (and thus CO2): reasonably complete for most engines
- NOx: As a function of load or power for several engines, only average numbers or
targets for other engines.
- PM: hardly available except for average reduction percentage (target).
- CO and NMHC: available for some engines as a function of load or power
- Methane (CH4): available for only a few engines
Even if the data was specified as a function of load or power, it generally did not fit
exactly to the load points of the standard load patterns. Also, the Port ships and Inland
ships have variable speed load patterns, but in several cases only constant speed data
was available.
Taking into account the limited level of completeness of the data, the data was
processed as follows (also refer to the flow chart in Figure 4 below):
− The fuel or energy consumption at the key points was calculated using linear curve
fits in which energy consumption (in MJ/h) is presented as a function of engine
power and engine load. The latter are called Willans Lines. This fit is generally
quite linear, even at very low load or power. The energy consumption at zero torque
represents the friction torque of the engine. In one case with insufficient points at
low load the friction torque is manually set to 7.5% of the max torque. The constant
speed data is converted to variable speed values. For example the torque as a
function of fuel per revolution is kept constant across a certain part of the speed
range.
− Specific emissions were used as specified for the standard test cycle (usually E2 or
E3). Only for the port ship (the tug) a correction was done for the low average
power of 15% of Pmax. The correction was based on the specific energy input or
BSFC. This lead to a correction (increase) of about 20% for the specific emissions
NOx and PM.
− SOx emissions are calculated from the (actual) fuel consumption.
It should be noted that for conventional engines the NOx and (a somewhat lesser
extend) PM emissions behave quite linearly with energy consumption and engine
27. TNO report | TNO-RPT-2011-00166 | 1.0 27
torque. For that reason these emissions can be corrected based on the actual or real-
world fuel energy input (or based on the ratio of real-world and nominal specific fuel
consumption). The same principles are applied by [Hollander 2007].
Engine data / engine suppliers Shipping data
engine data NOx literature Key load points trips / activity
fuel consumption PM linit values (load pattern) per year
PM
Willans lines mechenical energy
per year
fuel consumption at key load points
fuel quantity weighted average optional correction for low average power
per year fuel consumption via BSFCreal-world / BSFCnominal
BSFCreal world
SOx per year NOx, PM Emissions per year
based on fuel S content g/kWh NOx, PM
Figure 4. Flow chart of data processing
3.4.4 Energy consumption
The Total work (output) and Total fuel (input) provide the basis for each total emission
calculation. Table 12 compares the diesel engine with all LNG engines (average values
are shown).
The mechanical energy (per year) delivered to the output shaft of the engine is only
dependent on the standard load pattern. This is the same for each engine within one case
(application). The energy input (per year) is determined for each engine, diesel as well
as LNG. The energy input is calculated by using the linear functions of energy input as
a function of power output and then using the standard load points and the time per year
for each point.
The results are presented below. The results for LNG are the average results of two or
three engine depending on the case. Consequently the average engine efficiency is
calculated by dividing the energy output by the energy input (using MJ for both).
The results show that for two cases there is a small decrease in efficiency of 1% or 2%
when replacing diesel by LNG. On the average the decrease is 1% absolute, which is
about 2% relative reduction.
28. TNO report | TNO-RPT-2011-00166 | 1.0 28
Table 12: Energy consumption
Mechanical
energy
(work)
Energy input
(fuel)
Average
Efficiency
Case Fuel type
[kWh/y] [MJ/y] [%]
Diesel 23,905,000 187,794,700 46%
Short sea
LNG 23,905,000 197,534,983 44%
Diesel 1,459,600 14,708,526 36%
Port ship
LNG 1,459,600 14,697,724 36%
Diesel 5,437,500 45,507,525 43%Inland
ship LNG 5,437,500 46,172,531 42%
3.4.5 Pollutant emissions
Reasonably complete information was available for NOx. Other components such as
particulate mass (PM) and methane (CH4) were primarily based on literature and expert
views. Sulphur dioxide emissions (SOx) are based on fuel sulphur contents.
3.4.5.1 NOx emissions
2011 – 2015
The NOx data was made available in different formats. For most engines it was
provided as a function of load or power or a value was given applicable to a certain
power range. In several cases the data was only given at constant speed while variable
speed data was needed (port ship and inland ship). For some engines the NOx emission
was only available as one average number. The method that is applied to calculate the
NOx during the actual load profiles is the one of ‘constant NOx to CO2 ratio’. This is
equivalent to ‘constant NOx to fuel consumption ratio’. This is for example an accepted
and used method for on-road heavy-duty engines [Verbeek 2008]. The way in which it
is applied is the following: Fuel consumption is calculated at the nominal engine power
for which the NOx is specified. Consequently the NOx/CO2 ratio is established. The
specific fuel consumption is calculated for the actual load profile. Then the nominal
NOx is multiplied with the ratio of actual and nominal specific fuel consumption: the
higher the specific fuel consumption (g/kWh), the higher the NOx. The precise data and
calculations are not included in this report because of confidentiality reasons.
For conventional diesel engines, such as applied in ships (i.e. without special NOx
control devices), the constant NOx to CO2 ratio is reliable and often published. For
lean-burn spark or compression ignition LNG engines, there is not very much data
available to confirm this so there is more uncertainty. For example the air/fuel ratio has
an impact on NOx for these engines and it is not known how well this is controlled at
low torque and power. The limited torque dependent data that was made available was
in line with these estimates. For the short sea and inland ship cases the uncertainty of
the NOx/CO2 ratio does not pose a problem because the average power is high enough
(respectively 45% and 72%). There is however more uncertainty for the tug ship
because the average power is only 15% of maximum power.
29. TNO report | TNO-RPT-2011-00166 | 1.0 29
The overall results for the specific NOx emissions are presented in Table 13. The LNG
results are averaged over the two or three engines for which information was available.
The engines which were used are specified in Table 11.
2016 and later
In 2016 more stringent emission limits are expected. In that year Tier III for sea going
vessels as well as CCNR IV will enter into force. The NOx limits are up to 75% lower.
For this study, it has been assumed that SCR deNOx with urea injection will be applied
to achieve the required reduction for the diesel engines. Also for some of the LNG
engines some additional NOx reduction may be necessary. With CCNR IV, the PM
limit for inland ships is some 90% lower. It is assumed that this can be achieved by
engine optimisation without aftertreatment (in combination with low sulphur fuel). This
is very similar to the strategy used for most Euro V truck engines (SCR, but no DPF).
The PM emissions for sea ships will especially benefit from the required fuel sulphur
content reduction. An overview of the emission limits is included in Table 15 and Table
16.
The estimated NOx emissions for 2016 and later are presented below. It should be noted
that the gas engines do not have a formal Tier III and CCNR IV certificate, even though
their emissions are below the limit values.
Table 13 Overview specific NOx emissions for engines running on diesel fuel and LNG
20162011 - 2015Case
LNG
EN590
LNG
EN590
LNG
MGO
Fuel
1.6 – 4.4
8.8
1.7 – 1.85
12
1.3 - 3
10
NOx
g/kWh
1.6 – 1.8LNG
1.8EN590Inland ship
110 m 11,45m
1.7 – 1.85LNG
2.2EN590Port ship:
80 ton TUG
1.3 – 2.3LNG
2MDOShort sea
Container feeder
800 TUE
NOx
g/kWh
Fuel
20162011 - 2015Case
LNG
EN590
LNG
EN590
LNG
MGO
Fuel
1.6 – 4.4
8.8
1.7 – 1.85
12
1.3 - 3
10
NOx
g/kWh
1.6 – 1.8LNG
1.8EN590Inland ship
110 m 11,45m
1.7 – 1.85LNG
2.2EN590Port ship:
80 ton TUG
1.3 – 2.3LNG
2MDOShort sea
Container feeder
800 TUE
NOx
g/kWh
Fuel
Note: NOx emissions for the port ship on EN590 are based on average engine power
being 15% of max power. The 2016 onwards scenario includes SCR deNOx for diesel
engines.
3.4.5.2 SO2 emissions
Table 14 lists the maximum sulphur levels within the fuels and the values used for the
emissions calculations. HFO is added for comparison only, because it is not the
reference fuel within any case. 2.7% (27000 ppm) is considered to be the world-wide
average. For the other diesel fuels a sulphur content of the fuel for the emissions
calculation is used of 20% below the limit value, because in practice the actual emission
levels are below the limit values. No compensation is applied for the sulphur ending up
as sulphate in the PM emission (5-10% of the S) [Duyzer 2007].
30. TNO report | TNO-RPT-2011-00166 | 1.0 30
For the sulphur content of LNG, information was made available from Shell. The
average S content of a set of shipments was 2.8 mg/Nm3. This corresponds to 3.5 ppm
by mass. It is not expected that sulphur levels in LNG will cause an issue regarding SOx
emissions, but they should be monitored and measured regularly as the sulphur grid
specs are typically a bit higher (Netherlands GTS spec for total sulphur is 30 mg/Nm3).
The specific SO2 emission is calculated with the following lower heating values:
-MDO & EN590 : 42.7 [MJ/kg]
-LNG : 49 [MJ/kg]
For LNG refer to Appendix A.
Table 14: Fuel sulphur (S) content and values used for the emissions calculations
Fuel S content [m/m] SO2 emission
max used
% ppm ppm g/kg g/kg g/MJ
HFO 4.5* 45000 27000 27 54 1.265
MDO 1.00 10000 8000 8 16 0.375
MGO 0.10 1000 800 0.8 1.6 0.0375
EN 590 0.001 10 8 0.008 0.016 0.000375
LNG 0.0037 37 3.5 0.0035 0.007 0.000143
* 2012: 3.5%
PM emissions
Very little PM emissions data were made available by the manufacturers. Consequently
the PM emissions are primarily based on literature and expert view. For the diesel fuels
with substantial sulphur a correction is made based on the S contents of the fuel. This is
done for MDO, MGO and HFO. The correction is 0.138 g PM per g sulphur (from the
fuel) based on a formula used by TNO for heavy-duty engines. Other sources gave even
somewhat higher numbers such as 0.157 g/g from EPA and 0.184 g/g from
CONCAWE. The latter was however meant for very low fuel sulphur contents, so not
applicable for the high sulphur contents of MGO, MDO and HFO. The TNO equation
for example leads for an MDO fuel with 0.8% S content to a correction of 0.22 g/kWh.
A nominal diesel fuel consumption of 200 g/kWh is used for this calculation. Together
with a base PM emission of 0.2 g/kWh, the overall PM number (for short sea) becomes
0.42 g/kWh.
For the dual fuel engines, reduction percentages compared to the diesel values were
given. For the spark ignition engines, the PM emissions are derived from heavy-duty
bus engines. PM emissions of these engines range from 0.003 to 0.02 g/kWh [Verbeek
2010b]. The 0.02 g/kWh is used for the spark ignition ship engines due to the absence
of more accurate data.
Table 15 and Table 16 give an overview of the PM limit values as well as the estimates
or submitted PM emissions for the diesel and gas engines. A range is specified when
there are more engine options with a difference in PM emissions.
31. TNO report | TNO-RPT-2011-00166 | 1.0 31
Table 15: NOx and PM limits and estimated PM levels for short sea and port ships with diesel and LNG
engines.
Short Sea and Unit Tier II Tier III optional
Port ship (2011) (2016)
NOx limit g/kWh 7.7 - 14.4 2 - 3.4
PM limit g/kWh none none
Fuel MDO MGO HFO
PM estim. short sea
- diesel engine g/kWh 0.42 0.22 0.95
- LNG engine g/kWh 0.02 - 0.21 0.02 - 0.21
PM estim. Port ship
- diesel engine g/kWh 0.15 0.03
- LNG engine g/kWh 0.02 0.02
Table 16: NOx and PM limits and estimated PM levels for the inland ship with diesel / LNG engines.
Inland ship Unit CCNR II CCNR IV optional
(2007) (2016)
NOx limit g/kWh 6.0 – 11.0 1.8 - 2.0
PM limit g/kWh 0.2 - 0.8 0.025
Fuel EN590 EN590 MGO
PM estimation
- diesel engine g/kWh 0.09 0.025 0.17
- LNG engine g/kWh 0.02 - 0.045 0.02 – 0.025
3.4.6 Emissions per year
The pollutant emissions in this report include NOx, SOx and PM. The emissions for
each engine are calculated at the reference load profile. The mass per year (kg/y)
calculations are done as follows:
− NOx and PM: Specific emissions per kWh mechanical work x total work per year
([g/kWh] x [kWh/y])
− SOx: Specific emissions per MJ fuel energy x fuel energy per year
([g/MJ] x [MJ/y])
In Table 17 and Table 18 the results are presented for the period 2011 – 2015 and for
2016 and later, respectively. The latter is based on the assumption that the diesel
engines will comply with the Tier III legislation (sea ships) and the CCNR IV
legislation (inland ships and port ships). The diesel engines will then have NOx
emission control devices, most probably being the SCR catalyst with urea injection.
32. TNO report | TNO-RPT-2011-00166 | 1.0 32
Table 17: Annual pollutant emissions for ships with diesel and LNG engines for 2011 - 2015
PMCase Fuel type NOx
[kg/y]
SOx
[kg/y] [kg/y]
Diesel 239,050 70,368 10,040
Short sea
LNG 58,169 596 3,506
Diesel 17,515 6 219
Port ship
LNG 2,620 2 29
Diesel 47,865 17 489Inland
ship LNG 16,262 8 177
Table 18: Annual pollutant emissions for ships with diesel and LNG engines for 2016 and later (diesel
engines equipped with deNOx SCR catalyst).
PMCase Fuel type NOx
[kg/y]
SOx
[kg/y] [kg/y]
Diesel 47.810 7.037 5.259Short sea
LNG 47.810 85 3.506
Diesel 3.211 6 44
Port ship
LNG 2.620 2 29
Diesel 9.788 17 136Inland
ship LNG 9.189 8 122
Figure 5 and Figure 6 graphically present the comparison between diesel and LNG
engines for respectively the period 2011 to 2015 and 2016 and later. The error bars in
the figures are added based on expert view. For NOx the possible error is related to the
different load points needed and for which data was provided. For PM it is primarily
related to the estimation of the PM value itself since very little data was provided. No
error bars are given for SOx, since SOx is only dependent on fuel S content. For short
sea, the difference is very large with an insignificant error. For the port and inland ships
the sulphur level is extremely low for both the LNG and the EN590 10 ppm S, so
differences are also insignificant. For NOx for 2016 also no error bars are added, since
the NOx values are primarily based on emission limits. In [Verbeek 2010] it was shown
though, that there can be large differences between real world NOx emission and
emission limits for trucks equipped with SCR deNOx systems.
From Table 17 and Figure 5, it can be concluded that NOx is three to eight times lower
for the LNG engines compared to the diesel engines. For SOx the improvement ranges
from a factor of two for the inland ship to a factor of more than 100 for the short sea
applications. The very large reduction for the latter is due to the high sulphur content of
MDO. Finally, the improvement of PM with LNG ranges from a factor of two to a
factor of ten.
For 2016 and later, the differences in emissions will become much smaller (refer to
Table 18 and Figure 6). Especially the differences in NOx will likely be small. For short
sea shipping in particular, a substantial reduction in SOx and PM level will remain,
33. TNO report | TNO-RPT-2011-00166 | 1.0 33
since the sulphur level within diesel fuel for sea ships is still high compared to the
sulphur content in LNG.
0%
10%
20%
30%
40%
50%
60%
70%
80%
90%
100%
Short Sea (MDO) Port ship (EN590) Inland ship (EN590)
LNGrelativetoDiesel
NOx
SOx
PM
Diesel = 100%
Reduction with LNG
Figure 5. Comparison annual air pollutant emissions between diesel and LNG engines for 2011 – 2015.
0%
10%
20%
30%
40%
50%
60%
70%
80%
90%
100%
Short Sea (MDO) Port ship (EN590) Inland ship (EN590)
LNGrelativetoDiesel
NOx
SOx
PM
Reduction with LNGDiesel = 100%
Figure 6. Comparison annual air pollutant emissions between diesel and LNG engines for 2016 and later
(diesel engines are assumed to be equipped with deNOx SCR catalyst).
3.5 Economic comparison
This section presents the results of the simple economic comparison between LNG and
Diesel fuels from the perspective of “usage costs”, focused on an analysis of the fuel
consumption. That is in turn based on the earlier estimates of yearly energy expenditure.
Some of the costs considered in the calculation are confidential (e.g. the engine prices),
and hence not all results can be shown.
34. TNO report | TNO-RPT-2011-00166 | 1.0 34
A number of general notes are worth mentioning:
− Based on input from stakeholders, it is assumed that maintenance costs are
comparable for LNG and the distilled diesels and were hence not included
− HFO is not considered among the fuels for the economic comparison
− Consumption of Adblue for SCR deNOx systems is not taken into account. This
could add about 3-6% on top of the fuel costs of the diesel cases
− Differences in engine efficiency are not taken into account. Energy consumption
for the LNG engines can be around 2% higher
− Additional shipping costs as a consequence of reductions in usable cargo
capacity (because of large LNG tanks) are not taken into account
The IMO legislation mentioned earlier implies that from 2016 onwards the
requirements for the diesel fuel will be more stringent (which impacts which fuel is
appropriate for the comparison) as well as introducing the need for after treatment (SCR
deNOx system) and hence also the considered costs. Since not all cases have a positive
marginal comparison towards LNG in both time periods, this issue opens the section.
It should be noted that, although that is outside the scope of the present study, the
general environmental advantage of LNG (both in terms of air quality-related pollution
and GHG emissions) could also be monetized and considered in the economic
estimates. Further, some other financial and non-financial impacts (e.g. port fee
reductions of up to 5-10% in some cases, green awards, reputation) could not be
included but may contribute to the overall case for deciding towards LNG vs Diesel.
These benefits might make LNG more attractive already now for all cases.
3.5.1 2011-2015 vs 2015/2016-onwards
The current fuel for Short Sea shipping is MDO, which is cheaper per MJ than expected
prices for LNG, thus making the LNG case less attractive for the time being. From 2015
onwards Short Sea shipping will be required to use MGO as fuel or to use MDO/HFO
in combination with an SOx scrubber. From 2016 onwards SCR afterteatment is also
necessary, to comply with the NECA (NOx Emission Control Areas). For this
evaluation only MGO is considered and the cost of the aftertreatment system is
included. So strictly speaking this economic evaluation is valid for 2016 onwards, but
the most relevant change for Short Sea (fuel change) takes place already from 2015
onwards. MGO is (depending on the selected chain) generally more expensive than
LNG per MJ. Because of the very high fuel consumption in MJ per year (due to high
total work per year), as well as the fact that diesel engines will face more costs because
of the required aftertreatment, LNG will probably be attractive from 2015/2016
onwards. That is investigated in the following sub-sections.
The fuel used for Inland vessels is EN590 (currently as well as from 2015/2016).
EN590 is more expensive per MJ than expected prices for LNG, and also the fuel
consumption in MJ per year (due to high total work) is relatively high, which implies
Inland ships may be expected to be attractive in the current period as well as from 2016.
However, the 2016 scenario is more interesting because of the additional after treatment
costs which will only need to be applied to Diesel engines. Once again, this is
investigated below.
35. TNO report | TNO-RPT-2011-00166 | 1.0 35
Based on this simple economic comparison, it seems that for the tug (harbour vessel) to
be attractive (in either the current period or from 2016), very low LNG prices would be
required. This is a result of relatively low fuel consumption, due to low total work per
year.
The following sub-sections explore each of the considered cost components
assuming the 2016-onwards situation (because the cost of SCR aftertreatment is
included for the diesel ships). Given that the exercise is a first-order comparison, the
differences to the current situation are not significant except for short sea shipping
which does not seem attractive now but will probably become attractive by 2015.
3.5.2 Fuel costs
LNG supply costs depend on the distribution chain considered, and hence the estimate
for fuel prices was different for 2 possible chains:
− Chain 1: Gate (peakshaver) – uses Gate terminal in combination with buffering
facilities of the peakshaver. This would require a pipeline between Gate and
Peakshaver, but has the lowest investment costs overall.
− Chain 2: Gate terminal – in combination with a new breaking bulk terminal. This
can be of high or low volume resulting in lower or higher LNG costs.
An overview of the diesel and LNG fuel costs (expressed in US Dollars/MMBTU)
based on input from the stakeholders is presented in Table 19. Although the calculations
are always based on energy units (MMBTU), the USD cost per ton of LNG can be
obtained by multiplying the values on the right side of the table by 46.5 MMBTU/ton.
Table 19: Estimated fuel costs at a crude price of 75 $/bbl. 1 MMBTU is 1055 MJ.
MDO EN590 MGO Gate (peakshaver)
Short sea $10.4 $16.2 $12.5 $13.5 $15.5
TUG $16.5 $12.5 $13.5 $15.5
Inland ship $16.5 $12.5 $13.5 $15.5
Gate high/low volume
Diesel
Fuel costs USD/MMBTU
LNG
Since the ensuing calculations were performed in Euro, the first step was converting the
currencies at an exchange rate of 0.80 Euro to the Dollar:
Table 20: Estimated fuel costs at a crude price of 75 $/bbl and EURO/$ rate of 1.25. 1 MMBTU is 1055 MJ.
MDO EN590 MGO Gate (peakshaver)
Short sea 8.3 13.0 10.0 10.8 12.4
TUG 13.2 10.0 10.8 12.4
Inland ship 13.2 10.0 10.8 12.4
Fuel costs EURO/MMBTU
Diesel LNG
Gate high/low volume
As noted before, MDO is expected to stay less expensive per MJ than LNG. Where
LNG does have the lowest cost per MJ, the economic benefit depends on enough
fuel/energy consumption (MJ) a year to offset the higher installation costs of LNG.
Based on the estimated fuel costs provided by stakeholders and the yearly energy
consumption of the 3 cases, the following overview was made to express the benefit of
fuel costs (LNG vs the appropriate diesel) on a yearly basis.
36. TNO report | TNO-RPT-2011-00166 | 1.0 36
Table 21: Benefit of fuel costs (LNG vs the appropriate diesel) on a yearly basis for the 3 cases (short sea
from 2015 onwards, tug and inland ship from 2016 onwards)
Gate (peakshaver)
Short sea (MGO) 435 285 -15
Tug (EN590) 45 34 11
Inland ship (EN590) 132 97 27
Benefits of fuel costs (Thousand Euro / Year)
LNG compared to MGO & EN590
Gate (high/low volume)
Case
It should be noted that, even for the same supply chain, the fuel costs depend on the oil
price (calculations are based on current oil prices and an exchange rate of 1EUR to
1.25USD), as well as demand and supply. None of these effects was considered here.
3.5.3 Fuel storage system costs
LNG tank costs are considerably higher than for diesel because of the inherently more
complex design (maintaining a relatively high pressure and ensuring safety at all times).
For a tank of higher volume, the cost per cubic meter is lower because of scaling
benefits, but nevertheless, the higher the volume, the higher the total tank costs.
The usable volume of the LNG tanks was assumed to be 90%.
Table 22: Volumes and estimated costs of “total gas train including LNG tank” for the 3 cases. Note that
these estimates include gas regulation, vaporizer, gas detection etc.
Short sea 550 610 3080
TUG 40 45 570
Inland ship 40 45 570
LNG storage
capacity required
(m3)
LNG tank
capacity
required (m3)
Cost of LNG
tanks (Thousand
Euro)
Case
These estimates for LNG tank systems – “LNG tank including total gas train”, thus
including gas regulation, vaporizer, gas detection etc – cover the best quality tanks, with
high insulation standards and stringent class approval. Less expensive systems are
available (in some cases up to 50% cheaper on the tank itself), but these do not meet the
quality standards desired in the industry.
Tank costs for diesel were simply assumed to be 10% of the LNG case.
3.5.4 Engine and aftertreatment costs
LNG and Diesel engine costs were received from stakeholders and compared. It was
found that the LNG packages (including control equipment) are estimated to cost
approximately 40 to 45% more than Diesel, depending on the amount of engine power
(the higher the power, the lower the cost per unit of power). For the inland ship no
engine cost figures were provided, and thus the estimate was expert-opinion-based.
Expert-opinion-based estimates for the cost of aftertreatment systems for the diesel
cases were also included. In fact, unlike diesel engines, LNG engines will in most cases
37. TNO report | TNO-RPT-2011-00166 | 1.0 37
not require aftertreatment. Diesel engines are expected to fulfil the emission limits from
2016 with SCR deNOx aftertreatment systems. The costs of aftertreatment systems
become higher for higher engine power. A need for diesel particulate filters is not
expected. The following additional costs for the SCR aftertreatment systems were used:
- Inland ships: EUR 90,000
- Tug ship: EUR 200,000 (for two engines)
- Short sea ship: EUR 300,000
In some cases these costs are lower than what is currently quoted for individual ships.
In fact, based on experience with SCR systems for trucks, it is expected that prices will
go down substantially when series application picks up under pressure of the legislation.
It can be observed that the diesel aftertreatment system costs are low compared to the
additional costs of an LNG installation (engine + fuel storage).
3.5.5 On-board operational costs
In discussion with the relevant stakeholders (engine suppliers and ship builders), the
team found the consensus that on-board operational costs (e.g. maintenance, repair)
could be considered to be equivalent for LNG and (non-HFO) diesel. They were thus
not included.
3.5.6 Not considered costs
A number of relevant non-operational – e.g. safety measures, education, PR – costs lie
outside the scope of this project and were therefore not considered. However, given
their importance and probable distinction between the 2 fuels, the team recommends
that these are included in follow-up studies.
3.5.7 Conclusions
Based on the numbers provided by stakeholders, as a first order approach the overall
engine + aftertreatment + tank costs of LNG seem to be a factor of ~1.5 to ~2.0 higher.
Taking the above and the fuel costs into account, a cost comparison was made between
LNG and diesel for the 3 cases on a yearly basis in the 2015/2016 onwards situation.
The differences to the current situation are not significant except for short sea shipping
which does not seem attractive now (because it is still allowed to use MDO which is
cheaper than LNG) but will probably become attractive by 2015 (when using MGO).
To that end, a breakeven LNG price was calculated as a discount in relation to the
relevant liquid fuel (MGO or EN590) in order to cover the additional investment costs
plus cost of capital at a rate of 5%. This exercise was performed for a payback of 5 and
10 years and the required price difference (in Euro/MMBTU) is shown below.
38. TNO report | TNO-RPT-2011-00166 | 1.0 38
Table 23: Break-even price of LNG vs diesel fuels (in Euro/MMBTU) for the 3 cases in the 2016 onwards
situation (for short sea from 2015 onwards)
… in 5 years … in 10 years
Short sea (MGO) 4.4 2.5
Tug (EN590) 20.6 10.3
Inland ship (EN590) 3.9 2.1
Case (liquid fuel)
Needed LNG discount to break even
[EUR] (in relation to relevant diesel)
(Note: the engine cost for the inland ship was estimated through expert opinion, and
non-operational costs are not considered. All financial figures assumed constant)
When comparing Table 23 with Table 20, it can be concluded that for the short sea and
the inland ship application, the required discount on the LNG price vs diesel in order to
break even in 5 to 10 years could be realistic. For the tug case to be attractive other
benefits (e.g. environmental) should be valued. In any case, investments in LNG
systems (including engine) can possibly be reduced by applying a hybrid powertrain,
since the LNG tank size and possibly also engine size can then be reduced. Pollutant
emission levels for both the LNG as well as the diesel engines are also expected to
benefit from a hybrid powertrain since long periods of low power can be avoided.
39. TNO report | TNO-RPT-2011-00166 | 1.0 39
4 Discussion
The results of this study show that, with the application of LNG, reductions can be
achieved for both greenhouse gas (GHG) as well as air pollutant emissions. This was
concluded for all three studied cases: a short sea ship, a port ship (harbour tug) and an
inland ship. Compared to other studies the results are more favourable for both the
GHG emissions as well as the air pollutant emissions.
Greenhouse gas emissions
The advantage in GHG emissions with LNG can be attributed to the following reasons:
- the carbon content of the fuel (or the lower C-H ratio, i.e. a relatively large part
of combustion energy is from oxidation of H to H2O rather than C to CO2)
- the engine efficiency of ship engines running on LNG is only marginally lower
than the efficiency of diesel engines. This in contrary to other applications such
as passenger cars and trucks where efficiencies with natural gas are generally
20-30% lower.
The high engine efficiency is probably related to the advanced stage of development of
the gas engines for ships (and stationary engines) in combination with the combustion
principles chosen. The combination of lean burn combustion with a relatively high
specific power output can lead to high engine efficiency. That is basically the case for
all LNG engines evaluated in this study.
Naturally, GHG emissions can be further reduced with the application of biofuels.
Air pollutant emissions
Given its intrinsically global and complex environment, the shipping sector currently
has relatively less stringent emissions legislation in comparison with other sectors (e.g.
road transport). That is part of the reason for the large advantages in air pollutant
emissions obtained with gas engines, since the liquid fuel engines they would replace
basically do not have any special NOx control device such as an SCR catalyst or EGR
(Exhaust Gas Recirculation). In 2016 however, NOx and PM limits (for inland ships)
need to be reduced by 75% or more. Most LNG engines evaluated can already achieve
these limits now. This means of course an enormous improvement in air pollutant
emissions if LNG is used in the coming five years. For sea ships there is also an
enormous improvement in SOx and PM emissions due to the high sulphur content of
the current fuels: HFO and MDO. The sulphur content is about 1% - 2.7%. This is to a
large extent responsible for the PM emissions. It should be noted that the LNG engines
do not have a formal Tier III and CCNR IV certificate, even though their emissions are
below the limit values. This would be desirable in order to demonstrate their good
performance with low emissions.
For the harbour tug, there is more uncertainty about the air pollutant emissions levels
(especially NOx) due to the load pattern which implies long periods at low power
output. Diesel aftertreatment systems necessary for 2016 and later are not expected to
work properly but also for LNG the emissions may be compromised. Apart from
potential savings in energy consumption, the air pollutant emissions are a reason to
strongly consider a hybrid driveline for tugs to avoid the long low-power periods.
40. TNO report | TNO-RPT-2011-00166 | 1.0 40
Accuracy of the data
The supplied engine data was not very complete. Therefore for all engines, projections
needed to be made to calculate the emissions and energy consumption for the medium
and lower power engine points. This leads to uncertainties. It is therefore recommended
to obtain data for the precise engine load pattern when an engine is selected, if needed
by performing independent testing. Also performance during engine transients could be
important.
Especially for the tug application, with its average power of only 15% of Pmax, there is
a risk that the projected data differs from the real world situation. The energy
consumption and emissions at the very low load point may not be very reliable. The
LNG engine may be more sensitive to engine efficiency due to the necessary throttling.
Dual fuel engines may stop using LNG at very low load. On the other hand (NOx)
emission control devices of future diesel engines may not work very well at the low
power points. In a recent study on Euro V trucks it was concluded that NOx emissions
under urban driving conditions were up to 3 times higher than what would be expected
based on the emissions limits [Verbeek 2010]. Based on the differences in calculated
engine efficiency, it can be concluded that for the tug there is a potential of some 10%
to 20% reduction in energy consumption if the low engine power modes can be avoided
by for example a hybrid drive line. The advantages in pollutant emissions would be
even much larger. So developing environmentally friendly tugs is not only about fuels
and/or exhaust aftertreatment, but also about hybridisation of the drive train. During
recent years, several studies about tugs with hybrid drivelines have been done. Refer to
E3 tug [Botke 2009], [SMIT E3 Tug] and Greentug [Offshore 2010].
Ship design and operational aspects
The energy content per litre LNG is only 45% of that of diesel fuel. In combination with
the less efficient packaging of the cylindrical tank(s) and the insulation of the cryogenic
tanks, the space required for fuel storage is about a factor of three larger with LNG.
Especially for the tug it appeared difficult to find space for a reasonable amount of LNG
storage and even then the autonomy would be reduced from several months to several
weeks. A further design study might clarify and potentially improve this situation.
Also for ships with diesel engines more space will be required in the future. To meet the
Tier III limits for sea ships or the CCNR IV limits for inland ships, the manufacturers
will most likely choose SCR deNOx catalysts to meet the NOx limit levels.
Costs
A ship with an LNG engine is considerably more expensive than a diesel ship. This is
mostly due to the high costs of the vacuum insulated, cylindrical LNG tanks and
associated gas fuel system. Also the LNG engine itself is often more expensive than the
diesel engine. Roughly speaking, the price of the engine plus fuel storage is twice as
high as with a diesel powertrain. After 2016 the difference will be smaller because the
diesel engines will need an SCR catalyst. The price of the SCR catalyst however is
expected to add only about 10% to the engine costs, which is low compared to the costs
of the LNG storage system. There may be scope for LNG storage at lower cost, for
example by using lower quality insulation and/or by using atmospheric tanks instead of
pressurised tanks. This has however an influence on the fuel system design and would
need to be investigated. It should still be mentioned that for a dual-fuel engine where
the gas is mixed with the inlet air (20% diesel, 80% gas), atmospheric pressure is fine
and consequently the application of atmospheric tanks is more feasible.
41. TNO report | TNO-RPT-2011-00166 | 1.0 41
Concretely, this study allows for the following observations:
• Short sea shipping on LNG (alternative fuel: MGO) would have high initial
costs because of the large tank (610m3
), but still be viable for 2016 and later
with an LNG price discount of 4.4 EUR/MMBTU below the diesel price for a
payback of 5 years and 2.5 EUR/MMBTU for a payback of 10 years. The main
driver is the high yearly energy consumption. Once again, it should be noted
that before 2016 short sea shipping can use low cost MDO and avoid
aftertreatment (SCR deNOx), which does not seem to present an attractive
economic case for LNG.
• Harbour vessels (tugs) on LNG, assuming the current conventional design, do
not seem to present a reasonable breakeven time – for a payback within 10
years, an LNG price discount of 10.3 EUR/MMBTU below the diesel price
would be needed, which is not realistic. This is mostly due to the relatively low
yearly fuel consumption and high costs for LNG engines and LNG tanks.
Because of their usage profile, tugs would be ideally suited to explore hybrid
electric drive systems. This would probably reduce energy consumption by
10% to 20%. It would also reduce LNG systems (tank + engine) costs
depending on the hybrid configuration. Both reductions would likely make
application of LNG more attractive and reduce the breakeven time. This topic
could be covered in depth as a part of a follow-up study.
• Inland shipping on LNG (current fuel: EN590) implies a relatively high yearly
fuel consumption and requires a relatively small tank (45m3
) at a contained
cost. The inland ship thus seems to offer an attractive case: for a payback in 5
years the LNG price discount would be 3.9 EUR/MMBTU below diesel price,
while for 10 years that discount would stand at 2.1 EUR/MMBTU. Note:
engine costs for the inland ship were expert-opinion-based.
For the near future, a relatively high LNG price is more likely due to the low overall
LNG volumes. In that case, primarily environmental reasons will stimulate the use of
LNG. Also, LNG long term fuel prices were not estimated, but they are not expected by
stakeholders in the fuel sector to increase at a higher rate than long term crude/oil
prices.
42. TNO report | TNO-RPT-2011-00166 | 1.0 42
5 Conclusions
A case study has been done in which air pollutant and greenhouse gas emissions of
LNG and diesel fuel for marine applications were compared. Three cases were
evaluated:
1) a short sea ship: 800 TUE container feeder
2) a port ship: 80 ton harbor tug
3) an inland ship: 110 x 11.5 m
The main conclusions are:
− Well-to-Propeller (WTP) greenhouse gas emissions with the most logical LNG
chains are about 10% lower than the diesel fuel chains. Further improvement is
possible by lowering the relatively high methane (CH4) emissions of the engines
(see Figure 1).
− Replacement of diesel fuel with LNG for the maritime sector offers large
advantages in air pollutant emissions, and it will probably already today meet the
requirements of Tier III and CCNR IV, which will enter into force in 2016.
Incomplete information leads to uncertainties though (see Figure 2a).
− After 2016, when compared to Tier III /CCNR IV-compliant diesel fuelled engines,
LNG will still offers benefits in the area of PM, SOx, and CO2 Well-to-Propeller.
The benefits in NOx emissions performance will however become smaller (see
Figure 2b).
− Further greenhouse gas emission reductions for both LNG and diesel are possible
by using biofuels. LNG can be replaced by bio-LNG or LBG (Liquefied Bio Gas),
diesel can be replaced by biodiesel, HVO (Hydrotreated Vegetable Oil), PPO (Pure
Plant Oil) or possibly even pyrolysis liquid, but these fuel may require engine
adaptations and increase maintenance.
− Application of LNG is only economically viable if the fuel price is low enough to
compensate for the additional costs of the LNG fuel storage system. The cost of an
LNG engine plus fuel tank system is about twice as high as a diesel engine plus fuel
tank. Also the packaging of the LNG fuel tank on board of a ship can be an issue -
especially application on the tug is critical. Under the assumptions made in this
study, short sea (from 2016) and inland shipping (already now) seem to offer an
attractive case, with realistic LNG price discounts of 2.5 EUR/MMBTU and 2.1
EUR/MMBTU below prices of diesel fuel, respectively, for payback within 10
years, and 4.4 EUR and 3.9 EUR below diesel fuel for payback within 5 years. The
harbour vessel (tug) would require an LNG price discount of 10.3 EUR below the
diesel fuel for a payback in 10 years, which does not seem to be realistic.
LNG long term fuel prices were not estimated, but they are not expected by
stakeholders in the fuel sector to increase at a higher rate than long term crude/oil
prices.
43. TNO report | TNO-RPT-2011-00166 | 1.0 43
6 Recommendations
The following recommendations are made:
− Measure or obtain more detailed (real-world) air pollutant and greenhouse gas
emissions data for future applications. Precise NOx and methane (CH4) emissions
data is especially necessary.
− Investigate potential for improvement of:
− CH4 emissions from engines
− CH4 emissions during production and transport of LNG
− Study options for LNG tanks of lower cost, such as with alternative insulation
and/or atmospheric (rather than pressurised) configuration.
− Specifically for tugs (harbour ships), follow-up work could explore hybrid electric
drive systems in depth3
, which may reduce energy consumption by more than 10%
and make application of LNG more attractive.
3
See for example [Offshore 2010] and [SMIT E3 Tug]